www.atmos-chem-phys.net/11/13161/2011/ doi:10.5194/acp-11-13161-2011
© Author(s) 2011. CC Attribution 3.0 License.
Chemistry
and Physics
Contrasting winter and summer VOC mixing ratios at a forest site
in the Western Mediterranean Basin: the effect of local biogenic
emissions
R. Seco1,*, J. Pe ˜nuelas1, I. Filella1, J. Llusi`a1, R. Molowny-Horas2, S. Schallhart3,**, A. Metzger4, M. M ¨uller3,***, and A. Hansel3
1Unitat d’Ecologia Global CREAF-CEAB-CSIC, Centre de Recerca Ecol`ogica i Aplicacions Forestals (CREAF), Universitat Aut`onoma de Barcelona, 08193 Bellaterra (Barcelona), Catalunya, Spain
2Centre de Recerca Ecol`ogica i Aplicacions Forestals (CREAF), Universitat Aut`onoma de Barcelona, 08193 Bellaterra (Barcelona), Catalunya, Spain
3Institut f¨ur Ionenphysik und Angewandte Physik, Universit¨at Innsbruck, Technikerstrasse 25, 6020 Innsbruck, Austria 4Ionicon Analytik, Eduard-Bodemgasse 3, 6020 Innsbruck, Austria
*now at: Atmospheric Chemistry Division, National Center for Atmospheric Research, Boulder, CO 80301, USA **now at: Department of Physical Sciences, Division of Atmospheric Sciences P.O. Box 64, Gustaf H¨allstr¨ominkatu 2, 00014 University of Helsinki, Finland
***now at: DBFZ Deutsches BiomasseForschungsZentrum gemeinn¨utzige GmbH, Torgauer Straße 116, 04347 Leipzig, Germany
Received: 17 May 2011 – Published in Atmos. Chem. Phys. Discuss.: 19 July 2011
Revised: 10 November 2011 – Accepted: 8 December 2011 – Published: 21 December 2011
Abstract.Atmospheric volatile organic compounds (VOCs) are involved in ozone and aerosol generation, thus having im-plications for air quality and climate. VOCs and their emis-sions by vegetation also have important ecological roles as they can protect plants from stresses and act as communi-cation cues between plants and between plants and animals. In spite of these key environmental and biological roles, the reports on seasonal and daily VOC mixing ratios in the liter-ature for Mediterranean natural environments are scarce.
We conducted seasonal (winter and summer) measure-ments of VOC mixing ratios in an elevated (720 m a.s.l.) holm oak Mediterranean forest site near the metropolitan area of Barcelona (NE Iberian Peninsula). Methanol was the most abundant compound among all the VOCs mea-sured in both seasons. While aromatic VOCs showed al-most no seasonal variability, short-chain oxygenated VOCs presented higher mixing ratios in summer, presumably due to greater emission by vegetation and increased photochem-istry, both enhanced by the high temperatures and solar ra-diation in summer. Isoprenoid VOCs showed the biggest seasonal change in mixing ratios: they increased by one or-der of magnitude in summer, as a result of the vegetation’s
Correspondence to:R. Seco (roger@creaf.uab.cat)
greater physiological activity and emission rates. The max-imum diurnal concentrations of ozone increased in summer too, most likely due to more intense photochemical activity and the higher levels of VOCs in the air.
1 Introduction
Volatile organic compounds (VOCs) present in the atmo-sphere have both natural and anthropogenic sources. Among the natural origins, emission by vegetation is regarded as the greatest source at a global scale (Guenther et al., 2006). VOCs play several key roles in atmospheric chemistry which make them highly relevant for study, for example their impli-cation in tropospheric ozone and aerosol generation. VOCs, together with nitrogen oxides (NOx)and solar radiation are the ingredients needed to promote the photochemical forma-tion of tropospheric ozone (Atkinson, 2000; Sillman, 1999). Ozone is an oxidant pollutant that has negative effects on plants (Fowler et al., 2009), poses a threat to human health (Lippmann, 1993) and acts in the troposphere as a green-house gas. VOCs are also precursors of atmospheric aerosols (Kavouras et al., 1998; Tunved et al., 2006), which can have significant climate implications (Kulmala et al., 2004; Paci-fico et al., 2009). In a context of global change, the rela-tionships between VOCs, particles and ozone are a hot topic in current scientific research (Pe˜nuelas and Staudt, 2010). They all are involved in biogeochemical cycles and take part with other global change drivers in complex feedbacks with the climate (Arneth et al., 2010). Atmospheric VOCs and their emissions by vegetation are also ecologically impor-tant because VOCs can protect plants against high temper-atures (Pe˜nuelas et al., 2005; Singsaas and Sharkey, 1998), high irradiance (Pe˜nuelas and Munn´e-Bosch, 2005), and ox-idative stress (Pe˜nuelas and Llusi`a, 2002, Velikova et al., 2005). In addition, they also act as plant-plant communi-cation signals (Baldwin et al., 2006; Kegge and Pierik, 2010; Pe˜nuelas et al., 1995; Seco et al., 2011). Likewise, VOCs play a role in plant-animal relationships, not only involving plant-pollinator relationships (Wright and Schiestl, 2009) or direct defense against herbivores, but also indirect defense through the attraction of the natural enemies of the herbivores (Kessler and Baldwin, 2001; Llusi`a and Pe˜nuelas, 2001).
In the Mediterranean area, where the potential for biogenic VOC emissions and photochemistry is high, ozone and par-ticle formation can be elevated and the ecological role of VOCs can be very significant. However, there is scarce in-formation on tropospheric VOC mixing ratios in the Mediter-ranean region. Ozone has been measured in high concentra-tions in the Mediterranean area (Gimeno et al., 1995; Ribas and Pe˜nuelas, 2004; Ziomas, 1998), and has already been re-ported to produce damage to plants in the Western Mediter-ranean Basin (Ribas et al., 2005; Sanz et al., 2000). More-over, ozone concentrations have been found to increase with altitude (Diaz-de-Quijano et al., 2009; Evtyugina et al., 2009; Ribas and Pe˜nuelas, 2006).
In recent years, the proton transfer reaction mass spec-trometer (PTR-MS) has enabled the simultaneous measuring of several VOCs, including some oxygenated VOCs that are difficult to measure with other techniques (Seco et al., 2007, 2008). Also, PTR-MS has improved the temporal
resolu-tion of these measurements, to the point of making the use of micrometeorological techniques possible (Karl et al., 2001). Of late, papers have reported several concomitant surface-level VOC mixing ratios in natural areas, taking advantage of the PTR-MS technology in boreal and temperate regions (e.g. Holst et al., 2010; Jordan et al., 2009; Lappalainen et al., 2009; Ruuskanen et al., 2009; Spirig et al., 2005). Nev-ertheless, there are few studies dealing with Mediterranean ecosystems (e.g. Davison et al., 2009).
In this paper we report VOC data gathered during 2009 in an elevated site highly representative of the montane Mediterranean forest (Terradas, 1999), located in a forested mountain slope, in the Western Mediterranean Basin. We compared the VOC mixing ratios between winter (February– March) and summer (July–August), and analysed their rela-tionship with meteorological data, and with ozone (O3)and nitrogen oxides (NOx, i.e. NO and NO2)concentrations. We also compared the VOC mixing ratio values and daily trends at this Montseny (MSY) site with those reported in the exist-ing literature for other natural areas worldwide.
2 Methods
2.1 Measurement site
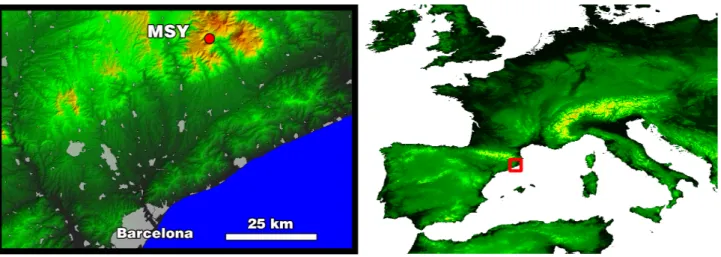
The Montseny site (MSY) was located within a densely forested natural park about 50 km to the NNE of the city of Barcelona (Catalonia, NE of the Iberian peninsula) and 25 km from the Mediterranean coast (41◦
46′
45.63′′
N 02◦21′28.92′′E, 720 m a.s.l.; Fig. 1). The site is highly
repre-sentative of the montane holm oak (Quercus ilexL.) forests in the Mediterranean regions of France, Italy, Greece and east-ern Spain (Terradas, 1999). At Montseny, these are dense forests of resprout origin, which evolved from coppicing un-til the 1950s and selection thinning afterwards (Avila and Rodrigo, 2004).
To our knowledge, this was the first time that VOC mix-ing ratios were measured continuously over several days at this Mediterranean forest location, which has a long record of other ecological and biogeochemical parameters such as nutrient cycling (Avila et al., 2002), dry and wet deposi-tion (Avila et al., 1998, 2007, 2010; Avila and Rod`a, 2002; Avila and Alarcon, 2003), hydrology (Pi˜nol et al., 1992), and particulate matter (Pey et al., 2009; P´erez et al., 2008), among others.
2.2 VOC measurements
Fig. 1.Location of the Montseny (MSY) measurement site, in relation to the city of Barcelona.
Table 1.Masses measured with the different PTR-MS systems and the corresponding VOC identity assigned to them. The mean sensitivity and the limit of detection for each VOC are also displayed. Sensitivities shown are transmission corrected and normalized to the primary ion signal, taking into account all major molecular fragments. Detection limits (DL) were inferred from a signal to noise ratio (S/N) of 2
according to DL = 2×SDblank/sensitivity, with SDblankbeing the standard deviation of background countrates, as reported elsewhere (Karl
et al., 2003).
PTR-ToF-MS (winter) PTR-Quad-MS (summer)
measured measured
Assigned VOC exact Sensitivity Limit of nominal Sensitivity Limit of
identity protonated (ncps ppbv−1) detection protonated (ncps ppbv−1) detection
mass (ppbv)c mass (ppbv)d
Methanol 33.033 12.8 0.011 33 17.9b 0.415
Ethanol 47.048 1.1 0.066 – – –
Ethanol/formic acid – – – 47 16.2b 0.092
Acetone 59.049 22.4 0.003 59 28.5b 0.013
Acetaldehyde 45.033 22.4a 0.010 45 28.5b 0.036
Acetic acid 61.028 22.4a 0.008 61 17.5b 0.031
Isoprene 69.069 10.6 0.002 69 12.7b 0.021
MVK/MACR 71.09 22.4a <0.001 71 28.1b 0.009
Monoterpenes 81.070 and 137.132 15.0 0.004 81 and 137 18.5b 0.029
Benzene 79.054 12.5 0.001 79 16.9 0.008
Toluene 93.069 14.8 <0.001 93 16.9 0.015
C-8 aromatics 107.085 16.2 <0.001 107 15.9 0.010
Acetonitrile 42.033 22.6 0.001 42 19.2b 0.013
aThese sensitivities were not measured in calibrations, and acetone sensitivity was used instead.bThese sensitivities were not measured in calibrations, but calculated using proton
transfer reaction rate coefficients and transmission coefficients.cCalculated for a 30 min integration time.dCalculated for an integration time of 2 s, except for mass 33 (0.5 s) and
for masses≥107 (5 s).
air through a heated inlet line (4 m long), made either of de-activated Sulfinert (winter) or teflon (summer) tube, installed at 3 m height in a forest gap. The inlet line was filtered with a teflon membrane (winter) or glass wool (summer) to pre-vent dust and particle intake. System background for both in-struments was measured approximately every two hours by sampling zero air made by passing air through a catalytic converter, and instrument sensitivities were obtained by fre-quent calibrations with gas standards (Table 1).
Table 2.Minimum and maximum VOC mixing ratios (ppbv) recorded at MSY station during the winter and summer campaigns.
Winter Summer
Hourly Hourly Hourly Hourly
averages averages averages averages
VOC Minimum Maximum minimum maximum Minimum Maximum minimum maximum
Methanol 0.256 9.761 1.279 2.704 1.410 13.400 4.142 6.053
Ethanol/formic acid <0.066 8.950 0.474 2.083 0.374 4.480 1.146 2.869
Acetone 0.257 3.897 0.787 1.547 0.967 5.950 2.260 3.834
Acetaldehyde 0.071 1.885 0.227 0.657 <0.036 3.370 0.541 1.264
Acetic acid 0.026 5.348 0.393 1.428 0.270 5.640 1.317 2.940
Isoprene 0.003 0.184 0.019 0.071 <0.021 1.250 0.152 0.753
MVK/MACR 0.002 0.153 0.011 0.047 <0.009 1.040 0.166 0.537
Monoterpenes <0.004 0.234 0.005 0.067 0.035 2.560 0.127 1.421
Benzene 0.059 0.470 0.105 0.190 0.008 0.194 0.039 0.090
Toluene 0.001 1.903 0.057 0.408 <0.015 1.340 0.083 0.467
C8-aromatics 0.003 1.328 0.031 0.249 <0.010 0.821 0.091 0.272
Acetonitrile 0.027 0.258 0.075 0.101 0.037 0.588 0.159 0.216
operated at 2.3 mbar, 600 V, and 50◦
C which corresponds to an E/N ratio of 130 Td (E being the electric field strength and N the gas number density; 1 Td = 10−17V cm2). Sensi-tivity calibrations for the PTR-TOF were performed by dy-namic dilution of VOCs using a multi-component gas stan-dard (Apel Riemer Environmental Inc., USA). The cali-bration gas contained acetone, acetonitrile, acrolein, ben-zene, 2-butanone, ethanol, formaldehyde, hexanone, iso-prene, methanol, monoterpenes (α-pinene), toluene, o- and p-xylene. The time-of-flight path length is sensitive to temperature variation and therefore mass scale calibration was done continuously by adding dichlorobenzene (pro-tonated m/z= 146.9763) and trichlorobenzene (protonated m/z= 180.9373) to the PTR-TOF inlet.
During the summer measurements, the site was equipped with a High Sensitivity Proton Transfer Reaction-Quadrupole-Mass Spectrometer (PTR-Quad-MS, described by Lindinger et al., 1998). This instrument was operated at 2.3 mbar, 580 V, and 50◦
C drift tube conditions, which corresponds to a E/N of 122 Td. Sensitivity calibrations for the PTR-Quad-MS were performed by dynamic dilution of an aromatic VOC gas standard (TO-14A, Restek, Belle-fonte, PA, USA). The calibration gas contained benzene, toluene, chlorobenzene, dichlorobenzene, styrene, ethyl benzene, xylene, trimethylbenzene, and trichlorobenzene. In addition, vapors of isoprene and monoterpene (α-pinene and limonene) liquid standards were sampled to measure their relative transmission efficiency and their fragmentation pattern. Mixing ratios of VOCs not present in the calibration standard were calculated taking into account the VOC relative transmission, their measured fragmentation pattern and their proton transfer reaction rate coefficients reported elsewhere (Zhao and Zhang, 2004) as described by de Gouw and Warneke (2007).
For clarity, we have divided the measured VOCs into three groups according to their structure and characteristics. One group is composed of short-chain oxygenated compounds (oxVOCs): methanol, acetone, acetaldehyde, acetic acid, and formic acid/ethanol (see Seco et al., 2007 for a review). The second group is formed by the isoprenoids: isoprene and monoterpenes, and we additionally included here the compounds methyl vinyl ketone (MVK) and methacrolein (MACR), which are oxidation products of isoprene. The third group contains the aromatic volatiles: benzene, toluene, and C8-aromatics (a term that includes compounds like xylenes). Finally, we also analyzed acetonitrile.
2.3 Meteorology and measurements of inorganic gaseous pollutants
During both periods, meteorological data such as tempera-ture, relative humidity, wind direction and speed, precipita-tion, and solar radiation was gathered from an air monitoring station that is part of the EUSAAR network (European Su-persites for Atmospheric Aerosol Research, recently created to integrate the measurements of atmospheric aerosol proper-ties at 21 high quality European ground-based stations). This station was located 200 m away from the PTR-MS sampling site, in the same slope of the mountain and at the same al-titude (720 m a.s.l.). The actual measurements were taken from a tower, at 10 m height (Pandolfi et al., 2011). In summer there were calibration factor problems for the wind speed data, so we recalibrated the measurements according to previous research conducted at the same area and according to the data gathered in three nearby meteorological stations (Santa Maria de Palautordera, Viladrau, and Tagamanent at 13, 8, and 7 km of distance).
Real time measurements of ambient air levels of O3 and NOx (NO and NO2) were provided by conventional gas phase air pollution monitors installed at the same station and maintained by the Department of the Environment of the Catalan Government (Generalitat de Catalunya). Lev-els of NOxwere measured by a chemiluminescence analyzer (model 42iTL, Thermo Scientific) and those of O3 by the ultraviolet photometric method (model 48AUV, MCV S.A., Barcelona).
2.4 Data analysis and statistics
Calculations of VOC mixing ratios from the PTR-MS data, together with the treatment and graphing of the data time se-ries, were conducted using Igor Pro (Wavemetrics Inc., Port-land, OR, USA). The correlation coefficients between all the available data variables (VOC mixing ratios, wind, temper-ature, solar radiation, and NO2 and O3) were calculated, in order to conduct a preliminary screening of possible re-lationships (see Supplement). For this purpose the Statis-tica (StatSoft Inc., Tulsa, USA) package was used. In ad-dition, wavelet analysis was applied to analyze the relation-ship between VOC mixing ratios and ozone concentrations in summer (see Supplement).
3 Results
3.1 Meteorological conditions and atmospheric dynamics
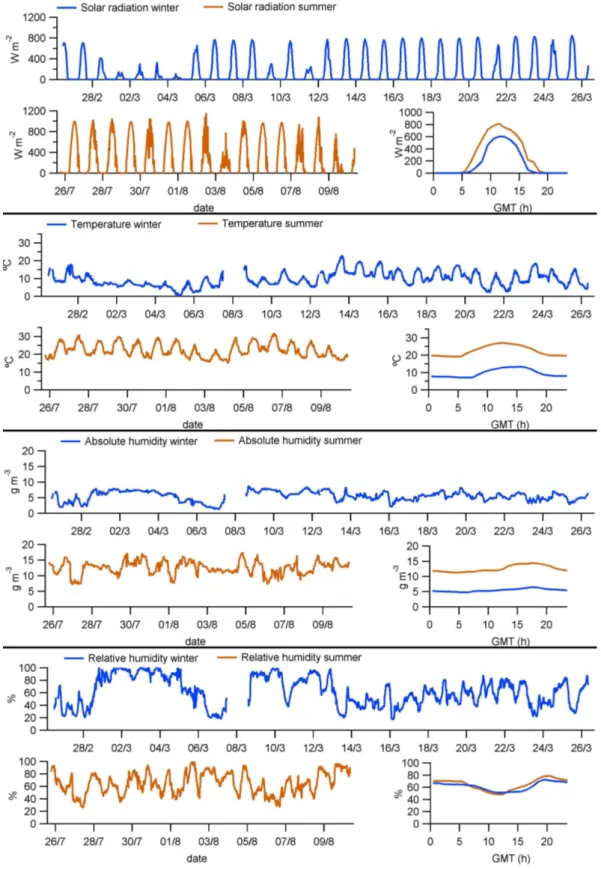
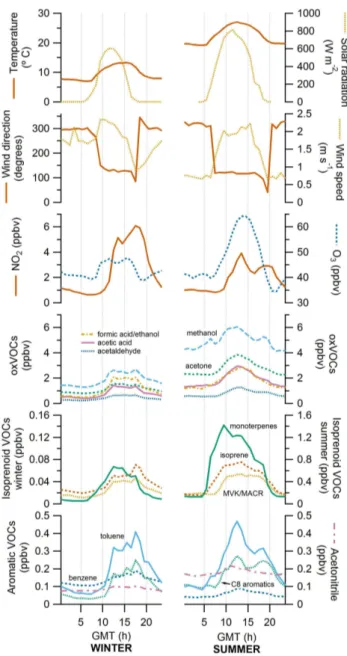
The MSY site presents a typical Mediterranean climate with warm summers, temperate winters and irregular precipita-tion rates (P´erez et al., 2008). In fact, precipitaprecipita-tion was practically nonexistent during the periods reported in this paper. Average maximum solar radiation reached around 600 W m−2in winter and 800 W m−2in summer (Fig. 2), and consequently the average temperatures differed 11–15◦C
be-tween the two periods (7–13◦
C and 19–27◦
C daily averages in winter and summer, respectively), while relative humidity showed almost identical daily profiles (Fig. 2).
Air circulation in the MSY site is strongly determined by the topography of the valley, and two main wind direc-tions are usually recorded (Fig. 3). The southerly direction is present when the mountain and sea breezes develop during daytime, entering the valley from the south. This is when the highest wind speeds are usually recorded. The westerly di-rection corresponds to intense advections from the north and north-west, channeled into the valley with a western direc-tion (as was the case during the period 5–7 March), and to drainage flows during the night (P´erez et al., 2008).
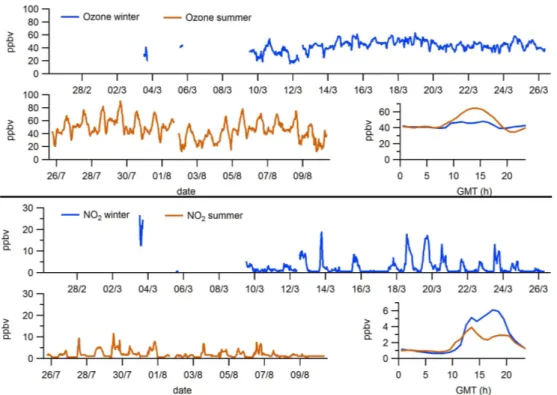
The highest wind speeds for winter were measured during the Atlantic advection scenario (days 5–7 March), with val-ues of up to 10 m s−1. This scenario is a typical atmospheric phenomenon of this region, characterized by Atlantic advec-tion condiadvec-tions with strong northwestern winds that promote a cleaning of the atmosphere by renewing the polluted atmo-sphere with fresh air masses in the entire region. More infor-mation regarding the meteorological scenarios and synoptic conditions of the MSY area during this study can be found in the articles by Jorba et al. (2011) and Pandolfi et al. (2011). 3.2 O3, NO and NO2concentrations
Fig. 3. Wind direction and speed during the winter period (upper graph of each panel), during the summer period (lower left graph) and their mean daily cycles (hourly averages) for both periods (lower right graph). Note the different scaling for graphs on wind speed seasonal trend graphs. Date labels indicate 00:00 GMT.
in winter were recorded, resulting in maximum winter aver-ages of 1.6 µg m−3(1.3 ppbv), which took place when NO
2 concentrations also peaked (data not shown).
3.3 VOC mixing ratios 3.3.1 Seasonal differences
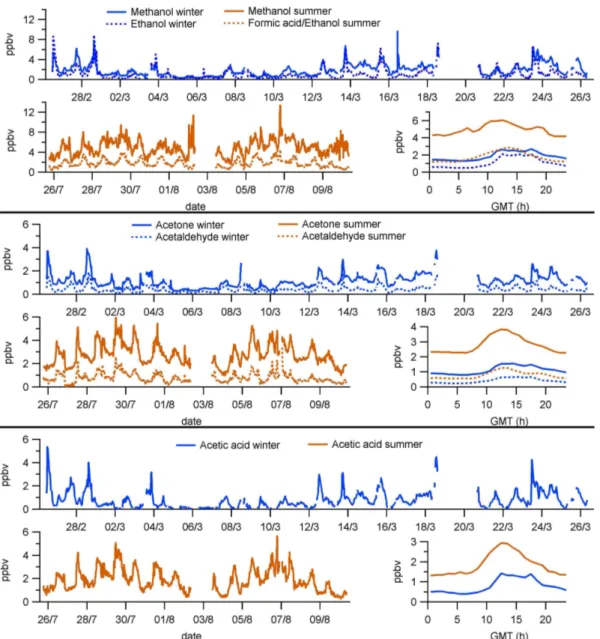
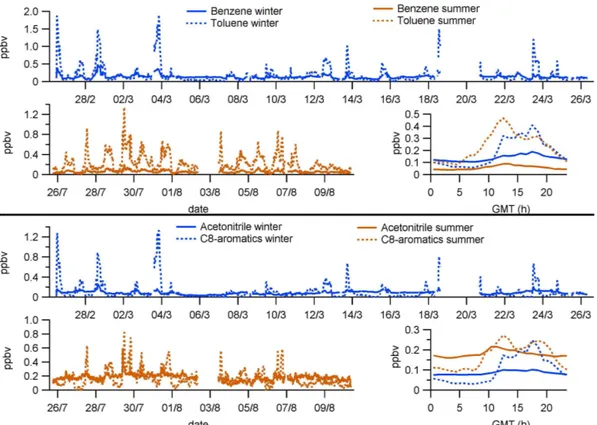
All the VOC mixing ratios measured during the winter and summer campaigns as well as their mean daily cycles are dis-played in Figs. 5, 6, and 7, while Table 2 lists maximum and minimum values of the same data. Almost all the VOCs an-alyzed showed higher average mixing ratios during the sum-mer period than in winter. Only some aromatic VOCs, nor-mally linked to anthropogenic sources, had lower (benzene) or similar (toluene and C8-aromatics) mixing ratios in sum-mer compared to winter (Fig. 7). The greatest difference in mixing ratios between seasons corresponded to the iso-prenoids (Fig. 6), as seen by the 10-fold (isoprene and also its degradation products MVK/MACR) and 21-fold (monoter-penes) increases in their hourly average maxima (Table 2). In the case of monoterpenes, GC-MS analysis showed that the most abundant species were the same in winter and sum-mer, α-pinene being the most abundant one among them (51.4/31.9 % in winter/summer), followed by sabinene +β -pinene (27.1/28.8 %) and limonene (9.5 % in both seasons).
The VOC species with the highest mixing ratios in both winter and summer was methanol (showing peaks of up to 9.7/13.4 ppbv and maximum hourly averages of 2.7/6 ppbv in winter/summer), followed in winter by ethanol (with peaks of 8.9 ppbv and maximum averages of 2 ppbv) and in summer by acetone (reaching up to 5.9 ppbv and max-imum averages of 3.8 ppbv, Fig. 5, Table 2). Regard-ing isoprenoids, monoterpenes were more abundant ing maximum averages of 1.4 ppbv) than isoprene (reach-ing maximum averages of 0.75 ppbv) in summer, whereas in winter both VOCs showed similar mixing ratios (around 0.07 ppbv maximum averages). Among the aromatic VOCs, toluene presented the highest mixing ratios (with peaks be-low 2 ppbv and maximum averages around 0.4 ppbv) in both seasons (Fig. 7).
3.3.2 Average daily cycles
Looking at the daily average mixing ratios and in general terms, all VOCs presented very similar diel cycles with max-imum values during the daytime (Fig. 8). Linear correlations between all of them showed variable Pearson’s correlation coefficients (r), but they were always significant (p <0.01) above 0.31 and with an average of 0.73 in winter and 0.68 in summer (see Table S1 in Supplement).
Fig. 4.Ozone and nitrogen dioxide mixing ratios during the winter period (upper graph of each panel), during the summer period (lower left graph) and their mean daily cycles (hourly averages) for both periods (lower right graph). Date labels indicate 00:00 GMT.
exactly the same in summer as in winter all short-chain oxygenated VOCs (oxVOCs) and aromatics have almost the same daily pattern. Relationships between isoprenoid VOCs (isoprene and monoterpenes) showed a mixed behaviour, depending on the season. In winter isoprene showed a diel cycle resembling that of aromatic or oxVOCs (Fig. 8), while in summer its mean daily cycle was not exactly like the any other cycle, neither that of oxVOCs, aromatics nor monoterpenes (Fig. 8).
4 Discussion
Our results show almost no seasonal variability for aro-matic VOCs, whereas short-chain oxygenated VOCs and iso-prenoids in particular presented much higher mixing ratios (one order of magnitude greater) in summer when the veg-etation emission rates increased considerably (also by one order of magnitude, Llusi`a et al., in preparation). The high-est diurnal concentrations of ozone increased in summer too, probably due to more intense photochemical activity and the higher VOC mixing ratios.
The daily variations in the mixing ratios of most VOCs measured in this study show a very similar pattern. This fact, along with its correspondence in time with the wind direc-tion and speed (Fig. 8), suggests that the changes in VOC mixing ratios are driven by the wind regime of the MSY site, which advects air masses from the surrounding semi-urban
and urban areas including the metropolitan area of Barcelona during the daytime, and from the north-western pastures and forests during the night.
4.1 Seasonal VOC mixing ratios 4.1.1 OxVOCs
Fig. 5.Short-chain oxygenated VOCs measured at MSY, showing their mixing ratios during the winter period (upper graph of each panel), their mixing ratios during the summer period (lower left graph) and their mean daily cycles (hourly averages) for both periods (lower right graph). Date labels indicate 00:00 GMT.
reactivity as a result of the higher temperatures and insola-tion. These compounds are characterized by a variety of at-mospheric lifetimes, which span from over 10 days for ace-tone and methanol (Jacob et al., 2005; Singh et al., 2004) to a few hours for acetaldehyde (Possanzini et al., 2002). This may be the reason why acetone and methanol had the highest mixing ratios in this group, even at night, and also why acetaldehyde showed the lowest mixing ratios of all the oxVOCs measured (Fig. 8).
4.1.2 Isoprenoids
Fig. 6. Isoprenoid VOCs and MVK/MACR measured at MSY, showing their mixing ratios during the winter period (upper graph of each panel), their mixing ratios during the summer period (lower left graph) and their mean daily cycles (hourly averages) for both periods (lower right graph). Note the different scaling for the seasonal trend graphs. Date labels indicate 00:00 GMT.
and transport and changes in boundary layer play a role too in determining the isoprenoid mixing ratios measured at MSY. 4.1.3 Aromatic VOCs
Aromatic VOCs did not change substantially in mixing ratios between winter and summer at MSY (Figs. 7 and 8; Table 2), suggesting their emission sources are of similar strength all year round. Also, there are few sources of these compounds – mainly tailpipe exhaust – in the local environment of the MSY site, probably restricted to a little road in the valley and some small villages. Therefore their mixing ratios in MSY are assumed to come from relatively distant sources outside the valley. The aromatic VOC with the largest sea-sonal variation was benzene (winter levels doubled those of summer, see Table 2) but at the same time it was the aromatic VOC with lowest daily fluctuation (Fig. 7). The latter may be related to the fact that benzene has the longest atmospheric lifetime (in the order of days) among the aromatics measured (Atkinson, 2000) and for this reason it may be better mixed within the atmosphere.
4.1.4 Acetonitrile
Acetonitrile is considered a biomass burning marker (Holzinger et al., 1999), given that its main global source
(94 %) is biomass burning, with only a minor part (less than 6 %) arising from fossil fuel combustion (Holzinger et al., 2001a). In contrast with benzene, at MSY acetonitrile mix-ing ratio was double in summer compared to winter (Table 2). This was unexpected because in winter biomass burning used for domestic heating is more common than in summer in the area around MSY, and furthermore in summer the controlled burning of agricultural waste is limited by law. On the other hand, during summer, forest fires in the Mediterranean area are common and long range transport of acetonitrile could occur due to its relatively long atmospheric lifetime (San-hueza et al., 2004), so the higher mixing ratios in summer suggest more extensive burning events in the Mediterranean area. Similarly to benzene, this relatively long atmospheric lifetime may yield good acetonitrile mixing in the atmo-sphere, and as a consequence the small daily variations of the mixing ratios (Fig. 8).
4.2 Daily cycles and wind regime
Fig. 7.Aromatic VOCs and acetonitrile measured at MSY, showing their mixing ratios during the winter period (upper graph of each panel), their mixing ratios during the summer period (lower left graph) and their mean daily cycles (hourly averages) for both periods (lower right graph). Note the different scaling for the seasonal trend graphs. Date labels indicate 00:00 GMT.
– rose at the same time in morning, had almost simultane-ous peaks and decayed at the same moment in the evening (Fig. 8). Even the aromatic compounds followed this be-haviour, despite having few local sources in the MSY valley. This common pattern indicates that the VOC mixing ratios measured at the site are mainly governed by the wind regime of the mountain. In winter, after sunrise the sea breeze starts to blow mountain upwards and VOC mixing ratios slightly increase, and about 2 h after that, they undergo a sharp in-crease. VOC levels are then maintained more or less constant until the wind changes direction and reduces speed, when at around 17:00 h GMT the sea breeze stops and the mountain drainage flow towards the valley starts instead. This general daily cycle of VOC mixing ratios driven by the wind is also observed in summertime. Such behaviour of atmospheric pollutants at MSY has been described by P´erez et al. (2008) and also for the same period of our study when comparing PM levels in the city of Barcelona and MSY (Minguill´on et al., 2011; Pandolfi et al., 2011) . In this case, the levels of fine particulate matter (PM1)increased in MSY when cor-responding levels in Barcelona decreased. This was partly attributed to the mountain and sea breeze transport toward the MSY site.
Both biogenic and anthropogenic emissions of gaseous and particulate matter accumulate in the valleys and
depressions (including the Barcelona metropolitan area) dur-ing the night and early morndur-ing. Later in the morndur-ing the air masses from the Barcelona metropolitan area are advected to MSY by the sea and mountain breezes, passing over further heavily industrialized areas, with some cities in the range of 50 000–100 000 inhabitants and a number of highways, and hence taking up more pollutants. Assuming a 2 m s−1 aver-age daytime wind speed for both seasons, these air masses can travel around 7 km per hour. At the same time, photo-chemical reactions take place within the air mass (e.g. ozone production, VOC degradation, etc.), so the pollution plume is aged when it reaches MSY.
Fig. 8. Mean daily cycles of the majority of the variables stud-ied, comparing winter (left) with summer (right). VOC mixing ra-tios are split into three separate panels, corresponding to Figs. 5, 6, and 7: (i) one for short-chain oxVOCs: methanol, acetone, formic acid/ethanol, acetic acid and acetaldehyde; (ii) the second one for isoprenoid VOCs: monoterpenes, and isoprene and its degradation products MVK/MACR; (iii) the last panel for acetonitrile and aro-matic VOCs: benzene, toluene, and C8-aroaro-matics. Note the differ-ent scaling for the isoprenoid VOCs between winter and summer (one order of magnitude higher in summer).
of NOx, that may change to more favorable conditions for ozone production when the breeze advects NOx from the metropolitan area (see Supplement). This could partially ex-plain the higher ozone concentration found in MSY (means of 75 µg m−3at night and 90–125 µg m−3by day) compared to Barcelona city in both seasons (means of 40–50 µg m−3at
night and 60–70 µg m−3at day; Pandolfi et al., 2011). In ad-dition, another important cause of these higher ozone levels in the mountains is the lack of fresh NO emissions. In ur-ban and semi urur-ban environments the consumption of O3by freshly emitted NO to form NO2represents an important sink for ozone. In the case of MSY, the air mass being advected has low NO mixing ratios because it has been consumed by photochemical reactions before arriving to the mountain. In addition, summer higher solar radiation and temperature pro-mote photochemical reactions, further explaining the higher daytime ozone concentrations registered in summer.
follow so closely the daily cycles of aromatics or oxVOCs as in winter, and instead had an earlier rise in mixing ratios, at the same time as monoterpenes did (Fig. 8). This may clearly indicate isoprene’s summertime local biotic origin, at least in part. In contrast, most other VOCs including isoprene’s oxi-dation products MVK and MACR started to rise collectively with a certain delay, when air masses advected by the sea breeze contributed to the VOC burden at MSY.
The only two other VOCs that also showed a summertime early rise in the morning were methanol and toluene. On the one hand, methanol has been reported to build up in-side the leaves of plants when stomata remain closed during the night, and then burst out when they open in the morn-ing. This phenomenon is under the control of the gas–liquid phase equilibrium of the alcohol within the leaf and of the stomatal conductance (Filella and Pe˜nuelas, 2006; Filella et al., 2009; Niinemets and Reichstein, 2003). Some authors described this morning burst in mixing ratios, and attributed it to this stomata-related response and to the evaporation of dew, supposing that methanol may be dissolved in it (Filella and Pe˜nuelas, 2006; Holzinger et al., 2001b; Sanhueza et al., 2001; Warneke et al., 2002). This morning burst is normally a short term pulse of emission followed by a longer decay. It is likely that the pattern in the mixing ratios showed in Fig. 8 results first from this short term emission pulse, and that later the longer decay gets masked by the arrival of a much higher methanol amount advected by the wind from the plains be-low the MSY station. On the other hand, toluene has been reported to be emitted by plants (Heiden et al., 1999; White et al., 2009) and emissions ofm/z93 have been reported for Q. ilex and attributed to toluene (Holzinger et al., 2000). However, the possibility that certain monoterpene fragments may contribute tom/z93 and thus being mistaken for toluene has been suggested (Kim et al., 2010). Notwithstanding, Ambrose et al. (2010) have recently reported this interference to be practically insignificant, so the early morning toluene increase must be product of either toluene emissions from plants or from a local anthropic source.
The high influence of the wind regime on VOC mixing ra-tios at MSY is illustrated by Fig. 9, which contains the same information as Fig. 8 but corresponds only to the 6 August, as representative for the atmospheric conditions of a number of days. On 6 August all VOCs, including monoterpenes, saw a reduction in mixing ratios when at around 14:00–15:00 h the wind started to change speed and moreover change di-rection, turning from SE (around 120 degrees) to W (260– 270 degrees). Solar radiation did not change (e.g. due to clouds), so it is probable that local biogenic emissions did not decrease. This VOC mixing ratio reduction occurred si-multaneously with a reduction in NO2levels and a small in-crease in O3concentration. At around 17:00 h the wind went back to SE direction briefly and then changed at 18:00 h to N for the whole night. VOC and NO2 concentrations in-creased again when the wind direction returned to the SE di-rection, and sharply decreased when it changed to N. The SE
Table 3.VOC mixing ratios (ppbv) reported in the literature for several natural environments (either Scandinavian ecosystems, other mixed forests and rural sites, or Mediterranean ecosystems). Numbers represent means or medians, while numbers in brackets represent maximum values reported by the authors. The numbers are followed by a letter to indicate the time of year when they were recorded (w for winter, s for summer). The Castelporziano Mediterranean values were obtained in May-June.
Location methanol acetone acetaldehyde isoprene monoterpenes MVK/MACR benzene toluene
C8-aromatics References Hyyti¨al¨a forest (S Finland) <0.7 w 2 s
<0.5 w (4.5 s) 1.5–1.7 s 0.16-0.33 w 0.3s 0.06 w (0.5s) 0.14–0.2 s
<0.1 w 0.25–0.3 s
1Lappalainen et al. (2009)
0.22 w 1.9–3 s 0.33 w 1.35– 2.05 s 0.16 w 0.25– 0.39 s 0.05 w 0.14–0.17 s 0.05–0.09 w 0.29–0.37 s 0.07 w 0.12–0.16 s 0.14 w 0.04– 0.07 s
Ruuskanen et al. (2009)
3.5 s (8.5 s) 1.5 s (3.5 s) 1 s (1.9 s) 0.1 s (0.3 s)
<1 s (2.5 s)
0.1 s (0.2 s)
<0.05 s (0.09 s)
2Rinne et al. (2005)
sub-arctic wetland (N Sweden) 2.8 s (6 s) 1 s (2.1 s) 0.2 s (0.5 s) 0.38 s (1.2 s)
Holst et al. (2010)
rural site with urban influences (New Hampshire, USA) 0.97 w 2.69 s 0.57 w 2.11 s 0.33 w 0.54 s 0.05 w 0.42 s 0.10 w 0.50 s 0.04 w 0.33 s 0.20 w 0.08 s 0.11 w 0.14 s 0.10 w 0.12 s
Jordan et al. (2009)
mixed forest (Michigan, USA)
2 s 0.25 s
(0.97 s)
1Mielke et al. (2010)
mixed deciduous forest (J¨ulich, NW Germany)
13 s (22 s) 2 s
(9 s)
0.5 s (1 s)
0.4 s (1.2 s)
1,2Spirig et al. (2005)
urban-impacted forest (Germany)
(0.2–1.5 s) (0.5–2 s) (0.2–1.5 s) (0.5–1.5 s) 2Steinbrecher et al. (2000)
Castelporziano Mediterranean ecosystem (Italy)
1.74 1.80 0.17–0.376 0.64 0.89 1Kalabokas et al. (1997)
1.6–3.5 0.96–2.1 0.44–1.3 0.1–0.14 0.13–0.30 Davison et al. (2009)
Montseny (NE Spain) 1.84 w (9.76 w) 4.92 s (13.4 s) 1.1 w (3.9 w) 2.76 s (5.95 s) 0.4 w (1.88 w) 0.78 s (3.37 s) 0.04 w (0.18 w) 0.43 s (1.25 s) 0.03 w (0.23 w) 0.64 s (2.56 s) 0.02 w (0.15 w) 0.32 s (1.04 s) 0.13 w (0.47 w) 0.05 s (0.19 s) 0.18 w (1.9 w) 0.23 s (1.34 s) 0.1 w (1.33 w) 0.17 s (0.82 s) This study
1These values correspond only to day-time or midday hours.2Approximate values taken from graphs.
wind direction corresponded to the usual sea breeze that oc-curs at MSY, with the wind coming valley upwards from the Barcelona metropolitan region. When the wind was blow-ing from the W, the air was comblow-ing from another valley, and althoughQ. ilexis the dominant plant species there too, before arriving at the MSY site the air passed over Pla de la Calma (1100–1300 m a.s.l.), a plateau covered by heath communities ofCalluna vulgaris,Pteridium aquilinum, Fes-tuca ovina, andScleranthus annuus(Bol`os, 1983). This dif-ferent vegetation, much less dense, with less biomass, and with isoprenoid emission factors reported to be lower (He-witt and Street, 1992), emits much less VOCs than the holm oak forests of the SE valley.
4.3 Comparison with VOC mixing ratios reported in the literature
Data on VOC mixing ratios from several other natural envi-ronments have also been reported (see Table 3 and the Sup-plement). In general, in Nordic environments oxVOC and
isoprenoid mixing ratios were lower than those measured at MSY, with only some occasional peaks higher than at MSY (Holst et al., 2010; Lappalainen et al., 2009; Rinne et al., 2005; Ruuskanen et al., 2009). These results are in accor-dance with the lower physiological activity of the vegetation in Nordic regions linked to lower temperatures, thus resulting in lower emissions compared to the Mediterranean MSY. In a rural area near the coast in New Hampshire (East USA), the oxVOC mixing ratios were also generally lower than at MSY in both seasons, while isoprenoids were in the same range or slightly higher than at MSY (Jordan et al., 2009). A mixed forest in the northern USA presented lower monoterpene mixing ratios than at MSY in summer, but higher isoprene mixing ratios (Mielke et al., 2010). The same situation for monoterpenes and isoprene compared to MSY was found in a mixed forest in NW Germany in summer, where methanol presented higher mixing ratios too (Spirig et al., 2005).
influenced by the urban environment of Rome. For the year 1994 and within the BEMA campaign, Kalabokas et al. (1997) described a lower daily mean acetone mixing ra-tio (1.74 ppbv) than in MSY summer. However, that cam-paign was held in May and this mixing ratio is, accordingly, between our MSY winter and summer values. In contrast, the daily average mixing ratios of acetaldehyde (1.8 ppbv) were above those registered at MSY. More recently in 2007, Davison et al. (2009) took measurements again at the same site and period (May–June). The reported mixing ratios of methanol (medians of 1.6 to 3.5 ppbv) and again acetone (0.96–2.1 ppbv) were in this case slightly lower than those at MSY, while acetaldehyde showed similar values (medians of 0.44–1.3 ppbv). Regarding isoprenoids, the Mediterranean site of Castelporziano showed slightly lower mixing ratios of isoprene (medians of 0.1–0.37 ppbv) and MVK/MACR (medians of 0.13–0.30 ppbv) and clearly lower monoterpene mixing ratios (medians of 0.13–0.3) in May than at MSY in summer (Davison et al., 2009; Kalabokas et al., 1997). As with oxVOCs, the results for isoprenoids in summer in Castelporziano may have been hypothetically closer to those from MSY, as these mixing ratios are somewhat in between the MSY winter and summer readings. Nevertheless sum-mer drought may exert a big influence in VOC emissions in Castelporziano and have the contrary effect, as the au-thors pointed out when choosing the period for measure-ments (they considered that plants would have good temper-ature and water conditions for VOC emission in May–June). An interesting detail is that the maximum monoterpene mixing ratios in the 2007 Castelporziano campaign were de-tected at night, when the land breeze originated and air was coming from oak and pine forests.These mixing ratios were higher (medians of 0.26 to 0.57 ppbv) than the night ones at MSY. The authors attributed this behaviour to the nighttime temperature-dependent emissions of stored monoterpenes by the pines together with the cessation of photochemical de-struction of VOCs and the suppression of vertical mixing at night (Davison et al., 2009). In MSY, vertical mixing and photochemistry were also suppressed at night, but the land breeze acted in the contrary sense, cleaning the air from VOCs. This may be in part due to the fact that there are no significant tree populations in the surroundings that could emit monoterpenes from storage pools at night, as holm oaks do not store monoterpenes. Rather they emit them from de novo synthesis, influenced by temperature, irradiance and water availability (Llusi`a and Pe˜nuelas, 1999; Loreto et al., 1998; Pe˜nuelas and Llusi`a, 1999b; Staudt et al., 2002). It should be noted that some forest measurements at Hyyti¨al¨a, Finland (Rinne et al., 2005; Ruuskanen et al., 2009), at a rural location in New Hampshire, USA (Jordan et al., 2009) and at a mixed forest in Germany (Mielke et al., 2010) also reported higher monoterpene mixing ratios in summer at night.
5 Summary and conclusions
VOC mixing ratio measurements in an elevated Mediter-ranean forested site (MSY) with a dense vegetation domi-nated byQuercus ilexwere performed. There were two sets of measures, one in winter (February–March) and another in summer (July–August). While aromatic VOCs showed al-most no seasonal variability (only benzene had lower sum-mer mixing ratios), short-chain oxygenated VOCs presented higher mixing ratios in summer, presumably due to the in-creased emission by vegetation and inin-creased photochem-istry, both enhanced by the high temperatures and solar radia-tion in summer. Methanol was the most abundant compound among all the VOCs measured in both seasons.
Isoprenoid VOCs (monoterpenes and isoprene, and its ox-idation products MVK/MACR) were involved in the biggest change in mixing ratios between winter and summer. That is, their mixing ratios increased by one order of magnitude, as a result of the increased physiological activity and emission rates of the vegetation. The highest diurnal concentrations of ozone increased in summer too, most likely due to more intense photochemical activity and the presence of more re-active VOCs in the air.
VOC mixing ratios analysis at the MSY forest site in the Western Mediterranean Basin showed that their diel varia-tion is mainly governed by the wind regime of the mountain, since the majority of the VOC species analyzed followed a very similar daily cycle. Sea and mountain breezes that de-velop after sunrise advect polluted air masses to the mountain that previously had passed over the Barcelona metropolitan region, where they were enriched in NOxand in VOCs of anthropic and biotic origin. Furthermore, these polluted air masses can react with biogenic VOCs emitted at the MSY valley by the vegetation, thus enhancing O3 formation in this mountain site. The only VOC species that showed a distinct different daily pattern – though still affected by the wind regime – were monoterpenes, because they were emit-ted by the local vegetation of the valley. Isoprene also shared partially the diel pattern of the monoterpenes, but only in summer when its biotic sources were stronger. These high concentrations of biogenic volatile isoprenoids indicate the significant impact of local forested vegetation on air quality in these Mediterranean areas which also receive polluted air masses from anthropic sources.
Supplementary material related to this article is available online at:
http://www.atmos-chem-phys.net/11/13161/2011/ acp-11-13161-2011-supplement.pdf.
by an FPI fellowship (BES-2005-6989) from the Spanish Govern-ment and by a postdoctoral grant from Fundaci´on Ram´on Areces.
This research has received funding from the EC Seventh Framework Programme under grant agreement no. 215072 (Marie Curie Initial Training Network, “CLOUD-ITN”). Helpful discussion concerning the PTR-TOF evaluation with Martin Graus and Ralf Schnitzhofer from the University of Innsbruck was much appreciated. The au-thors are also grateful to Xavier Querol and Andr´es Alastuey for fruitful comments on earlier versions of this manuscript and for or-ganizing the DAURE campaign.
The National Center for Atmospheric Research is sponsored by the National Science Foundation.
Edited by: A. Hofzumahaus
References
Ambrose, J. L., Haase, K., Russo, R. S., Zhou, Y., White, M. L., Frinak, E. K., Jordan, C., Mayne, H. R., Talbot, R., and Sive, B. C.: A comparison of GC-FID and PTR-MS toluene measure-ments in ambient air under conditions of enhanced monoterpene loading, Atmos. Meas. Tech., 3, 959–980, doi:10.5194/amt-3-959-2010, 2010.
Arneth, A., Harrison, S. P., Zaehle, S., Tsigaridis, K., Menon, S., Bartlein, P. J., Feichter, J., Korhola, A., Kulmala, M., O’Donnell, D., Schurgers, G., Sorvari, S., and Vesala, T.: Terrestrial biogeo-chemical feedbacks in the climate system, Nat. Geosci., 3, 525– 532, 2010.
Atkinson, R.: Atmospheric chemistry of VOCs and NOx, Atmos.
Environ., 34, 2063–2101, 2000.
Avila, A. and Alarcon, M.: Precipitation chemistry at a
ru-ral Mediterranean site: Between anthropogenic pollution
and natural emissions, J. Geophys. Res.-Atmos., 108, 4278, doi:10.1029/2002JD002565, 2003.
Avila, A. and Rod`a, F.: Assessing decadal changes in rainwater al-kalinity at a rural Mediterranean site in the Montseny Mountains (NE Spain), Atmos. Environ., 36, 2881–2890, 2002.
Avila, A. and Rodrigo, A.: Trace metal fluxes in bulk deposition, throughfall and stemflow at two evergreen oak stands in NE Spain subject to different exposure to the industrial environment, Atmos. Environ., 38, 171–180, 2004.
Avila, A., Alarcon, M., and Queralt, I.: The chemical composition of dust transported in red rains – Its contribution to the biogeo-chemical cycle of a Holm oak forest in Catalonia (Spain), Atmos. Environ., 32, 179–191, 1998.
Avila, A., Rodrigo, A., and Rod`a, F.: Nitrogen circulation in a Mediterranean holm oak forest, La Castanya, Montseny, northeastern Spain, Hydrol. Earth Syst. Sci., 6, 551–558, doi:10.5194/hess-6-551-2002, 2002.
Avila, A., Alarcon, M., Castillo, S., Escudero, M., Garcia-Orellana, J., Masque, P., and Querol, X.: Variation of soluble and insol-uble calcium in red rains related to dust sources and transport patterns from North Africa to northeastern Spain, J. Geophys. Res.-Atmos., 112, D05210, doi:10.1029/2006JD007153, 2007. Avila, A., Molowny-Horas, R., Gimeno, B. S., and Pe˜nuelas, J.:
Analysis of Decadal Time Series in Wet N Concentrations at Five Rural Sites in NE Spain, Water Air Soil Pollut., 207, 123–138, 2010.
Baldwin, I. T., Halitschke, R., Paschold, A., von Dahl, C. C., and Preston, C. A.: Volatile signaling in plant-plant interactions: “Talking trees” in the genomics era, Science, 311, 812–815, 2006.
Bol`os, O.: La vegetaci´o del Montseny, Diputaci´o de Barcelona, Barcelona, 1983.
Borbon, A., Fontaine, H., Veillerot, M., Locoge, N., Galloo, J. C., and Guillermo, R.: An investigation into the traffic-related frac-tion of isoprene at an urban locafrac-tion, Atmos. Environ., 35, 3749– 3760, 2001.
Calfapietra, C., Fares, S., and Loreto, F.: Volatile organic com-pounds from Italian vegetation and their interaction with ozone, Environ. Pollut., 157, 1478–1486, 2009.
Davison, B., Taipale, R., Langford, B., Misztal, P., Fares, S., Mat-teucci, G., Loreto, F., Cape, J. N., Rinne, J., and Hewitt, C. N.: Concentrations and fluxes of biogenic volatile organic com-pounds above a Mediterranean macchia ecosystem in western Italy, Biogeosciences, 6, 1655–1670, doi:10.5194/bg-6-1655-2009, 2009.
de Gouw, J. and Warneke, C.: Measurements of volatile organic compounds in the Earth’s atmosphere using proton-transfer-reaction mass spectrometry, Mass Spectrom. Rev., 26, 223–257, 2007.
Diaz-de-Quijano, M., Pe˜nuelas, J., and Ribas, A.: Increasing inter-annual and altitudinal ozone mixing ratios in the Catalan Pyre-nees, Atmos. Environ., 43, 6049–6057, 2009.
Evtyugina, M. G., Nunes, T., Alves, C., and Marques, M. C.: Pho-tochemical pollution in a rural mountainous area in the northeast of Portugal, Atmos. Res., 92, 151–158, 2009.
Filella, I. and Pe˜nuelas, J.: Daily, weekly, and seasonal time courses of VOC concentrations in a semi-urban area near Barcelona, At-mos. Environ., 40, 7752–7769, 2006.
Filella, I., Pe˜nuelas, J., and Seco, R.: Short-chained
oxy-genated VOC emissions in Pinus halepensis in response to
changes in water availability, Acta Physiol. Plant., 31, 311–318, doi:10.1007/s11738-008-0235-6, 2009.
Fowler, D., Pilegaard, K., Sutton, M. A., Ambus, P., Raivonen, M., Duyzer, J., Simpson, D., Fagerli, H., Fuzzi, S., Schjoerring, J. K., Granier, C., Neftel, A., Isaksen, I. S. A., Laj, P., Maione, M., Monks, P. S., Burkhardt, J., Daemmgen, U., Neirynck, J., Per-sonne, E., Wichink-Kruit, R., Butterbach-Bahl, K., Flechard, C., Tuovinen, J. P., Coyle, M., Gerosa, G., Loubet, B., Altimir, N., Gruenhage, L., Ammann, C., Cieslik, S., Paoletti, E., Mikkelsen, T. N., Ro-Poulsen, H., Cellier, P., Cape, J. N., Horvath, L.,
Loreto, F., Niinemets, ¨U., Palmer, P. I., Rinne, J., Misztal, P.,
Nemitz, E., Nilsson, D., Pryor, S., Gallagher, M. W., Vesala, T., Skiba, U., Brueggemann, N., Zechmeister-Boltenstern, S., Williams, J., O’Dowd, C., Facchini, M. C., de Leeuw, G., Floss-man, A., Chaumerliac, N., and ErisFloss-man, J. W.: Atmospheric composition change: Ecosystems-Atmosphere interactions, At-mos. Environ., 43, 5193–5267, 2009.
Gimeno, B. S., Pe˜nuelas, J., Porcuna, J. L., and Reinert, R. A.: Biomonitoring ozone phytotoxicity in eastern Spain, Water Air Soil Pollut., 85, 1521–1526, 1995.
Graus, M., M¨uller, M., and Hansel, A.: High Resolution PTR-TOF: Quantification and Formula Confirmation of VOC in Real Time, J. Am. Soc. Mass Spectrom., 21, 1037–1044, 2010.
Pierce, T., Scholes, B., Steinbrecher, R., Tallamraju, R., Tay-lor, J., and Zimmerman, P.: A Global-Model of Natural Volatile Organic-Compound Emissions, J. Geophys. Res., 100, 8873– 8892, 1995.
Guenther, A., Karl, T., Harley, P., Wiedinmyer, C., Palmer, P. I., and Geron, C.: Estimates of global terrestrial isoprene emissions using MEGAN (Model of Emissions of Gases and Aerosols from Nature), Atmos. Chem. Phys., 6, 3181–3210, doi:10.5194/acp-6-3181-2006, 2006.
Heiden, A. C., Kobel, K., Komenda, M., Koppmann, R., Shao, M., and Wildt, J.: Toluene emissions from plants, Geophys. Res. Lett., 26, 1283–1286, 1999.
Hewitt, C. N. and Street, R. A.: A qualitative assessment of the emission of non-methane hydrocarbon compounds from the bio-sphere to the atmobio-sphere in the UK: present knowledge and un-certainties, Atmos. Environ. A-Gen., 26, 3069–3077, 1992. Hewitt, C. N., Ashworth, K., Boynard, A., Guenther, A.,
Lang-ford, B., MacKenzie, A. R., Misztal, P. K., Nemitz, E., Owen, S. M., Possell, M., Pugh, T. A. M., Ryan, A. C., and Wild, O.: Ground-level ozone influenced by circadian control of isoprene emissions, Nat. Geosci., 4, 671–674, 2011.
Holst, T., Arneth, A., Hayward, S., Ekberg, A., Mastepanov, M., Jackowicz-Korczynski, M., Friborg, T., Crill, P. M., and B¨ackstrand, K.: BVOC ecosystem flux measurements at a high latitude wetland site, Atmos. Chem. Phys., 10, 1617–1634, doi:10.5194/acp-10-1617-2010, 2010.
Holzinger, R., Warneke, C., Hansel, A., Jordan, A., Lindinger, W., Scharffe, D. H., Schade, G., and Crutzen, P. J.: Biomass burn-ing as a source of formaldehyde, acetaldehyde, methanol, ace-tone, acetonitrile, and hydrogen cyanide, Geophys. Res. Lett., 26, 1161–1164, 1999.
Holzinger, R., Sandoval-Soto, L., Rottenberger, S., Crutzen, P. J., and Kesselmeier, J.: Emissions of volatile organic compounds from Quercus ilex L. measured by Proton Transfer Reaction Mass Spectrometry under different environmental conditions, J. Geophys. Res., 105, 20573–20579, 2000.
Holzinger, R., Jordan, A., Hansel, A., and Lindinger, W.: Automo-bile emissions of acetonitrile: Assessment of its contribution to the global source, J. Atmos. Chem., 38, 187–193, 2001a. Holzinger, R., Jordan, A., Hansel, A., and Lindinger, W.: Methanol
measurements in the lower troposphere near Innsbruck (047 de-grees 16’N; 011 dede-grees 24’E), Austria, Atmos. Environ., 35, 2525–2532, 2001b.
Jacob, D. J., Field, B. D., Li, Q. B., Blake, D. R., de Gouw, J., Warneke, C., Hansel, A., Wisthaler, A., Singh, H. B., and Guenther, A.: Global budget of methanol: Constraints from atmospheric observations, J. Geophys. Res., 110, D08303, doi:10.1029/2004JD005172, 2005.
Jorba, O., Pandolfi, M., Spada, M., Baldasano, J. M., Pey, J., Alastuey, A., Arnold, D., Sicard, M., Arti˜nano, B., Revuelta, M. A., and Querol, X.: The DAURE field campaign: meteoro-logical overview, Atmos. Chem. Phys. Discuss., 11, 4953–5001, doi:10.5194/acpd-11-4953-2011, 2011.
Jordan, C., Fitz, E., Hagan, T., Sive, B., Frinak, E., Haase, K., Cottrell, L., Buckley, S., and Talbot, R.: Long-term study of VOCs measured with PTR-MS at a rural site in New Hamp-shire with urban influences, Atmos. Chem. Phys., 9, 4677–4697, doi:10.5194/acp-9-4677-2009, 2009.
Kalabokas, P., Bartzis, J. G., Bomboi, T., Ciccioli, P., Cieslik, S.,
Dlugi, R., Foster, P., Kotzias, D., and Steinbrecher, R.: Ambient atmospheric trace gas concentrations and meteorological param-eters during the first BEMA measuring campaign on May 1994 at Castelporziano, Italy, Atmos. Environ., 31, 67–77, 1997. Karl, T., Guenther, A., Jordan, A., Fall, R., and Lindinger, W.: Eddy
covariance measurement of biogenic oxygenated VOC emissions from hay harvesting, Atmos. Environ., 35, 491–495, 2001. Karl, T., Hansel, A., Mark, T., Lindinger, W., and Hoffmann, D.:
Trace gas monitoring at the Mauna Loa Baseline observatory using proton-transfer reaction mass spectrometry, Int. J. Mass Spectrom., 223, 527–538, 2003.
Kavouras, I. G., Mihalopoulos, N., and Stephanou, E. G.: Forma-tion of atmospheric particles from organic acids produced by forests, Nature, 395, 683–686, 1998.
Kegge, W. and Pierik, R.: Biogenic volatile organic compounds and plant competition, Trends Plant Sci., 15, 126–132, 2010. Kessler, A. and Baldwin, I. T.: Defensive function of
herbivore-induced plant volatile emissions in nature, Science, 291, 2141– 2144, 2001.
Kim, S., Karl, T., Guenther, A., Tyndall, G., Orlando, J., Harley, P., Rasmussen, R., and Apel, E.: Emissions and ambient distribu-tions of Biogenic Volatile Organic Compounds (BVOC) in a pon-derosa pine ecosystem: interpretation of PTR-MS mass spectra, Atmos. Chem. Phys., 10, 1759–1771, doi:10.5194/acp-10-1759-2010, 2010.
Kulmala, M., Suni, T., Lehtinen, K. E. J., Dal Maso, M., Boy,
M., Reissell, A., Rannik, ¨U., Aalto, P., Keronen, P., Hakola, H.,
B¨ack, J., Hoffmann, T., Vesala, T., and Hari, P.: A new feedback mechanism linking forests, aerosols, and climate, Atmos. Chem. Phys., 4, 557–562, doi:10.5194/acp-4-557-2004, 2004.
Lappalainen, H. K., Sevanto, S., B¨ack, J., Ruuskanen, T. M., Kolari, P., Taipale, R., Rinne, J., Kulmala, M., and Hari, P.: Day-time concentrations of biogenic volatile organic compounds in a boreal forest canopy and their relation to environmen-tal and biological factors, Atmos. Chem. Phys., 9, 5447–5459, doi:10.5194/acp-9-5447-2009, 2009.
Lindinger, W., Hansel, A., and Jordan, A.: On-line monitoring of volatile organic compounds at pptv levels by means of proton-transfer-reaction mass spectrometry (PTR-MS) – Medical appli-cations, food control and environmental research, Int. J. Mass Spectrom., 173, 191–241, 1998.
Lippmann, M.: Health-Effects of Tropospheric Ozone – Review of Recent Research Findings and their Implications to Ambient Air-Quality Standards, J. Expo. Anal. Environ. Epidemiol., 3, 103– 129, 1993.
Llusi`a, J. and Pe˜nuelas, J.: Pinus halepensisandQuercus ilex
ter-pene emission as affected by temperature and humidity, Biol. Plantarum, 42, 317–320, 1999.
Llusi`a, J. and Pe˜nuelas, J.: Seasonal patterns of terpene content and emission from seven Mediterranean woody species in field conditions, Am. J. Bot., 87, 133–140, 2000.
Llusi`a, J. and Pe˜nuelas, J.: Emission of volatile organic compounds by apple trees under spider mite attack and attraction of predatory mites, Exp. Appl. Acarol., 25, 65–77, 2001.
Llusi`a, J., Pe˜nuelas, J., Sardans, J., Owen, S. M., and Niinemets, ¨
U.: Measurement of volatile terpene emissions in 70 dominant vascular plant species in Hawaii: aliens emit more than natives, Global Ecol. Biogeogr., 19, 863–874, 2010.
the daily emission rates of terpenes by Quercus ilex and the atmospheric concentrations of terpenes in the natural park of Montseny, NE Spain, in preparation, 2011.
Loreto, F., Ciccioli, P., Brancaleoni, E., Valentini, R., De Lillis, M., Csiky, O., and Seufert, G.: A hypothesis on the evolution of isoprenoid emission by oaks based on the correlation between emission type and Quercus taxonomy, Oecologia, 115, 302–305, 1998.
Mielke, L. H., Pratt, K. A., Shepson, P. B., McLuckey, S. A., Wisthaler, A., and Hansel, A.: Quantitative Determination of Biogenic Volatile Organic Compounds in the Atmosphere Using Proton-Transfer Reaction Linear Ion Trap Mass Spectrometry, Anal. Chem., 82, 7952–7957, 2010.
Minguill´on, M. C., Perron, N., Querol, X., Szidat, S., Fahrni, S. M., Alastuey, A., Jimenez, J. L., Mohr, C., Ortega, A. M., Day, D. A., Lanz, V. A., Wacker, L., Reche, C., Cusack, M., Amato, F., Kiss, G., Hoffer, A., Decesari, S., Moretti, F., Hillamo, R., Teinil¨a, K., Seco, R., Pe˜nuelas, J., Metzger, A., Schallhart, S., M¨uller, M., Hansel, A., Burkhart, J. F., Baltensperger, U., and Pr´evˆot, A. S. H.: Fossil versus contemporary sources of fine elemental and organic carbonaceous particulate matter during the DAURE campaign in Northeast Spain, Atmos. Chem. Phys., 11, 12067– 12084, doi:10.5194/acp-11-12067-2011, 2011.
M¨uller, M., Graus, M., Ruuskanen, T. M., Schnitzhofer, R., Bam-berger, I., Kaser, L., Titzmann, T., H¨ortnagl, L., Wohlfahrt, G., Karl, T., and Hansel, A.: First eddy covariance flux mea-surements by PTR-TOF, Atmos. Meas. Tech., 3, 387–395, doi:10.5194/amt-3-387-2010, 2010.
Niinemets, ¨U. and Reichstein, M.: Controls on the emission of plant
volatiles through stomata: Differential sensitivity of emission rates to stomatal closure explained, J. Geophys. Res., 108, 4208, doi:10.1029/2002JD002620, 2003.
Pacifico, F., Harrison, S. P., Jones, C. D., and Sitch, S.: Isoprene emissions and climate, Atmos. Environ., 43, 6121–6135, 2009. Pandolfi, M., Querol, X., Alastuey, A., Jimenez, J. L., Cusack,
M., Reche, C., Pey, J., Mohr, C., DeCarlo, P., Pr´evˆot, A., Baltensperger, U., Arti˜nano, B., Baldasano, J. M., Jorba, O., Burkhart, J., Hansel, A., Schallhart, S., M¨uller, M., Metzger, A., Ortega, A., Saarikoski, S., Cubison, M., Ng, S., Lorente, J., Ne-mitz, E., di Marco, C., Pe˜nuelas, J., Sicard, M., Comeron, A., Amato, F., Moreno, T., Viana, M., P´erez, N., Moreno, N., Seco, R., Filella, I., Llusi`a, J., Piot, M., and Pay, M. T.: Source and ori-gin of PM in the Western Mediterranean Basin: An overview of the DAURE campaign. Atmos. Chem. Phys. Discuss., in prepa-ration, 2011.
Pe˜nuelas, J. and Llusi`a, J.: Seasonal emission of monoterpenes by
the Mediterranean treeQuercus ilex in field conditions:
Rela-tions with photosynthetic rates, temperature and volatility, Phys-iol. Plant., 105, 641–647, 1999a.
Pe˜nuelas, J. and Llusi`a, J.: Short-term responses of terpene
emis-sion rates to experimental changes of PFD inPinus halepensis
andQuercus ilexin summer field conditions, Environ. Exp. Bot., 42, 61–68, 1999b.
Pe˜nuelas, J. and Llusi`a, J.: Linking photorespiration, monoterpenes
and thermotolerance inQuercus, New Phytol., 155, 227–237,
2002.
Pe˜nuelas, J. and Munn´e-Bosch, S.: Isoprenoids: an evolutionary pool for photoprotection, Trends Plant Sci., 10, 166–169, 2005. Pe˜nuelas, J. and Staudt, M.: BVOCs and global change, Trends
Plant Sci., 15, 133–144, 2010.
Pe˜nuelas, J., Llusi`a, J., and Estiarte, M.: Terpenoids – a Plant Lan-guage, Trends Ecol. Evol., 10, 289–289, 1995.
Pe˜nuelas, J., Llusi`a, J., Asensio, D., and Munn´e-Bosch, S.: Linking isoprene with plant thermotolerance, antioxidants and monoter-pene emissions, Plant Cell Environ., 28, 278–286, 2005.
Pe˜nuelas, J., Filella, I., Seco, R., and Llusi`a, J.: Increase
in isoprene and monoterpene emissions after re-watering of
droughtedQuercus ilexseedlings, Biol. Plantarum, 53, 351–354,
doi:10.1007/s10535-009-0065-4, 2009.
P´erez, N., Pey, J., Castillo, S., Viana, M., Alastuey, A., and Querol, X.: Interpretation of the variability of levels of regional back-ground aerosols in the Western Mediterranean, Sci. Total Envi-ron., 407, 527–540, 2008.
Pey, J., P´erez, N., Castillo, S., Viana, M., Moreno, T., Pandolfi, M., Lopez-Sebastian, J. M., Alastuey, A., and Querol, X.: Geochem-istry of regional background aerosols in the Western Mediter-ranean, Atmos. Res., 94, 422–435, 2009.
Pi˜nol, J., Avila, A., Escarre, A., Lledo, M. J., and Rod`a, F.: Com-parison of the Hydrological Characteristics of 3 Small Experi-mental Holm Oak Forested Catchments in Ne Spain in Relation to Larger Areas, Vegetatio, 100, 169–176, 1992.
Possanzini, M., Di Palo, V., and Cecinato, A.: Sources and photode-composition of formaldehyde and acetaldehyde in Rome ambient air, Atmos. Environ., 36, 3195–3201, 2002.
Ribas, A. and Pe˜nuelas, J.: Temporal patterns of surface ozone levels in different habitats of the North Western Mediterranean basin, Atmos. Environ., 38, 985–992, 2004.
Ribas, A. and Pe˜nuelas, J.: Surface ozone mixing ratio increase with altitude in a transect in the Catalan Pyrenees, Atmos. Environ., 40, 7308–7315, 2006.
Ribas, A., Pe˜nuelas, J., Elvira, S., and Gimeno, B. S.: Ozone exposure induces the activation of leaf senescence-related pro-cesses and morphological and growth changes in seedlings of Mediterranean tree species, Environmental Pollution, 134, 291– 300, 2005.
Rinne, J., Ruuskanen, T. M., Reissell, A., Taipale, R., Hakola, H., and Kulmala, M.: On-line PTR-MS measurements of atmo-spheric concentrations of volatile organic compounds in a Euro-pean boreal forest ecosystem, Boreal Environ. Res., 10, 425–436, 2005.
Ruuskanen, T. M., Taipale, R., Rinne, J., Kajos, M. K., Hakola, H., and Kulmala, M.: Quantitative long-term measurements of VOC concentrations by PTR-MS: annual cycle at a boreal forest site, Atmos. Chem. Phys. Discuss., 9, 81–134, doi:10.5194/acpd-9-81-2009, 2009.
Sanhueza, E., Holzinger, R., Donoso, L., Santana, M., Fernandez, E., and Romero, J.: Volatile organic compounds in the atmo-sphere of La Gran Sabana. I: Concentrations and atmospheric chemistry, Interciencia, 26, 597–605, 2001.
Sanhueza, E., Holzinger, R., Kleiss, B., Donoso, L., and Crutzen, P. J.: New insights in the global cycle of acetonitrile: release from theocean and dry deposition in the tropical savanna of Venezuela, Atmos. Chem. Phys., 4, 275–280, doi:10.5194/acp-4-275-2004, 2004.
Seco, R., Pe˜nuelas, J., and Filella, I.: Short-chain oxygenated VOCs: Emission and uptake by plants and atmospheric sources, sinks, and concentrations, Atmos. Environ., 41, 2477–2499, doi:10.1016/j.atmosenv.2006.11.029, 2007.
Seco, R., Pe˜nuelas, J., and Filella, I.: Formaldehyde
emis-sion and uptake by Mediterranean trees Quercus ilex
and Pinus halepensis, Atmos. Environ., 42, 7907–7914, doi:10.1016/j.atmosenv.2008.07.006, 2008.
Seco, R., Filella, I., Llusi`a, J., and Pe˜nuelas, J.: Methanol as a signal triggering isoprenoid emissions and photosynthetic
per-formance inQuercus ilex, Acta Physiol. Plant., 33, 2413–2422,
doi:10.1007/s11738-011-0782-0, 2011.
Sillman, S.: The relation between ozone, NOxand hydrocarbons
in urban and polluted rural environments, Atmos. Environ., 33, 1821–1845, 1999.
Singh, H. B., Salas, L. J., Chatfield, R. B., Czech, E., Fried, A., Walega, J., Evans, M. J., Field, B. D., Jacob, D. J., Blake, D., Heikes, B., Talbot, R., Sachse, G., Crawford, J. H., Avery, M. A., Sandholm, S., and Fuelberg, H.: Analy-sis of the atmospheric distribution, sources, and sinks of oxy-genated volatile organic chemicals based on measurements over the Pacific during TRACE-P, J. Geophys. Res., 109, D15S07, doi:10.1029/2003JD003883, 2004.
Singsaas, E. L. and Sharkey, T. D.: The regulation of isoprene emis-sion responses to rapid leaf temperature fluctuations, Plant Cell Environ., 21, 1181–1188, 1998.
Spirig, C., Neftel, A., Ammann, C., Dommen, J., Grabmer, W., Thielmann, A., Schaub, A., Beauchamp, J., Wisthaler, A., and Hansel, A.: Eddy covariance flux measurements of biogenic VOCs during ECHO 2003 using proton transfer re-action mass spectrometry, Atmos. Chem. Phys., 5, 465–481, doi:10.5194/acp-5-465-2005, 2005.
Staudt, M., Rambal, S., Joffre, R., and Kesselmeier, J.: Impact
of drought on seasonal monoterpene emissions fromQuercus
ilexin southern France, J. Geophys. Res.-Atmos., 107, 4602,
doi:10.1029/2001JD002043, 2002.
Steinbrecher, R., Klauer, M., Hauff, K., Stockwell, W. R., Jaeschke, W., Dietrich, T., and Herbert, F.: Biogenic and anthropogenic fluxes of non-methane hydrocarbons over an urban-impacted forest, Frankfurter Stadtwald, Germany, Atmos. Environ., 34, 3779–3788, 2000.
Terradas, J.: Holm oak and holm oak forest: an introduction, in: Ecology of Mediterranean evergreen oak forests, edited by: Rod`a, F., Retana, J., Gracia, C. A., and Bellot, J., Springer, Berlin, 3–14, 1999.
Tunved, P., Hansson, H. C., Kerminen, V. M., Strom, J., Dal Maso, M., Lihavainen, H., Viisanen, Y., Aalto, P. P., Komppula, M., and Kulmala, M.: High natural aerosol loading over boreal forests, Science, 312, 261–263, 2006.
Velikova, V., Pinelli, P., Pasqualini, S., Reale, L., Ferranti, F., and Loreto, F.: Isoprene decreases the concentration of nitric oxide in leaves exposed to elevated ozone, New Phytol., 166, 419–426, 2005.
Warneke, C., Luxembourg, S. L., de Gouw, J. A., Rinne, H. J. I., Guenther, A., and Fall, R.: Disjunct eddy covariance measure-ments of oxygenated volatile organic compounds fluxes from an alfalfa field before and after cutting, J. Geophys. Res., 107, 4067–4067, 2002.
White, M. L., Russo, R. S., Zhou, Y., Ambrose, J. L., Haase, K., Frinak, E. K., Varner, R. K., Wingenter, O. W., Mao, H., Talbot, R., and Sive, B. C.: Are biogenic emissions a significant source of summertime atmospheric toluene in the rural Northeastern United States?, Atmos. Chem. Phys., 9, 81–92, doi:10.5194/acp-9-81-2009, 2009.
Wright, G. A. and Schiestl, F. P.: The evolution of floral scent: the influence of olfactory learning by insect pollinators on the honest signalling of floral rewards, Funct. Ecol., 23, 841–851, 2009. Zhao, J. and Zhang, R. Y.: Proton transfer reaction rate
con-stants between hydronium ion (H3O+
)and volatile organic
com-pounds, Atmos. Environ., 38, 2177–2185, 2004.
Ziomas, I. C.: The Mediterranean Campaign of