THE GREGARIOUS BEHAVIOR OF INVESTORS FROM BALTIC STOCK MARKETS
Andreea Maria Pece
Department of Finance, Faculty of Economics Sciences and Business Administration, Babes-Bolyai University,Cluj-Napoca, Romania
Abstract: The main objective of this research is to investigate market participants’
gregarious behaviour in Baltic stock markets, namely Lithuania, Latvia and Estonia during the period January 2003-December 2013. The herding behaviour derives from the
investors’ irrationality, who trade financial assets based on their positive expectations
about prices future growth, generating manias among other market participants, thus ignoring the real return rates and the risk levels of their investments.The investors’
irrational behaviour is influenced by actions, feelings and impulses that are intertwined: mimicry, fear, trust, greed, optimism, pessimism, euphoria, panic. These features highlight an erroneous perception of investors in point of unsustained increase in prices, which has been generated by the stock prices deviations from their fundamental value.Under these premises, optimism, overreaction and speculative bubbles are appearing on the mar ket and may constitute triggering factors of a financial crash.The probability of the occurrence of the speculative bubbles and financial crashes is influenced by the continuous entry on the market of new investors and less informed participants, which often act based on impulse, following a benchmark, without considering their own analysis and information
that they hold. The existence of a “collective behaviour” of the investors, which is
manifested by their tendency to imitate other market participants actions and to “follow the herd”, so ignoring their own beliefs, may increase market sensitivity to shocks and the probability of the occurrence of the systemic risk.In order to identify the investors’ herding
behaviour, I have applied an adjusted CSSD model proposed by (Yao, Ma, Peng He, 2014), which implies the inclusion of two additional variables, the first one, to reduce the effect of multicollinearity and a second one, a lag term of the dependent variable, in order to improve the power of the model. Furthermore, I have constructed portfolios ranked according to daily market capitalization, by using quartile analysis, having as objective the identification of herding behaviour for small, medium and large companies. I have obtained mixed results. In the case of Lithuanian stock market, there is no statistical evidence in favour of herding behaviour of investors. Moreover, in the case of Latvia, the findings indicate a strong presence of herding behaviour in the case of large companies. In the case of Estonia, the empirical results highlighted the existence of herding behaviour for medium companies, which can be explained by the investors’ tendency to imitate the strategies of others market participants and to ignore their own beliefs.
Keywords: gregarious behaviour, emerging markets, quartile analysis
JEL classification: C1, C5, G1
1. Introduction
research realised by (Grossman, Stiglitz, 1980), (De Bondt, Thaler, 1985), (Shiller, 2003) put into questions the hypothesis of the efficient market theory, therefore the authors advocate for the predictability of financial markets and the existence of irrational behaviour of investors, which is influenced by their actions and feelings that intersect with each other, such as: imitation, fear, trust, greed, optimism, pessimism, euphoria, panic. Thus, (Grossman, Stiglitz, 1980) pointed out that the assumption according to which the capital markets are in equilibrium and there are no arbitrage opportunities is not supported when the arbitrage is costly and they have proposed a model in which prices reflect information held by informed investors, but only partially, so that the market participa nts who allocate resources to obtain information, will be rewarded. Furthermore, (De Bondt, Thaler, 1985) have compared portfolios with different composition, on the one hand a portfolio of the companies with the best performance from the market, and on the other hand a portfolio of non-performing companies from the market. The authors have concluded that the financial asset prices react disproportionately, so the financial assets prices are predictable, depending on the evolution from the past. (Shiller, 2003) has examined the studies that refer to the efficient market theory, reviewing its main flaws and has exposed the significance of the behavioural finance concept built on the correlation between the stock markets evolution and human psychology. Moreover, the author pointed out that the financial crashes originate in human groundlessness, which affect the main role that stock markets hold in an economy, namely optimal allocation of resources towards effective business sectors.
Therefore, in response to all weaknesses of the efficient market theory, in the ‘90s a new concept has its genesis, namely the behavioural finance, as a replication to anomalies that cannot be explained by traditional financial models. (Sornette, Johansen, 1997) have sustained the replacement of the usual interpretation of the efficient market theory, according to which the market participants extract and aware integrate, through their actions, all the available information in prices, with a new interpretation, according to which the market as a whole may exhibit an “emergent behaviour”, which is not shared by any of its constituents. The efficient market hypothesis will be recovered, when the investors will be able to extract and interpret this “collective information”.
Furthermore, I stop my attention on the concept of herding behaviour, which is situated on the border between finance and psychology. I consider relevant the opinion of (Christie, Huang, 1995), according to which the gregarious behaviour of investors occurs when the individuals ignore their own beliefs and take their investment decisions solely on the basis of collective actions in the market, even when they disagree with market forecasts. (Olsen, 1996) argues that the probability of herding behaviour manifestation is influenced by the difficulty in forecasting earnings per share. In this context, remains a challenge for researchers to identify an explanatory variable to quantify the investor psychology, as it can provide relevant information in the development of the financial models used to predict the evolution of financial assets prices.
2. Literature review
Specialized studies realized over time indicate the differences between theoretical models and econometric models used to quantify the herding behaviour of investors. Theoretical frameworks make reference to abstract models in order to identify the features of herding, while the empirical research only verifies the appearance of a “collective behaviour” on the market. In the literature, herding behaviour has become a debated topic for researchers, which try to provide eloquent answers regarding its impact on capital markets evolution. Regarding the developed stock markets from Asia, (Tan, Chiang, Mason, Nelling, 2008) have investigated the investors’ herding behaviour on the Chinese stock markets, both A and B, by using CSAD and CSSD models. Their findings indicate that the herding behaviour occurs on short time intervals. Moreover, there is an asymmetry in herding, it is most probable to occur during bull markets and in conditions of high volumes traded on the market. Another research for Asian stock markets was performed by (Demirer, Kutan, Chen, 2010) for the Taiwanese stock market. Compared with other studies, this research comes to enrich the financial literature by applying the state space model together with CSAD and CSSD and by conducting an analysis at sector level. The results provide evidence of herding behaviour for all sectors of activity.
Moreover, (Chiang, Li, Tan, 2010) have examined the Chinese stock market and as a novelty, the authors have introduced the quantile analysis, which pointed out the existence of herding behaviour, in particular in the case of lower quantiles. Regarding the impact of global financial crisis from 2007-2009, (Teng, Liu, 2014) have investigated the main important Chinese stock markets: Taiwan, Hong Kong, Shangai, Shenzen by using the state space model. The results obtained provide evidence of herding behaviour for each individual market and a contagion phenomenon between these markets, which was realized through investors’ gregarious behaviour. Moreover, (Chang, Lin, 2015) have examined the herding behaviour of investors at group level, by taking into consideration fifty stock markets during a period of forty six years and the impact of national culture on herding behaviour.
The results indicate the existence of herding behaviour for eighteen stock markets and the main features that influence the investors’ behaviour are: behavioural traps, excessive optimism, high confidence and mood effect.
Moreover, I have reviewed some studies which refer to the developed markets from Europe. (Khan, Hassairi, Viviani, 2011) have studied the investors’ herding behaviour by taking into account the stock markets’ performance and size from France, Great Britain, Germany and Italy. The results of Salmon and Hwang model (2001, 2004, 2008) provide evidence of herding for the four capital markets which have been analyzed. Moreover, (Mobarek, Mollah, 2013) recourse to a comparative analysis of herding behaviour between Northern European countries and PIIGS countries. Their findings suggest the existence of herding behaviour both for developed and emerging markets.
3. Data and methodology
In order to investigate the existence of herding behaviour for the investors from Baltic stock markets (respectively, Lithuania, Latvia and Estonia), I have used daily returns for the companies listed on these stock markets, corresponding to the period 2003-2013. The analysis was realized at portfolio level based on daily logarithmic returns, calculated by using the following formula:
÷
÷
ø
ö
ç
ç
è
æ
=
-1 ,
,
,
ln
t i
t i t
i
P
P
R
where, ܲǡ௧ represents the closing price of the stock for the day . As proxy variables for market portfolio I have used the market indices (OMXV, RIGSE and TALSE).
The portfolio analysis was performed by using the quantiles: 10, 25, 50, 75, 90. The portfolio composition was determined according to the level of daily market capitalization. The statistical methodology used to identify the existence of gregarious behaviour is the adjusted CSSD method, which was developed by (Yao, Ma, Peng He, 2014).
The CSSD model was first developed by (Christie, Huang, 1995) as a measure of return dispersions. The cross-sectional standard deviations of returns are determined based on the following equation:
ܥܵܵܦ௧ൌ ඨσ ൫ܴǡ௧െ ܴǡ௧൯
ଶ ே
ୀଵ
ܰ െ ͳ
where, ୲ constitutes the return dispersion at time , represents the number of companies from the portfolio, ୧ǡ୲ represents the stock return of company at time and
୫ǡ୲ represents the market return at time . The existence of herding behavior can be identified if there is a low value of dispersion around the mean.
The equation of the model is:
୲ ൌ Ƚ ɀଵห୫ǡ୲ห ɀଶ൫୫ǡ୲൯ଶ ɂ୲
The variable ଶ୫ǡ୲ was introduced in order to capture the nonlinear component, which can be identified mainly during the periods characterized by extreme market co nditions.The negative and statistically significant values of ɀଶ coefficient provide evidence of gregarious behavior of investors.
Based on the improvements that were introduced by (Yao, Ma, Peng He, 2014) for the CSSD model, in the current paper, I also have introduced two additional variables, namely:
୫
തതതത - the arithmetic mean of the variable ୫ǡ୲ , which has the purpose to reduce the effect of multicollinearity and a lag term of the dependent variable ୲ିଵ which has the objective to increase the power of the model. For the estimation of the model, I have applied the Newey West (1997) methodology.
After the inclusion of the new variables in order to improve the power of the model, the final equation of the model used to quantify the presence of gregarious behaviour is:
୲ൌ Ƚ ɀଵห୫ǡ୲ห ɀଶ൫୫ǡ୲െ തതതത൯୫ ଶ ɀଷ୲ିଵ ɂ୲
4. Empirical results
capitalization does not provides information about the investors’ behaviour.
Table 1: Estimated results of daily ܥܵܵܦ௧ for portfolios constructed based on market capitalization from Lithuania stock market
Portfolio ࡽൌ Ψ ࡽ ൌ Ψ ࡽൌ Ψ ࡽ ൌ ૠΨ ࡽൌ ૢΨ
ߙ 0.0083*** (3.341) 0.0067*** (3.642) 0.0103*** (6.975) 0.0108*** (10.555) 0.0081*** (16.456) ߛଵ 0.0909 (0.2278) 0.0186 (0.063) -0.3206 (-1.348) 0.4595*** (3.591) 0.3969*** (7.1751)
ߛଶ 4.5832 (0.8816) 4.6511 (1.143) 9.0831*** (2.947) 0.4881 (0.251) 1.2989 (1.561)
ߛଷ 0.5569*** (18.487) 0.5558*** (20.919) 0.2260*** (6.3406) 0.4146*** (24.066) 0.4311*** (26.259)
ܣ݆݀Ǥ ܴଶ 0.3116 0.3103 0.0618 0.1934 0.2906
Source: Author calculation; *** statistical significance at the 1% level; ** statistical significance at the 5% level; * statistical significance at the 10% level; () in the brackets are presented the values recorded by ݐݏݐܽݐ݅ݏݐ݅ܿ .
Table 2: Estimated results of daily ܥܵܵܦ௧ for portfolios constructed based on market capitalization from Latvia stock market
Portfolio ࡽൌ Ψ ࡽൌ Ψ ࡽ ൌ Ψ ࡽൌ ૠΨ ࡽൌ ૢΨ
ߙ 0.0085*** (5.399) 0.0418*** (9.988) 0.0118*** (5.062) 0.03105*** (18.348) 0.01218*** (17.644) ߛଵ 0.5050** (2.532) 0.3604 (0.710) 0.5948** (2.1851) 0.6605*** (3.214) 0.9163*** (11.961)
ߛଶ 0.4991 (0.129) 3.0206 (0.710) -1.8188 (-0.365) 0.3953 (0.098) -6.1361*** (-4.092)
ߛଷ 0.2857*** (14.924) 0.0453** (2.126) 0.1097*** (4.483) 0.0484** (2.562) 0.2337*** (13.274)
ܣ݆݀Ǥ ܴଶ 0.0917 0.0027 0.0189 0.0173 0.1671
Source: Author calculation; *** statistical significance at the 1% level; ** statistical significance at the 5% level; * statistical significance at the 10% level; () in the brackets are presented the values recorded by ݐݏݐܽݐ݅ݏݐ݅ܿ .
A different output can be observed in the case of Latvia, where the ߛଶcoefficient is negative and statistically significant for the portfolio which is composed by stocks with the highest market capitalization from the market. The results indicate that the occurrence of herding behaviour is frequent among the largest stocks from capital market from Latvia.
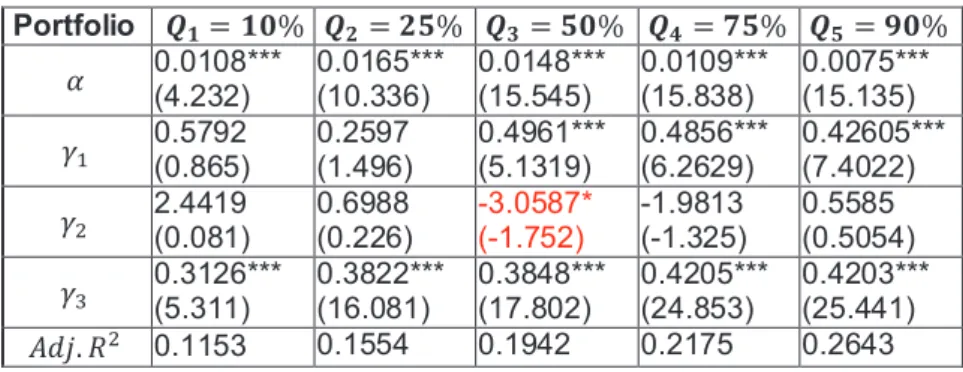
Table 3: Estimated results of daily ܥܵܵܦ௧ for portfolios constructed based on market capitalization from Estonia stock market
Portfolio ࡽൌ Ψ ࡽൌ Ψ ࡽ ൌ Ψ ࡽൌ ૠΨ ࡽൌ ૢΨ
ߙ 0.0108*** (4.232) 0.0165*** (10.336) 0.0148*** (15.545) 0.0109*** (15.838) 0.0075*** (15.135) ߛଵ 0.5792 (0.865) 0.2597 (1.496) 0.4961*** (5.1319) 0.4856*** (6.2629) 0.42605*** (7.4022)
ߛଶ 2.4419 (0.081) 0.6988 (0.226) -3.0587* (-1.752) -1.9813 (-1.325) 0.5585 (0.5054)
ߛଷ 0.3126*** (5.311) 0.3822*** (16.081) 0.3848*** (17.802) 0.4205*** (24.853) 0.4203*** (25.441)
Source: Author calculation; *** statistical significance at the 1% level; ** statistical significance at the 5% level; * statistical significance at the 10% level; () in the brackets are presented the values recorded by ݐݏݐܽݐ݅ݏݐ݅ܿ .
For Estonia, the findings suggest that market participants exhibit a gregarious behaviour for medium quantiles, while there is no evidence of herding in the case of small and large companies. The existence of herding behaviour in the case of medium companies can be explained by the investors’ tendency to imitate the strategies of others market participants and to ignore their own beliefs.
5. In conclusions
This paper investigated the presence of investors’ herding behaviour from Baltic stock markets, during the period January 2003-December 2013, by using an adjusted CSSD model, in order to correct for multicolinearity and to improve the power of the model. In order to provide a pertinent image of the existence of herding behaviour, I have constructed five portfolios based on the market capitalization, by using quantiles. The empirical results were mixed. In the case of Lithuania, there is no evidence of herding, which may be explained by the existence of an adequate quality of information on the market. Furthermore, in the case of Latvia, the value recorded by ߛଶcoefficient is negative and statistically significant, the high value of the coefficient provides a strong evidence of herding in the case of large companies, suggesting the existence of less experienced investors that will adopt “follower strategies”, which assume that small investors will analyze the actions of other market participants and will choose to imitate their trading strategies which they consider more appropriate. In the case of Estonia, the results provide evidence of herding in the case of medium companies, indicating that the less informed investors tend to imitate the collective behaviour from the market, ignoring their own beliefs.
I conclude that in the development of financial models the informed investors should include a variable in order to quantify the market participants’ psychology, having as a purpose to provide pertinent information in forecasting the evolution of stock prices, so avoiding the biases that can be introduce by herding behaviour, when realizing the estimations.
6. Acknowledgements
This paper has been financially supported within the project entitled “SOCERT.Knowledge society, dynamism through research”, contract number POSDRU/159/1.5/S/132406. This project is co-financed by European Social Fund through Sectoral Operational Programme for Human Resources Development 2007-2013. Investing in people!”
References
Caporale, G.M., Economou, F., Philippas, N. (2008) “Herding behavior in extreme market conditions: the case of the Athens Stock Exchange”, Economics Bulletin, Vol.7, No.17, pp 1-13.
Chang, C.H. and Lin, S.J. (2015) “The effect of national culture and pitfalls on investors’ decision-making: Herding behavior in international stock market”, International Review of Economics and Finance, doi: 10.1016/j.iref.2014.12.010
Chiang, C.T., Li, J., Tan, L. (2010) “Empirical investigation of herding behavior in Chinese stock markets: Evidence from quantile regression analysis”, Global Finance Journal, Vol. 21, pp 111-124
herd around the market?”, Financial Analysts Journal, Vol. 51, No.4, pp 31-37.
De Bondt, W.F.M and Thaler, R. (1985) “Does the Stock Market Overreact?”, The Journal of Finance, Vol. 40, No.3, pp 793-805.
Demirer, R., Kutan, M.A., Chen, C.D. (2010) “Do investors herd in emerging stock markets?: Evidence from the Taiwanese market”, Journal of Economic Behaviour & Organization, Vol.76, pp 283-285.
Fama, E. (1970) “Efficient capital market: A Review of Theory and Empirical Work”, The Journal of Finance, Vol. 25, No.2, pp 383-417.
Filip, A. și Pochea, M. (2014) „Herding behavior under excessive volatility in CEE stock markets”, Studia Universitatis Babes-Bolyai Oeconomica, Vol.59, No. 3, pp 38-47
Filip, A., Pochea, M., Pece, A. (2014) „The herding behaviour of investors in the CEE stocks markets”, Emerging Markets Queries in Finance and Business Conference 2014, pp 2-8.
Grossman, S.J and Stiglitz, J.E. (1980) “On the Impossibility of Informationally Efficient Markets”, The American Economic Review, Vol. 70, Issue 3, pp 393-408.
Khan, H., Hassairi, S.A., Viviani, J.L. (2011), „Herd behavior and market stress: The case of four European countries", International Business Research, vol. 4, no. 3, pp 53-67. Mobarek A. and Mollah S. (2013), „Cross-country analysis of herd behavior in Europe: Evidence from continental, nordic and the PIIGS countries”, working paper.
Olsen, R. (1996) “Implication of Herding Behaviour”, Financial Analysts Journal, July/August, pp 37-41.
Shiller, R.J. (2003) “From efficient market theory to behavioural finance”, Journal of Economic Perspectives, Vol.17, No.1, pp.83-104.
Shleifer, A. (2000) Inefficient markets: An Introduction to Behavioral Finance, Oxford University Press Inc., New York.
Sornette, D. and Johansen, A. (1997) “Large financial crisis”, Physica A-Statistical and Theoretical Physics, eds. Capel, H.W., B. Mulder, H.E. Stanley și C. Tsallis, 245, pp 1-18. Tan, L., Chiang, C., Mason, J., Nelling, E. (2008) “Herding behavior in Chinese stock markets: An examination of A and B shares”, Pacific-Basin Finance Journal, Vol. 16, pp 61-77.
Teng, Y.P. and Liu, A. (2014) “The study of herding behaviour among the Greater China Stock Markets during Financial Crisis”, Journal of Interdisciplinary Mathematics, Vol. 17, No. 2, pp 163-197.