Vol. 2 No. 4, (2014), pp. 13-26
ECONOMIC IMPACT ASSESSMENT OF INTEGRATED CROP
MANAGEMENT FARMER FIELD SCHOOL PROGRAM ON CORN
PRODUCTION IN INDONESIA
I Ketut Kariyasa
Indonesian Center for Agricultural Socio Economic and Policy Studies, Jln. Jend. A. Yani No.70 Bogor, West Java, Indonesia, 16161,
Email:[email protected]
Abstract
Domestic supply of corn in Indonesia has not been able to meet demand satisfactorily due to demand rising faster than supply. Therefore, Indonesia has been continuously importing corn about of 10% of the total demand. To address this problem, the Indonesian government started to implement the Farmer Field School of Integrated Crop Management (ICM-FFS) program on corn production since 2009. This study aimed to assess the impact of ICM-FFS on corn productivity, comparative and competitive advantages to produce corn as well as farmer’s income. The study found that ICM-FFS program could increase corn productivity by 30.95% of non ICM-FFS farms, of which 27.94% contributed by the difference in input use, while only 3.01% contributed by technological change. ICM-FFS farms were able to increase farmer’s income by 71.03% and social welfare by 94.69% compared to non ICM -FFS farms. Through this program, Indonesia had higher comparative advantage in producing corn as an import substitute. The provision of competitive input and output markets, enhanced technical assistance to improve corn productivity and quality, and increasing attention on corn ICM-FFS development could be considered as policy directions to improve the next implementation strategies of corn production in Indonesia.
Keywords: Corn, Indonesia, Farmer Field School, productivity, comparative advantage
1. Introduction
In Indonesia, corn was initially produced only for households’ direct consumption. Today, it is the second most important food crop after rice. Corn is a versatile crop being used as a raw material for a diverse range of industrial products, both food and feed. Specifically, corn is the most popular ingredient of manufactured animal feed. It comprises 51.4% of feed ingredients (Tangendjaja et al., 2003).
However, domestic supply of corn has not been able to meet its demand satisfactorily. This is due to demand rising faster than supply. During the period 1990-2009, the demand growth for corn was constantly rising at 10%-15% per year (FAO, 2010). But, at the same period, the growth of corn production was only 5% per year. Therefore, Indonesia has been continuously importing corn. During the period 1990-2008, imported corn increased at an average of 4% per year. Imported corn was approximately 10% of the total demand.
was basically an approach in accelerating the process of technology transfer through a learning process directly from a filed laboratory (MoA, 2010), participatory and non formal learning (Van de Fliert, 2007) as well as engaging farmers as the main subject of that activity (Asiabaka, 2002). Therefore, this approach is expected to increase corn productivity,
farmers’ income, comparative and competitive advantages in producing corn in Indonesia. In fact, the successfull implementation of ICM-FFS was influenced by various factors. Some previous researches showed that factors influencing adoption of a technology are such
as the reciepent factors of innovation (farmers’ characteristics) (Ani et al., 2004; Sambodo & Nuthall, 2010; Morris & Doss, 1999; Rogers, 1995). Therefore, those factors also should be considered as the important thing in attempting to improve the performance of ICM-FFS in the following years.
Based on the issues and information stated above, the objectives of the study are: (i) providing an overview of the implementation of corn ICM-FFS in Indonesia; (ii) analyzing the impact of FFS program on corn productivity; (iii) analyzing the impact of ICM-FFS program on comparative and competitive advantages in producing corn in Indonesia; and (iv) providing policy recommendations to improve the ICM-FFS program in the next implementation.
2. Methodology
2.1. Study Areas and Sampling Procedure
This research was conducted in two provinces; namely, East Java and West Nusa Tenggara Provinces, Indonesia. East Java Province was selected as the center of corn production in Indonesia while West Nusa Tenggara Province was selected to represent the province outside Java Island where ICM-FFS program is implemented. In choosing the farm samples, a stratified random sampling was employed. Under this stratification, with the basis of sampling size was designed to include 10% of each farmer group members, two hundred fourteen (214) farmers were interviewed there consisted of 120 ICM-FFS farmers and 94 non ICM-FFS farmers.
2.2. Analytical Tools
A number of analytical tools such as comparative mean analysis, decomposition analysis, and Policy Analysis Matrix (PAM) were employed to satisfy the objectives of this study. 2.2.1. Productivity Decomposition Analysis
Decomposition method is a mathematical technique for partitioning an aggregate into its component elements (Solow, 1957). This model enables researchers to allocate differences in productivity resulting from a variety of factors such as technological change and input use difference (Catelo, 1984). Some previous researches also used this tool to assess the contribution of each element to the productivity differences, among others, are Maryiono (2007), Narayanan and Maynard (2002), Lalwani (1990), Tan (1981) and Thanh and Singh (2006). Yhosino and Nakahigashi in 2001 also used this tool to know the role and contribution of infrastructure in economic development in Japan.
For the ICM-FFS farms; the Cobb Douglas production function was expressed as: lnYa = lna0 + a1lnNa + a2lnSa + a3lnCa + a4lnFa + ea (1) For the Non- ICM FFS farms; the Cobb Douglas production function was:
lnYb = lnb0 + b1lnNb + b2lnSb + b3lnCb + b4lnFb + eb (2) Where: Y = Yield, N = Labor, S = Seed, C = Chemical, and F = Fertilizer . To decompose the differences in the yield per hectare between the FFS and the non ICM-FFS farms, the difference of the predicted linearized production function of two groups using mean values of each variable was computed as follows:
Y = lnYa - lnYb (3)
lnYa - lnYb = (lna0+ a1lnNa + a2lnSa + a3lnCa + a4lnFa + ea) –
(lnb0 + b1lnNb + b2lnSb + b3lnCb + b4lnFb + eb) (4) By adding and subtracting some terms to equation (4),
lnYa - lnYb = (lna0- lnb0) + (a1lnNa - b1lnNb + a1lnNb - a1lnNb) + (a2lnSa - b2lnSb + a2lnSb – a2lnSb) +
(a3lnCa - b3lnCb + a3lnCb - a3lnCb) +
(a4lnFa - b4lnFb + a4lnFb - a4lnFb) + (ea – eb) (5) Then, by rearranging equation (5), the following decomposition model:
ln Ya - lnYb = [lna0-lnb0] +
[(a1-b1)lnNb + (a2-b2)lnSb +
(a3-b3)lnCb + (a4-b4)lnFb] +
[a1(lnNa-lnNb) +a2(lnSa-lnSb)+ a3(lnCa-lnCb)+a4(lnFa-lnFb)] +
[ea-eb]
2.2.2. Policy Analysis Matrix
The Policy analysis matrix (PAM) tool was employed to asses the impact of ICM-FFS program on private and social profitability of corn farms (Table 1). By employing this tool will be known that Indonesia has or does not have comparative and comperative advantages to produce corn in fulfillment its demand as import substitute.
measures the change in productivity due to the shift in the intercept of the production function
measures the change in productivity due to the shift in the slope of parameters of the production function (6) measures the change in productivity due to changes in the quantity of inputs used
Table 1. Policy Analysis Matrix (PAM)
Price Revenue
Costs
Profit Tradable
Inputs
Domestic Factors (Non-Tradable Inputs)
Private Prices X1 X2 X3 X4
Social Prices Y1 Y2 Y3 Y4
Divergences Z1 Z2 Z3 Z4
Source: Monke, E.A. and S.K. Pearson, 1989
Private Profitability and Competitive Advantage: The term private refers to observed revenues and costs reflecting actual market prices received or paid by corn farmers. The private or actual market prices thus incorporate the underlying economic costs and valuations plus the effects of all policies and market failures. Private profit, X4, is the difference between revenue (X1) and costs (X2 + X3).
The private profitability calculations show the competitiveness of the corn production. Specifically, the competitiveness of corn production can be calculated by using the formulation as follows:
Private Cost Ratio: PCR =( X3/(X1–X2) (7)
Where: PCR < 1, showing Indonesia has competitive advantage to produce corn. It means, at the actual prices that corn farming is benefiting to the farmer
; PCR > 1 (competitive disadvantage); and PCR = 1 (neutral condition).
Social Profitability and Comparative Advantage: The second row of the accounting matrix utilizes social prices. These valuations measure comparative advantage or efficiency of corn production. Social profit, Y4, is an efficiency measure because output, Y1, and inputs, Y2 + Y3, are valued in prices that reflect scarcity values or social opportunity costs. Social profit, like the private counterpart, is the difference between revenue and costs, all measured in social prices, Y4 = (Y1– Y2 – Y3). The comparative advantage of corn production can be calculated by using the formulation below:
Domestic Resource Cost Ratio: DRCR = Y3/(Y1–Y2) (9)
Where: DRCR < 1, Indonesia has comparative advantage in producing corn. It means that the fulfillment of corn for Indonesia is better by producing it domestically compared to import, since needed domestic production cost is lower than import cost or import price. In other words, in this condition Indonesia could save foreign exchange. DRCR > 1, Indonesia does not have comparative advantage to produce corn. In this case, the fulfillment of corn for Indonesia is better by importing corn compared to produce it domestically.
3. Results and Discussion
3.1. ICM-FFS Area Coverage
application and efficient corn-farming management through direct actual field laboratory exposures.
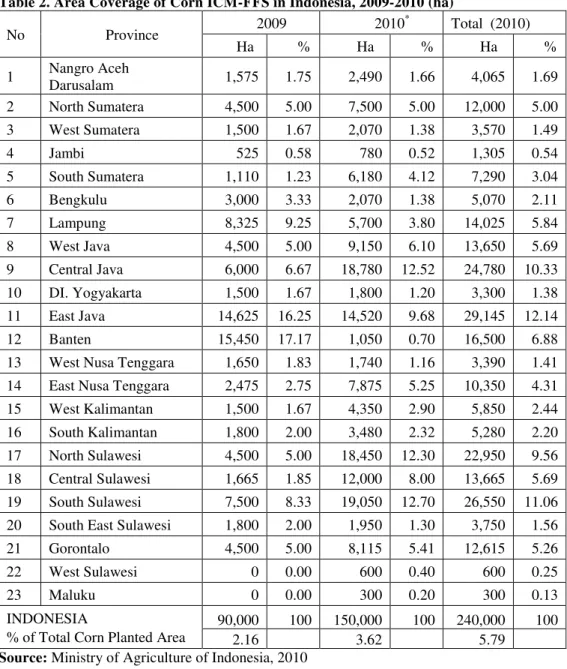
Table 2. Area Coverage of Corn ICM-FFS in Indonesia, 2009-2010 (ha)
No Province 2009 2010
*
Total (2010)
Ha % Ha % Ha %
1 Nangro Aceh
Darusalam 1,575 1.75 2,490 1.66 4,065 1.69
2 North Sumatera 4,500 5.00 7,500 5.00 12,000 5.00 3 West Sumatera 1,500 1.67 2,070 1.38 3,570 1.49
4 Jambi 525 0.58 780 0.52 1,305 0.54
5 South Sumatera 1,110 1.23 6,180 4.12 7,290 3.04
6 Bengkulu 3,000 3.33 2,070 1.38 5,070 2.11
7 Lampung 8,325 9.25 5,700 3.80 14,025 5.84
8 West Java 4,500 5.00 9,150 6.10 13,650 5.69
9 Central Java 6,000 6.67 18,780 12.52 24,780 10.33 10 DI. Yogyakarta 1,500 1.67 1,800 1.20 3,300 1.38 11 East Java 14,625 16.25 14,520 9.68 29,145 12.14
12 Banten 15,450 17.17 1,050 0.70 16,500 6.88
13 West Nusa Tenggara 1,650 1.83 1,740 1.16 3,390 1.41 14 East Nusa Tenggara 2,475 2.75 7,875 5.25 10,350 4.31 15 West Kalimantan 1,500 1.67 4,350 2.90 5,850 2.44 16 South Kalimantan 1,800 2.00 3,480 2.32 5,280 2.20 17 North Sulawesi 4,500 5.00 18,450 12.30 22,950 9.56 18 Central Sulawesi 1,665 1.85 12,000 8.00 13,665 5.69 19 South Sulawesi 7,500 8.33 19,050 12.70 26,550 11.06 20 South East Sulawesi 1,800 2.00 1,950 1.30 3,750 1.56 21 Gorontalo 4,500 5.00 8,115 5.41 12,615 5.26
22 West Sulawesi 0 0.00 600 0.40 600 0.25
23 Maluku 0 0.00 300 0.20 300 0.13
INDONESIA
% of Total Corn Planted Area
90,000 100 150,000 100 240,000 100
2.16 3.62 5.79
Source: Ministry of Agriculture of Indonesia, 2010
Note: * Incremental area implementation of corn ICM-FFS in 2010
Two more provinces; namely, West Sulawesi and Maluku began to implement the ICM-FFS program in 2010, resulting to additional aggregate coverage of 150 thousand hectares representing 3.62% of the total corn land area. South Sulawesi Province provided the biggest area for the program implementation at 19.1 thousand hectares (12.70% ), followed by Central Java and North Sulawesi with 12.52% and 12.30%, respectively. Third was East Java Province with 9.68%, and in the rest of the 19 provinces, the range was 0.20% to 6.10%.
Considering the last two years, ICM-FFS had a total coverage of 240 thousand hectares, or 5.79% of total corn planted area in 2010. East Java had the largest ICM-FFS area coverage at 12.14%, followed by South Sulawesi and Central Java at 11.06% and 10.33% respectively. Project implementation in the rest of the provinces varied, ranging from 0.13% to 9.56%. It is hoped that in the near future, the implementation area of ICM-FFS program would expand to other locations both within the provinces where the program is being implemented as well as in the remaining eleven provinces where it has not been implemented yet.
3.2. Ccomparative Mean Analysis for Input Use and Yield
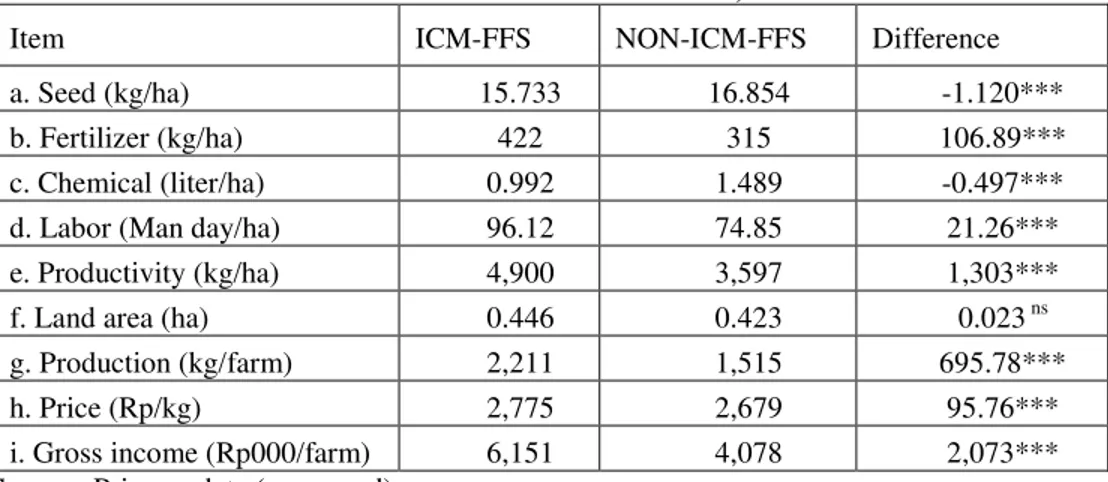
There were significant differences in input use at 1% probability level between ICM-FFS and non FFS farms (Table 3). On the average, the use of seed and chemical in ICM-FFS farms was lower by about 1.12 kg/ha and 0.497 kg/ha, respectively, than in non-ICM-FFS farms. Fertilizer and labor use was also significantly higher by 106.89 kg/ha and 21.3 man days, respectively, in ICM-FFS farms than in non ICM-FFS farms.
Table 3. Differences in Yield, Input Use, Production, Land Area, Price, and Income Between ICM-FFS and Non ICM-FFS Farms in Indonesia, 2010
Item ICM-FFS NON-ICM-FFS Difference
a. Seed (kg/ha) 15.733 16.854 -1.120***
b. Fertilizer (kg/ha) 422 315 106.89***
c. Chemical (liter/ha) 0.992 1.489 -0.497***
d. Labor (Man day/ha) 96.12 74.85 21.26***
e. Productivity (kg/ha) 4,900 3,597 1,303***
f. Land area (ha) 0.446 0.423 0.023 ns
g. Production (kg/farm) 2,211 1,515 695.78***
h. Price (Rp/kg) 2,775 2,679 95.76***
i. Gross income (Rp000/farm) 6,151 4,078 2,073*** Source: Primary data (processed)
Notes: *** Significant at 1% probability level, ns Not significant at 10% probability level There was a significant difference in mean productivity at 1% probability level between ICM-FFS and non ICM-FFS farms. Corn productivity of ICM-FFS farms was 1,303 kg/ha higher because farmers were more able to properly use inputs in terms of dose and time applications. Corn area under ICM-FFS program per farmer was larger by about 0.023 ha, but was not significant at 10% probability level.
corn price under ICM-FFS program was higher because of its better quality. Higher price and production mean higher income for ICM-FFS farmers.
3.3. Response Production Function
Production function analysis on Integrated Crop Management Farmer Field School (ICM-FFS) shows that 63.3% of the variations in corn productivity were explained by independent variables (seed, fertilizer, chemical, and labor) as indicated by multiple coefficient of determination, adjusted R2=0.633 (Table 4). The rest of the variations (36.7%) were explained by variables that were excluded from the model.
The independent variables were able to better explain the variation of corn productivity in non-ICM-FFS farms as well corn productivity as a whole (pooled) as indicated by adjusted R2 =0.693 and adjusted R2=0.836, respectively. The result indicates that the three models have a fairly high degree of goodness of fit.
An overall test for the significance of fitted model was conducted using the F-test. All the regression models with the main inputs considered were all significant at 1% probability level. This means that the independent variables as a whole had strong influence on corn productivity.
On the estimates of production functions, the constant term (intercept) was significantly higher at 1% probability level in ICM-FFS farms than in non ICM-FFS farms. This signifies the upward shift in production function due to technological change. The regression coefficient for seed was negative and significant at 1% probability level in ICM-FSS farms. This indicates that some ICM-FFS farmers use seed more than the recommended technology. As a result, the use of this input become ineffective. In other words, it can be said that this input works at stage III (the irrational zone) of production function. It was positive but has no significant influence on productivity to non ICM-FFS farms.
Table 4. Estimated Regression Coefficients of Cobb-Douglas Production Function (per ha) for ICM-FFS, non-ICM-FFS, and All Farms in Indonesia, 2010
Item Regression Coefficient
ICM-FFS Non FFS-ICM Pooled
Intercept 5.381*** (0.578)
4.750*** (0.863)
3.394*** (0.270) Seed (S) -0.495***
(0.156)
0.024 ns (0.085)
-0.077 ns (0.067) Fertilizer (F) 0.310***
(0.060)
0.479*** (0.145)
0.502*** (0.059) Chemical (C) -0.030
ns (0.047) 0.266* (0.157) -0.061** (0.026) Labor (N) 0.569***
(0.091)
0.149 ns (0.146)
0.498*** (0.078)
Sample size (n) 120 94 214
Adj R2 0.633 0.693 0.836
F-computed value 52.21*** 53.42*** 273.15*** Source: Primary data (processed)
The regression coefficient of fertilizer was positive and significant at 1% probability level in both ICM-FFS and of non ICM-FFS farms. The positive but less than unit production elasticity with respect to fertilizer indicate that the levels of fertilizer used worked in the rational zone of the production surface. The elasticity coefficient of fertilizer was lower for ICM-FFS than for non ICM-FFS farms (0.310 vs. 0.479) which indicates that the use of this production input in ICM-FFS farms was higher. Marginal productivity of this input, therefore, in non ICM-FFS was higher than in ICM-FFS farms. In other words, the higher production elasticity of fertilizer in non ICM-FFS farms could perhaps be due to the lower use of this input in non ICM-FFS as compared to ICM-FFS farms resulting in higher
efficiency level. This reflects the “diminishing marginal productivity” property of the
production function.
Although not significant, the use of chemical in ICM-FFS farms was not effective. This is indicated by the negative coefficient of this input. This phenomena is easily understood in the ICM-FFS program because farmers were not allowed to use chemical excessively, particularly pesticide, and were encouraged to implement the integrated pest management (IPM) approach. But in reality, some of the farmers may have ignored this recommendation. On the other hand, the coefficient of this input was positive and significant at 10% probability level in non ICM-FFS farms. This means that the use of chemical to exterminate pests and diseases was effective in increasing corn productivity.
The coefficient of labor in ICM-FFS farms was positive and significant at 1% probability level, but was not significant in non ICM-FFS farms. The labor coefficient was higher in ICM-FFS farms which means that the use of labor was more productive in ICM-FFS than in non ICM-FFS farms. If the use of labor increases by 10% (other inputs constant or ceteris paribus) then the productivity increases by 5.7% in FFS and 1.5% only in non ICM-FFS farms.
3.2. Chow’s Test and Levels of Output and Input Use
Chow’s test was employed to ascertain whether there exists any significant difference between the two production functions of ICM-FFS and non ICM-FFS. The Chow’s F-values were found to be significant at 1% probability level in production functions of ICM-FFS and non ICM-FFS (Table 5). Given these findings, it is interesting to assess the contribution of technical change (neutral and non neutral technology differences) as well as the mean input use to corn yield differences between the two types of technologies.
Table 5. Results of the Chow’s Test on Corn Farms in Indonesia, 2010
Item
ICM-FFS
NON
ICM-FFS Pooled
∑e2
(residual of the error sum squares) 1.552458 0.479822 0.926546
Number of Observations 120 94 214
d.f 115 89 204
F =4.24*** Source: primary data (processed)
Notes: *** Significant at 1% probability level
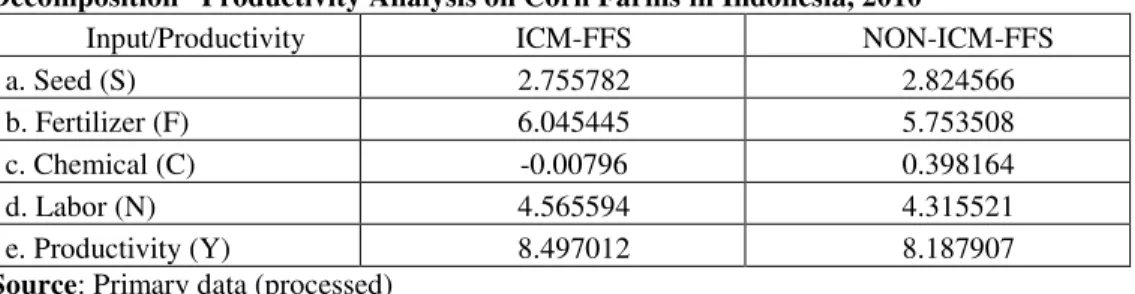
chemical inputs. The observed difference in corn productivity between ICM-FFS and non ICM-FFS farms was 30.91%.
Table 6. Means in Logarithm of Input and Productivity Used in Applying The Decomposition Productivity Analysis on Corn Farms in Indonesia, 2010
Input/Productivity ICM-FFS NON-ICM-FFS
a. Seed (S) 2.755782 2.824566
b. Fertilizer (F) 6.045445 5.753508
c. Chemical (C) -0.00796 0.398164
d. Labor (N) 4.565594 4.315521
e. Productivity (Y) 8.497012 8.187907
Source: Primary data (processed)
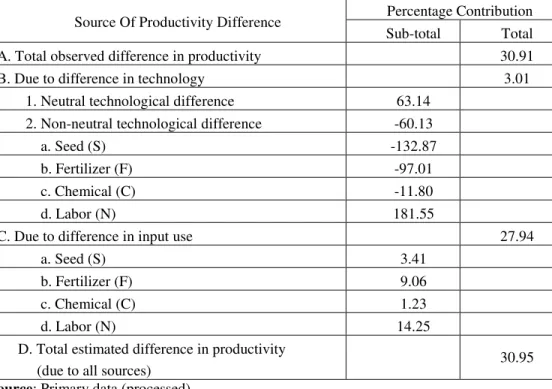
3.4. Source of Productivity Difference
The productivity decomposition analysis reveals that there was slight discrepancy between the observed (30.91%) and the estimated (30.95%) difference in the productivities of ICM-FFS and non ICM-FFS farms (Table 7). This discrepancy was attributed to the random term which, among others, accounts for variables that could not be included in the model such as management input. Such discrepancies of varying degrees in decomposition analysis were also noted in several earlier studies such as those of Kiresur et al. (1995) and Lalwani (1990). In majority of these studies, such discrepancies were attributed to random errors and exclusion of management input which is one of the important variables excluded from the model. However, in this study, the results of the decomposition analysis were found to be satisfactory since the discrepancy in the analysis was of a very low order.
The technological and input use differentials between the two technologies together contributed to form the total productivity difference of 30.95%. In other words, ICM-FFS farms yielded 30.95% higher corn productivity over existing practices (non ICM-FFS). The technological component alone, further contributed to productivity of 3.01%. This implies that with the present level of resources used by the non ICM-FFS farms, the corn productivity could increase by about 3.01% if they could just switch over from non ICM-FFS to ICM-FFS technology. This implies that by implementing ICM-FFS technology and using inputs similar to existing practices, corn productivity could be increased by 3.01%. If, however, the farmers implemented ICM-FFS technology but at the same time could also simultaneously raise the input use level to the same level as the ICM-FFS farms, productivity could further be raised from 3.01% to 30.95%. In other words, of the 30.95% increase in corn productivity, 3.01% was the contribution of technology itself and 27.94% was from the increased input use.
Table 7. Decomposition of Productivity Difference Between ICM-FFS and Non-ICM-FFS Farms in Indonesia, 2010
Source Of Productivity Difference Percentage Contribution Sub-total Total
A. Total observed difference in productivity 30.91
B. Due to difference in technology 3.01
1. Neutral technological difference 63.14 2. Non-neutral technological difference -60.13
a. Seed (S) -132.87
b. Fertilizer (F) -97.01
c. Chemical (C) -11.80
d. Labor (N) 181.55
C. Due to difference in input use 27.94
a. Seed (S) 3.41
b. Fertilizer (F) 9.06
c. Chemical (C) 1.23
d. Labor (N) 14.25
D. Total estimated difference in productivity
(due to all sources) 30.95
Source: Primary data (processed)
From the result of productivity analysis, the technology seemed to be very responsive to input use. This indicates that productivity sharply increased by 27.94% if the farmers could continuously raise the input use to the same level as that in ICM-FFS farms. It means that the more input is used, the more it contributes to the improvement of productivity. An increase in input use of labor gave the highest contribution (14.25%) to productivity difference, followed by increase in fertilizer use which contributed 9.65% to productivity difference. The reduction in seed and chemical use gave positive contributions to productivity difference of 4.41% and 1.23%, respectively.
It can be concluded that the ICM-FFS program on corn production yielded productivity of 30.95% higher than existing practices (non ICM-FFS). The difference in input use was the biggest contributor (27.94%) to the productivity difference in the two groups of corn farms. Technological difference alone contributed 3.01%. Therefore, the availability of input factors at the farm level according to the recommended technology will strongly determine the success of the program rather than the technology itself. The presence of a competitive input market is an essential component of this program.
3.5. Comparative and Competitive Advantages
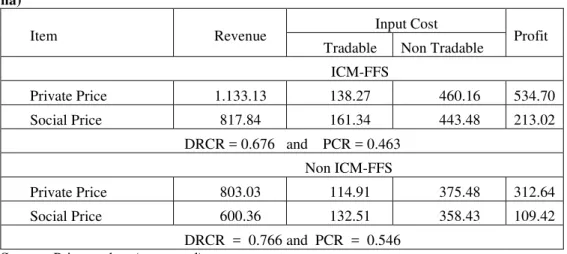
Table 8. Financial and Economic Profitability of Corn Farms per ha Under ICM-FFS and Non ICM-FFS Using Policy Analysis Matrix (PAM) in Indonesia, 2010 (US$ per ha)
Item Revenue Input Cost Profit
Tradable Non Tradable ICM-FFS
Private Price 1.133.13 138.27 460.16 534.70
Social Price 817.84 161.34 443.48 213.02
DRCR = 0.676 and PCR = 0.463 Non ICM-FFS
Private Price 803.03 114.91 375.48 312.64
Social Price 600.36 132.51 358.43 109.42
DRCR = 0.766 and PCR = 0.546 Source: Primary data (processed)
The less than 1 value of DRCR and PCR shows that Indonesia has comparative and competitive advantages to produce corn. DRCR = 0.676 means that producing corn in Indonesia through the implementation of ICM-FFS program required domestic resources amounting to only 67.6% of its import price. In other words, by implementing ICM-FFS program to produce corn in Indonesia as import substitute, the government will be able to save on foreign exchange equivalent to 32.4% of the amount of fund needed for its importation.
Moreover, by adopting the ICM-FFS program, Indonesia has competitive advantage to produce corn, as shown by value of PCR of 0.463. To get a revenue of US$ 100, it was needed domestic resources of only US$ 46.3. This means that farmers were able to generate financial profit from their farms.
Table 8 also shows the result of financial and economic profitability of corn under Non ICM-FFS program. Corn farms using existing practices were also profitable both financially and economically. This activity yielded profit of US$312.64 per hectare for the farmers. It also earned value added of US$109.42 per ha for the society. The result of analysis shows that Indonesia had comparative and competitive advantages to produce corn even by just implementing existing practices as shown by the DRCR of 0.766 and PCR of 0.546, respectively or less than one
From above information, Indonesia, indeed, has comparative and competitive advantages to produce corn as import substitute. In other words, aside from the profit gained by the farmers, it will be more beneficial to meet the demand for corn by producing this commodity domestically rather than through importation. Nevertheless, corn farms yielded higher financial and economic profits under ICM-FFS program than under existing practices. This
program was able to increase farmer’s income by 71.03% and social welfare of society by
4.Conclusion
Based on decomposition analysis, the technological and input use differentials contributed to form the total productivity difference of 30.95% between ICM-FFS and non ICM-FFS farms. The difference in input use is the biggest contributor (27.94%), while technological difference had a contribution of only 3.01%. Therefore, the availability of factor inputs according to technology recommendation at the farm level will strongly determine the success of this program rather than the technology itself.
Policy Analysis Matrix shows that corn production in both ICM-FFS and non ICM-FFS farms benefited the farmers and the society. However, ICM-FFS farms were able to increase
farmer’s income by 71.03% and social welfare by 94.69% compared to non ICM-FFS farms. In addition, through the ICM-FFS program, Indonesia has a higher comparative advantage in producing corn as an import substitute.
In ICM-FFS farms, increased productivity was mostly determined from input use difference rather than technology itself. This means that ICM-FFS farms responded better to input use. Therefore, the government should provide competitive input market to ensure that farmers could buy production inputs at lower prices and then able to use inputs according to the recommended technology. On the other hand, prices of agricultural products including corn are fluctuating and tend to discourage farmers from increasing their produce. Through a competitive output market, corn price at the farm level could remain favorable for growers to increase production.
The main problems at the farm level are low farmer’s education and lack of sufficient funding. Therefore, both central and local governments should constantly provide technical assistance to encourage farmers to improve their farm productivity. Such support should be
provided in terms of improved farmers’ knowledge through trainings, extension services, greater access to tenable credit programs, and an efficient marketing system.
The Indonesian government has given second priority to the corn ICM-FFS program with rice as its first priority. Therefore, area implementation for corn program was slow. It was implemented only in 5.79% of the total corn planted area, whereas for rice it was implemented in 34.36% of the total rice planted area. In order to accelerate the implementation of the corn ICM-FFS program, the government should also give more attention for this commodity than what it has been providing at present.
References
Ani, A. O., Ogunnikaa, O., & Ifah S.S. (2004). Relationship between Socio-Economic Charactereistics of Rural Women Farmers and Their Adoption of Farm Technologies in Soutern Ebonyi State, Nigeria. International Jorunal of Agriculture & Biology, (6)5), 802-805.
Asiabaka, C. (2002). Promoting Sustainable Extension Approaches: Farmer Field School (FFS) and Its Role in Sustainable Agricultural Development in African. International Journal of Agriculture and Rural Development, 3 46-53.
Braun, A. & Duveskog, D. (2008). The Farmer Field School Approach-History, Global Assessment and Success Stories. IMF for Agricultural Development.
Catelo, S.P. (1984). Decomposition Analysis of The Effect of Communal Irrigation System on Rice Production in Cagayan Region, Philippines. M.S. Thesis UPLB.
Chow, G.C. (1960). Tests of Equality Between Sets of Coefficient in Two Regression. Econometrica, 29(3):591-605.
Feder, G., R. Murgai &. Quizon, J.B. (2004). Sending Farmers Back to School: The Impact of Farmer Field School in Indonesia. Review of Agricultural Economics, 26(1):45-62. Kiresur, V., R. K. Pandey & Mruthyunjaya. (1995). Technological Change in Sorghum
Production: An Econometric Study of Dharwad Farms in Karnataka. Indian Journal of Agricultural Economic, 50(2):185-192.
Lalwani, M. (1990). Human Labor Absorption in Dairying: Evidence from Kamal Villages of Haryana. Indian Journal of Agricultural Economics, 45(2):150-158.
Mariyono, J. (2007). The Impact of Integrated Pest Management (IPM) Technology on Insecticide Use in Soybean Farming in Java, Indonesia: Two Models of Demand for Insecticides. Asian Journal of Agriculture And Development, 5 (1):43-55.
Ministry of Agriculture of Indonesia. (2010). Guidelines for Implementation of Integrated Crop Management Farmer Field School on Rice, Corn, Soybean, Peanut. Ministry of Agriculture of Indonesia, Jakarta. 123 pp.
Monke, E. A., & Pearson, S. (1989). The Policy Analysis Matrix For Agricultural Development. Cornell University Press, London. 196 pp.
Morris, M. L., & Doss, C. R. (1999). How Does Gender Affect the Adoption of Agricultural Innovations? The Case of Improved Maize Technology in Ghana. Presented at the Annual Meeting, American Agricultural Economic Association (AAEA), Nashville, Tennessee.
Narayanan, V.V. & Maynard, L.J. (2002). Impact Shelterbelts on Groundnut Production in Therilands: A Decomposition Analysis. Department of Agricultural Economic, University Of Kentucky.
Resosudarmo, B. P. & Yamazaki, S. (2006). Mass Guidance (BIMAS) vs. Farmer Field School: The Indonesian Experience. Research Report of The Australian National University.
Rogers, E. M. (1995). Diffusion of Innovation (Foruth Edition). New York Press.
Sambodo, L. A. A. T., & Nuthall, P. L. (2010). A Behavioural Approach to Understanding Semi-Subsistance Farmers’s Technology Adoption Decission: The Case of Improved Paddy Prawn System in Indonesia. Journal of Agricultural Education and Extension, 16(2), 111-129.
Solow, R.M. (1957). Technical Change and The Aggregate Production Function. Review of Economics and Statistics, 39 (2): 312-320.
Statistics Indonesia (2011). Statistical Yearbook of Indonesia. Statistics Indonesia, Jakarta. Statistics Indonesia (2010). Statistical Yearbook of Indonesia. Statistics Indonesia, Jakarta. Tan, Y. (1981). The Impact of Farm Mechanization on Small Scale Rice Production.
Unpublished. M.S. Thesis. UPLB.
Thanh, C. H. & Singh, B. (2006). Trend in Rice Production and Export in Vietnam. Omonrice (14):111-123. Cuu Long Delta Rice Research Institute and Division of Agricultural Extension, IARI, New Delhi, India
Tangendjaja, B., Y. Yusdja, &Ilham, N. (2003). Economic Analysis of Maize Demand for Feed in Maize Economy of Indonesia. Indonesian Agency for Agricultural Research and Development (IAARD). Jakarta.
Van de Fliert, E. (2007). Communication and Sustainable Rural Development. Communication for Social Change (pp. 85-96), Queensland: Communication for Social Change Faculty. Queensland University.