Time Regained: When People Stop a Physical
Activity Program, How Does Their Time Use
Change? A Randomised Controlled Trial
Sjaan Gomersall1,2*, Carol Maher1, Coralie English3, Alex Rowlands1, Tim Olds1
1Alliance for Research in Exercise, Nutrition and Physical Activity (ARENA), Sansom Institute for Health Research, University of South Australia, Adelaide, Australia,2Centre for Research on Exercise, Physical Activity and Health, School of Human Movement and Nutrition Sciences, The University of Queensland, Brisbane, Australia,3International Centre for Allied Health Evidence, Sansom Institute for Health Research, University of South Australia, Adelaide, Australia
Abstract
The aim of this study was to investigate how previously inactive adults who had participated in a structured, partly supervised 6-week exercise program restructured their time budgets when the program ended. Using a randomised controlled trial design, 129 previously inac-tive adults were recruited and randomly allocated to one of three groups: a Moderate or Ex-tensive six-week physical activity intervention (150 and 300 additional minutes of exercise per week, respectively) or a Control group. Additional physical activity was accumulated through both group and individual exercise sessions with a wide range of activities. Use of time and time spent in energy expenditure zones was measured using a computerised 24-h self-report recall instrument, the Multimedia Activity Recall for Children and Adults, and accelerometry at baseline, mid- and end-program and at 3- and 6-months follow up. At final follow up, all significant changes in time use domains had returned to within 20 minutes of baseline levels (Physical Activity 1-2 min/d, Active Transport 3-9 min/d, Self-Care 0-2 min/d, Television/Videogames 13-18 min/d in the Moderate and Extensive group, relative to Con-trols, respectively, p>0.05). Similarly, all significant changes in time spent in the moderate energy expenditure zone had returned to within 1-3 min/d baseline levels (p>0.05), however time spent in vigorous physical activity according to accelerometry estimates remained ele-vated, although the changes were small in magnitude (1 min/d in the Moderate and Exten-sive groups, relative to Controls, p=0.01). The results of this study demonstrate strong recidivist patterns in physical activity, but also in other aspects of time use. In designing and determining the effectiveness of exercise interventions, future studies would benefit from considering the whole profile of time use, rather than focusing on individual activities.
Trial Registration
Australian New Zealand Clinical Trials RegistryACTRN12610000248066
a11111
OPEN ACCESS
Citation:Gomersall S, Maher C, English C, Rowlands A, Olds T (2015) Time Regained: When People Stop a Physical Activity Program, How Does Their Time Use Change? A Randomised Controlled Trial. PLoS ONE 10(5): e0126665. doi:10.1371/ journal.pone.0126665
Academic Editor:Jean-Pierre Després, Québec Heart and Lung Institute, CANADA
Received:June 1, 2014
Accepted:March 30, 2015
Published:May 29, 2015
Copyright:© 2015 Gomersall et al. This is an open access article distributed under the terms of the
Creative Commons Attribution License, which permits unrestricted use, distribution, and reproduction in any medium, provided the original author and source are credited.
Data Availability Statement:All relevant data are within the Supporting Information fileS1 Dataset.
Funding:This study was supported by a National Health and Medical Research Council Project Grant (#631916). The funder had no role in study design, data collection and analysis, decision to publish, or preparation of the manuscript.
Introduction
When people start an exercise program, the time needed for exercise, changing in and out of exercise clothing, showering, and getting to and from the exercise venue must be drawn from other“time reservoirs”. Our previous work has shown that this time is largely drawn television viewing [1]. This study addresses a related question: when peoplestopa structured, externally imposed exercise program, what happens to the time that has been“freed up”? How do people restructure their time budgets? Is extra time devoted to similar or alternative forms of physical activity? Are there enduring changes in time use, or is the pre-program pattern of time use resumed?
The level of recidivism in physical activity programs is notoriously high, often cited at 50% drop-out after 6 months [2], even when the exercise stimulus (i.e. the structured program) con-tinues. However, follow-up measures using typical physical activity questionnaires may be misleading, because former participants may adopt other types of physical activity after the ex-ercise stimulus has stopped, such as gardening or walking, which may not be captured by the questionnaires [3,4]. Questionnaires may also fail to capture shifts from sedentary behaviours to light physical activity.
When individuals cease a structured physical activity program, the time previously commit-ted to the program is freed up. How this time is redistribucommit-ted can have important health conse-quences. If the liberated time is devoted to television viewing, for example, then there may be a negative effect on health [5,6]. If it is devoted to sleep, the detrimental effects may be mitigated, since poor sleep has been associated with greater risk of obesity [7] and depression [8]. It is possible that participation in a structured program may“reset”a hypothetical“physical activity setpoint”[9]. This may lead to time freed up from a structured exercise program being devoted to alternative physical activity.
These patterns of“isotemporal displacement”have received very little attention in the physical activity literature. Very little is known about how people’s global use of time changes before, during and after an exercise intervention. The aim of this study was to investigate how previously inactive adults who had participated in a structured, partly supervised 6-week ex-ercise program restructured their time budgets when the program ended. This study was con-ducted within a larger randomised controlled trial aimed at investigating the activitystat hypothesis [10].
Methods
This study used a randomised controlled trial, multi-arm, parallel design, with two intervention groups and one control group and ethics approval was gained from the University of South Australia Human Research Ethics Committee (P009/10). Participants were allocated to groups on a 1:1:1 ratio using a computer generated random allocation sequence by a person external to the study. This study was registered with the Australian New Zealand Clinical Trials Registry
(ACTRN12610000248066) and was conducted and is reported according to the CONSORT
Participants
Volunteers were recruited via email and print advertising from a large metropolitan university and several government departments. Prior to screening or testing, potential participants were required to provide written informed consent. For inclusion in this study, participants were re-quired to be aged 18–60 years, weigh less than 150 kg, be insufficiently active [accumulating less than 150 minutes of moderate to vigorous physical activity (MVPA) in the past week ac-cording to the Active Australia Survey [12] (screening stage 1,Fig 1) and medically cleared for exercise under the Sports Medicine Australia pre-exercise screening criteria [13] (screening stage 2,Fig 1). Participants were provided with a $200 gratuity at completion of the study.
The intervention
Participants in the two intervention groups (Moderate and Extensive) took part in an existing 40-day (6-week) physical activity program [14] located at the City East Campus of the Univer-sity of South Australia. The goal of the physical activity program was to increase moderate to vigorous physical activity by 150 min/week in the Moderate group and 300 min/week in the Extensive group. The two intervention conditions involved similar types of activities and inten-sities and differed only in volume. Full details of the intervention have been provided elsewhere [10]. Half of the prescribed physical activity was to be accumulated in structured, supervised group classes, and half in the participants’own time using modalities of their choice. The pro-gram was of moderate to vigorous intensity (60–85% HRmax) and intensity was graded over the course of the 6-week program. The group sessions were designed to expend approximately 800 kJ per session in the first week and to increase by about 200 kJ in each subsequent week. The supervised sessions consisted of a wide variety of group activities such as circuit classes, boxing, dancing, bushwalking and kayaking. All sessions, both group and individual, were monitored for compliance using heart rate monitors (Polar S6101i, Finland). Participants allocated to the Control group were not given any instructions about what they should do. Participants in the Moderate and Extensive groups were given no specific instructions at the end of the 6-week physical activity intervention.
Measurements
All participants undertook testing on five occasions: baseline (week 0), mid-program (weeks 3–4), end-program (week 6), and at 3- and 6-month follow-up (weeks 12 and 24). All outcome measures were administered by trained research assistants who were blinded to the partici-pants’group allocation. Measurements within the larger trial included use of time recalls, accel-erometry, doubly labeled water, resting metabolic rate, VO2max, blood glucose and cholesterol, and anthropometry. The focus of this paper will be the use of time recalls and accelerometry data from all five measurement occasions.
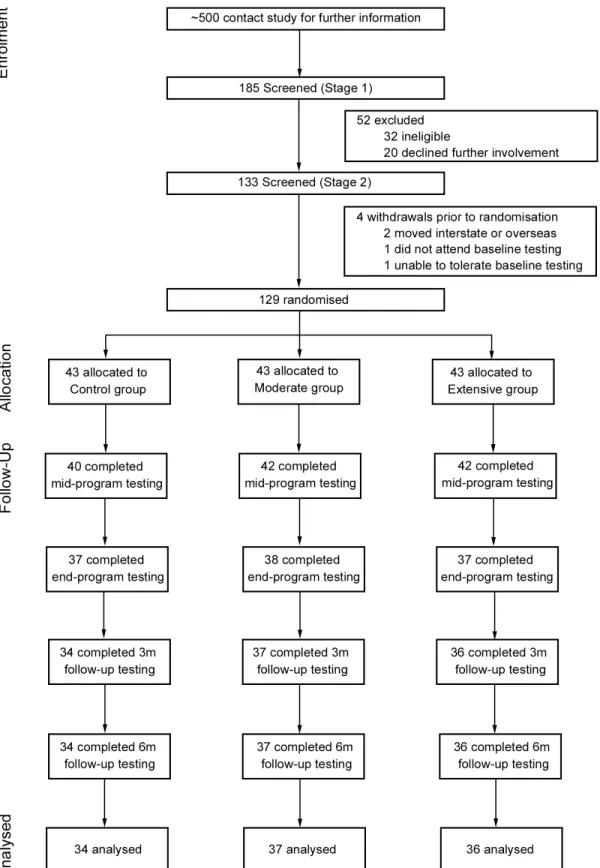
Fig 1. CONSORT flow diagram of participant recruitment, enrolment and progression through the study.Note: 3m = 3-month, 6m = 6-month.
minute of rho = 0.72 [16]. A recent comparison of the children’s version with doubly-labeled water showed correlations of rho = 0.70 for total daily energy expenditure [19].
At each time point, the MARCA was administered by telephone by trained interviewers. Each time, two separate calls were made approximately one week apart, where in each call par-ticipants recalled the two previous days. This therefore resulted in four recalled days per mea-surement time point, where at least one weekday and one weekend day were required. Where possible, the same days of the week were recalled at all five time points.
Accelerometry. In addition to use of time recalls, accelerometry was used to objectively measure physical activity using the Actigraph GT3X accelerometer (Actigraph, Pensacola, Florida). The Actigraph GT3X has demonstrated very good intra- and inter-device reliability when tested using a motorised vibration table (intra-instrument coefficient of variation2.5% and intra-class correlation coefficient of 0.97) [20,21] and previous versions of the Actigraph (CSA and GT1M) have demonstrated hip-worn validity in treadmill walking and running compared with indirect calorimetry (r = 0.56, p<0.001 and r = 0.53, p<0.05, respectively) [22,
23]. Recent studies comparing the GT3X and GT1M accelerometer models have found similar results, with a concordance correlation coefficient between accelerometers of 0.99 [24]. At each of the five time points, participants were asked to wear the device on their right hip for 24 h per day, for seven days. Participants were advised to only remove the accelerometer overnight if they were unable to tolerate it while sleeping and for water-based activities. They were also asked to complete a brief log to record when and why they removed the monitor during the monitoring period. Accelerometers were programmed to capture 30-second epochs and mini-mum wear time was defined as 10 hours per day for four of the seven days, of which one must be a weekend day. Non-wear time was defined as 60 minutes of consecutive zeros.
Data treatment
Multimedia Activity Recall for Children and Adults. Daily minutes of activity were cal-culated by summing the number of minutes participants reported being involved in each activi-ty, and averaging them across the four recall days. The 520 activities in the MARCA were combined into“activity sets”and collapsed hierarchically into domains based on similarity and to preserve comparability with previous studies. Eleven mutually exclusive and exhaustive ac-tivity“superdomains”were identified: Physical Activity, Computer, Active Transport, Passive Transport, Quiet Time (e.g. reading and listening to music), Self-Care, Socio-cultural, Work and Study, Chores, Sleep, and TV/Videogames (previously published in greater detail [1]).
Activities were also clustered according to five mutually exclusive and exhaustive energy ex-penditure zones: 0–0.9 METs (sleep); 1–1.9 METs (very light physical activity, VLPA); 2–2.9 METs (light physical activity, LPA); 3–5.9 METs (moderate physical activity, MPA); and6 METs (vigorous physical activity, VPA).
Accelerometry. Minutes spent in sleep/sedentary, light, moderate and vigorous physical activity domains were calculated using the Actilife 5.5 software (Actigraph, Pensacola, Florida), with any 30-second period above the count threshold included. Sleep and sedentary behaviour were combined due to the 24-h wear protocol used in this study. Minutes spent in the energy expenditure zones were calculated according to the vertical axis using cut points previously de-scribed by Troiano and colleagues and used in the United States National Health and Nutrition Examination Survey [25].
Statistical analysis
for differences at baseline in accordance with the CONSORT guidelines for randomised con-trolled trials [11]. Differences in characteristics between completers and non-completers were analysed using Student’s t-test for continuous variables (age, body mass index and gross house-hold income) and chi-squared tests for categorical variables (% female and group allocation). Compliance data (duration and intensity of physical activity sessions) based on objective heart rate monitoring during the intervention were analysed descriptively.
Because this study addresses mechanisms, analysis for the main outcomes was performed on a per protocol basis. Random effects mixed modeling (using the‘Mixed Models/Generalised Linear Models’function and a variance components covariance structure) was used to compare the variables of interest at each time point with time (0, 3, 6, 12 and 24 weeks) and group allo-cation (Control vs Moderate vs Extensive) as the fixed factors. For sub-group analyses only in-tervention participants were included with compliance [low complier (attended<70% of
prescribed physical activity program) vs high complier (attended70% of prescribed physical activity program)] as the fixed factor. Overall group and time p-values are reported, in addition to group x time interaction p-values for each time point. When there was a significant group x time interaction effect at a given time point, post-hoc analyses with Fisher’s least significant dif-ference tests were used to identify where the significant effect was (e.g. Control vs Moderate group, Control vs Extensive group, Moderate vs Extensive group). Post-hoc findings are indi-cated by superscripts in the results tables. Where the data were skewed, generalised linear mixed models were applied according to the distribution. A significant group by time interac-tion indicated a significant difference in time use among the groups. Alpha was set at 0.05. While no correction has been made for multiple comparisons, actual p-values are reported.
A priori power calculations determined that with three groups and five measurement peri-ods, random effects mixed modeling is able to detect a small effect size (Cohen’s d0.3) with 80% power and an alpha of 0.05 (two-sided) with 36 participants per group.
Results
Participant characteristics
A total of 129 participants were enrolled in the study, with 107 participants completing the study. The characteristics of the participants are shown inTable 1. A flow diagram of partici-pant recruitment, enrolment and progression through the study is shown inFig 1. Reasons for withdrawal included being unable to commit the time required to complete the study (n = 11), personal, work or family reasons (n = 7) or medical reasons (unrelated to the physical activity intervention; n = 4). Completers were more likely to be older (p<0.01; mean age of 43 years
compared to 33 years for the non-completers). There was no statistical difference between completers and non-completers for gender (p = 0.22), gross household income (p = 0.88), body
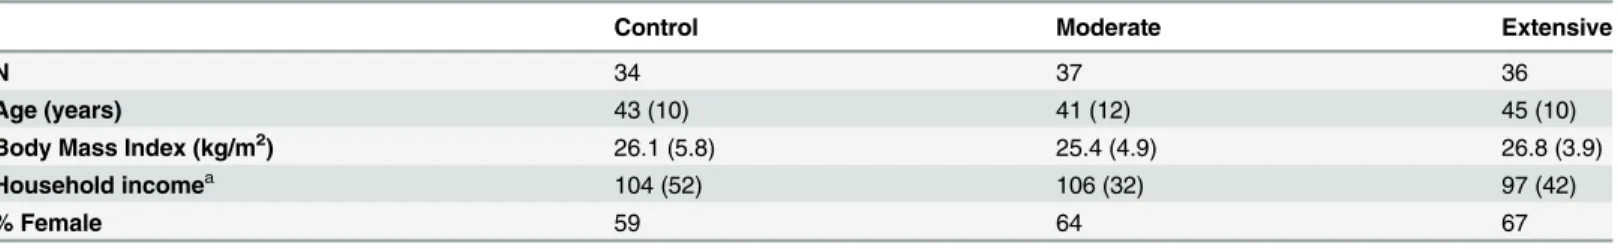
Table 1. Baseline sociodemographic and anthropometric characteristics of the sample.
Control Moderate Extensive
N 34 37 36
Age (years) 43 (10) 41 (12) 45 (10)
Body Mass Index (kg/m2) 26.1 (5.8) 25.4 (4.9) 26.8 (3.9)
Household incomea 104 (52) 106 (32) 97 (42)
% Female 59 64 67
aPre-tax income in thousands of Australian dollars per annum. One Australian dollar is approximately equivalent to one US dollar. The mean household
income in Australia is about $70,000 p.a.
mass index (p = 0.74) or group allocation (Control, Moderate, Extensive; p = 0.68). Most were in full employment in mainly professional or clerical positions, 64% were women, and they came from households that were economically advantaged relative to the general Australian population.
Compliance with the intervention
Compliance with the prescribed physical activity program was measured by the duration and intensity of sessions recorded by objective heart rate monitoring. In accordance with the per protocol analysis, the following compliance data are presented for completers only (n = 36 Ex-tensive group; n = 37 Moderate group). Duration was determined by weekly volume of physical activity sessions recorded using the heart rate monitor. Overall, participants in the Extensive group recorded on average 386 minutes per week and the Moderate group 195 minutes per week of physical activity. Intensity was determined on the basis of average heart rate for the en-tire recorded session (as a percentage of age-predicted maximal heart rate) for each participant. This included time spent in warm up and stretching activities and the cool-down period. Aver-age weekly intensity in both groups ranged from approximately 65–75% HRmax
Changes following the physical activity program in superdomains of time
use
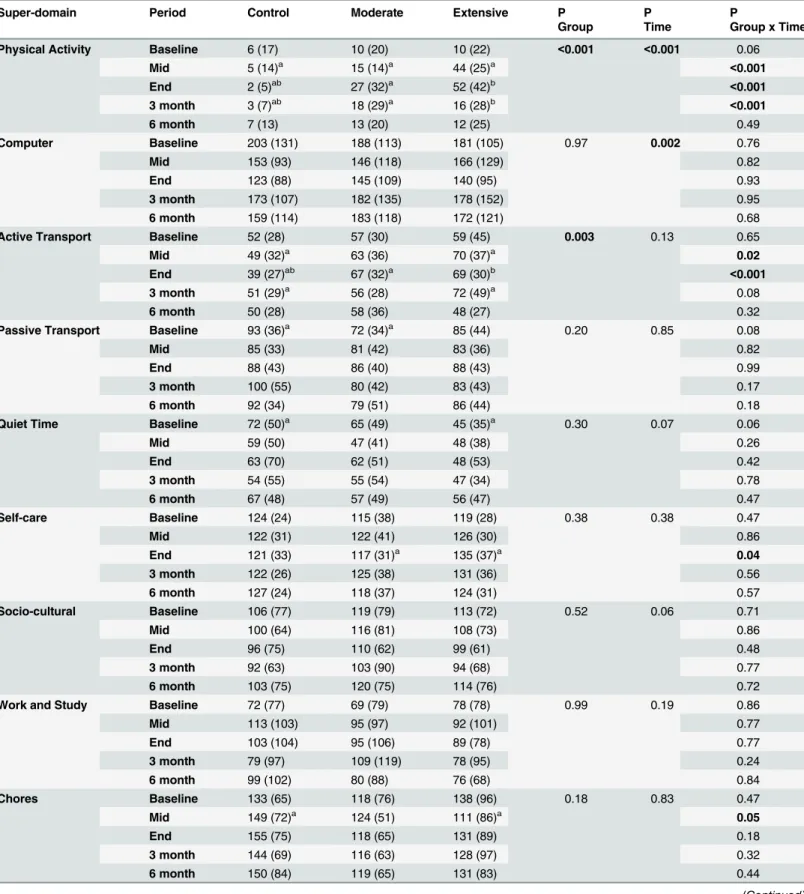
According to the MARCA, participants’time use patterns had mostly returned to their pre-intervention pattern by 6-month follow up. The average number of minutes per day in each superdomain for each group at each of the five measurement occasions is shown inTable 2. The magnitude of the shifts in time among superdomains in the Moderate and Extensive groups, relative to Controls is shown inTable 3andFig 2.
At the end of the intervention, the Moderate and Extensive groups were spending signifi-cantly more time in several time use domains including Physical Activity (21–46 min/d), Self-Care (5–19 min/d) and Active Transport (23 min/d in both groups) (Table 3). These changes were compensated by significant reductions in Television/Videogames (57–63 min/d). At the final follow up, all changes had reversed to within 10–15 min/d of baseline, with no significant changes retained at six months. Large but non-significant shifts in time were also seen in an in-crease in Computer time (24–27 min/d) and a dein-crease in Sleep (25–39 min/d) in the interven-tion groups, compared to the Control groups at the end of the interveninterven-tion. By six month follow up, Sleep had returned to within ±6 min/d however Computer use remained elevated (39–45 min/d), albeit non-significantly.
Changes following the physical activity program in different energy
expenditure zones
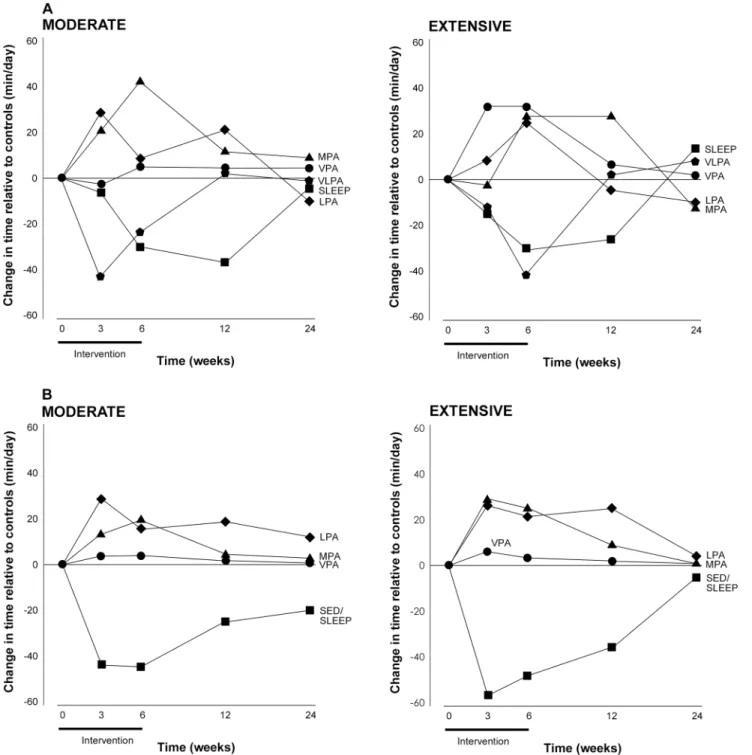
Time spent in different energy expenditure zones was measured by the MARCA and accelero-metry and results from both measures showed similar trends. The mean daily time spent with-in each energy expenditure zone, by each group at each time period accordwith-ing to the MARCA and accelerometry is shown inTable 4. The magnitude of the shifts in time among energy ex-penditure zones in the Moderate and Extensive groups, relative to Controls is shown in
Table 5.Fig 3compares the shifts in time according to both measures.
Table 2. Mean (SD) time (min/d) spent in each superdomain by each of the groups at each time point, and P-values for main effects of Group and Time, and Group x Time interactions.
Super-domain Period Control Moderate Extensive P P P
Group Time Group x Time
Physical Activity Baseline 6 (17) 10 (20) 10 (22) <0.001 <0.001 0.06
Mid 5 (14)a 15 (14)a 44 (25)a
<0.001
End 2 (5)ab 27 (32)a 52 (42)b <0.001
3 month 3 (7)ab 18 (29)a 16 (28)b
<0.001
6 month 7 (13) 13 (20) 12 (25) 0.49
Computer Baseline 203 (131) 188 (113) 181 (105) 0.97 0.002 0.76
Mid 153 (93) 146 (118) 166 (129) 0.82
End 123 (88) 145 (109) 140 (95) 0.93
3 month 173 (107) 182 (135) 178 (152) 0.95
6 month 159 (114) 183 (118) 172 (121) 0.68
Active Transport Baseline 52 (28) 57 (30) 59 (45) 0.003 0.13 0.65
Mid 49 (32)a 63 (36) 70 (37)a 0.02
End 39 (27)ab 67 (32)a 69 (30)b
<0.001
3 month 51 (29)a 56 (28) 72 (49)a 0.08
6 month 50 (28) 58 (36) 48 (27) 0.32
Passive Transport Baseline 93 (36)a 72 (34)a 85 (44) 0.20 0.85 0.08
Mid 85 (33) 81 (42) 83 (36) 0.82
End 88 (43) 86 (40) 88 (43) 0.99
3 month 100 (55) 80 (42) 83 (43) 0.17
6 month 92 (34) 79 (51) 86 (44) 0.18
Quiet Time Baseline 72 (50)a 65 (49) 45 (35)a 0.30 0.07 0.06
Mid 59 (50) 47 (41) 48 (38) 0.26
End 63 (70) 62 (51) 48 (53) 0.42
3 month 54 (55) 55 (54) 47 (34) 0.78
6 month 67 (48) 57 (49) 56 (47) 0.47
Self-care Baseline 124 (24) 115 (38) 119 (28) 0.38 0.38 0.47
Mid 122 (31) 122 (41) 126 (30) 0.86
End 121 (33) 117 (31)a 135 (37)a 0.04
3 month 122 (26) 125 (38) 131 (36) 0.56
6 month 127 (24) 118 (37) 124 (31) 0.57
Socio-cultural Baseline 106 (77) 119 (79) 113 (72) 0.52 0.06 0.71
Mid 100 (64) 116 (81) 108 (73) 0.86
End 96 (75) 110 (62) 99 (61) 0.48
3 month 92 (63) 103 (90) 94 (68) 0.77
6 month 103 (75) 120 (75) 114 (76) 0.72
Work and Study Baseline 72 (77) 69 (79) 78 (78) 0.99 0.19 0.86
Mid 113 (103) 95 (97) 92 (101) 0.77
End 103 (104) 95 (106) 89 (78) 0.77
3 month 79 (97) 109 (119) 78 (95) 0.24
6 month 99 (102) 80 (88) 76 (68) 0.84
Chores Baseline 133 (65) 118 (76) 138 (96) 0.18 0.83 0.47
Mid 149 (72)a 124 (51) 111 (86)a 0.05
End 155 (75) 118 (65) 131 (89) 0.18
3 month 144 (69) 116 (63) 128 (97) 0.32
6 month 150 (84) 119 (65) 131 (83) 0.44
month follow up, changes in time in sedentary and moderate zones were no longer significant, although increases in time in the vigorous zone remained significantly elevated by 0.86–1.25 min/d in the intervention groups compared to the Control group, according to accelerometry.
Discussion
Key findings
The aim of this study was to investigate how previously inactive adults who had participated in a structured, partly supervised 6-week physical activity program restructured their time bud-gets when the program ended. This was investigated in two ways, firstly by exploring how time in specific activity domains was restructured and secondly, how time spent in mutually Table 2. (Continued)
Super-domain Period Control Moderate Extensive P P P
Group Time Group x Time
Sleep Baseline 467 (36)a 505 (84)a 483 (66) 0.19 0.10 0.09
Mid 493 (52) 526 (72)a 492 (59)a 0.08
End 508 (51) 514 (85) 492 (63) 0.44
3 month 501 (71) 500 (76) 492 (77) 0.85
6 month 474 (55)a 508 (61)a 506 (125) 0.09
TV/Video games Baseline 112 (59) 122 (70) 129 (88) 0.59 0.23 0.97
Mid 112 (70) 104 (61) 101 (74) 0.77
End 144 (90)ab 98 (52)a 98 (80)b 0.04
3 month 120 (64) 97 (61) 120 (78) 0.33
6 month 112 (78) 105 (58) 116 (78) 0.88
Note: Summary data are raw scores and significant differences are indicated inbold. N = 107 (Control group, n = 34, Moderate group, n = 37, Extensive group, n = 36). Values with the same superscript were significantly different on post-hoc analysis. TV = television.
doi:10.1371/journal.pone.0126665.t002
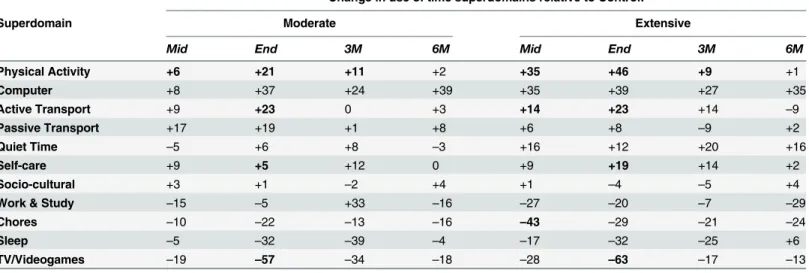
Table 3. Changes in time (min/d) spent in the 11 superdomains in the Moderate and Extensive groups relative to the Control group at mid-program, end-program, and 3 and 6 months follow-up.
Change in use of time superdomains relative to Control:
Superdomain Moderate Extensive
Mid End 3M 6M Mid End 3M 6M
Physical Activity +6 +21 +11 +2 +35 +46 +9 +1
Computer +8 +37 +24 +39 +35 +39 +27 +35
Active Transport +9 +23 0 +3 +14 +23 +14 –9
Passive Transport +17 +19 +1 +8 +6 +8 –9 +2
Quiet Time –5 +6 +8 –3 +16 +12 +20 +16
Self-care +9 +5 +12 0 +9 +19 +14 +2
Socio-cultural +3 +1 –2 +4 +1 –4 –5 +4
Work & Study –15 –5 +33 –16 –27 –20 –7 –29
Chores –10 –22 –13 –16 –43 –29 –21 –24
Sleep –5 –32 –39 –4 –17 –32 –25 +6
TV/Videogames –19 –57 –34 –18 –28 –63 –17 –13
Note: 3M = 3 months, 6M = 6 months. Significant differences according toTable 2are shown in bold.
Fig 2. Changes in time from baseline to 6-month follow in the Moderate (top panel) and Extensive (bottom panel) groups, relative to Controls.Note: AT = Active Transport, PA = Physical Activity, TV/ VG = Television/Videogames.
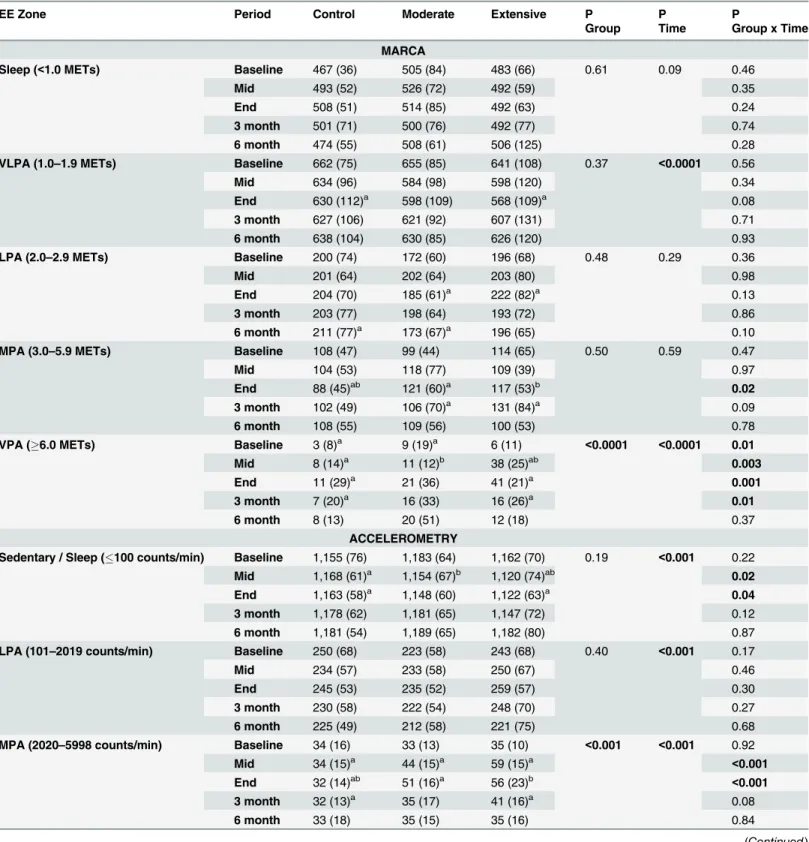
Table 4. Mean (SD) time (min/d) spent in each energy expenditure zone by each of the groups at each time point according to MARCA and accel-erometry, and P-values for main effects of Group and Time, and Group x Time interactions.
EE Zone Period Control Moderate Extensive P P P
Group Time Group x Time
MARCA
Sleep (<1.0 METs) Baseline 467 (36) 505 (84) 483 (66) 0.61 0.09 0.46
Mid 493 (52) 526 (72) 492 (59) 0.35
End 508 (51) 514 (85) 492 (63) 0.24
3 month 501 (71) 500 (76) 492 (77) 0.74
6 month 474 (55) 508 (61) 506 (125) 0.28
VLPA (1.0–1.9 METs) Baseline 662 (75) 655 (85) 641 (108) 0.37 <0.0001 0.56
Mid 634 (96) 584 (98) 598 (120) 0.34
End 630 (112)a 598 (109) 568 (109)a 0.08
3 month 627 (106) 621 (92) 607 (131) 0.71
6 month 638 (104) 630 (85) 626 (120) 0.93
LPA (2.0–2.9 METs) Baseline 200 (74) 172 (60) 196 (68) 0.48 0.29 0.36
Mid 201 (64) 202 (64) 203 (80) 0.98
End 204 (70) 185 (61)a 222 (82)a 0.13
3 month 203 (77) 198 (64) 193 (72) 0.86
6 month 211 (77)a 173 (67)a 196 (65) 0.10
MPA (3.0–5.9 METs) Baseline 108 (47) 99 (44) 114 (65) 0.50 0.59 0.47
Mid 104 (53) 118 (77) 109 (39) 0.97
End 88 (45)ab 121 (60)a 117 (53)b 0.02
3 month 102 (49) 106 (70)a 131 (84)a 0.09
6 month 108 (55) 109 (56) 100 (53) 0.78
VPA (6.0 METs) Baseline 3 (8)a 9 (19)a 6 (11)
<0.0001 <0.0001 0.01
Mid 8 (14)a 11 (12)b 38 (25)ab 0.003
End 11 (29)a 21 (36) 41 (21)a 0.001
3 month 7 (20)a 16 (33) 16 (26)a 0.01
6 month 8 (13) 20 (51) 12 (18) 0.37
ACCELEROMETRY
Sedentary / Sleep (100 counts/min) Baseline 1,155 (76) 1,183 (64) 1,162 (70) 0.19 <0.001 0.22
Mid 1,168 (61)a 1,154 (67)b 1,120 (74)ab 0.02
End 1,163 (58)a 1,148 (60) 1,122 (63)a 0.04
3 month 1,178 (62) 1,181 (65) 1,147 (72) 0.12
6 month 1,181 (54) 1,189 (65) 1,182 (80) 0.87
LPA (101–2019 counts/min) Baseline 250 (68) 223 (58) 243 (68) 0.40 <0.001 0.17
Mid 234 (57) 233 (58) 250 (67) 0.46
End 245 (53) 235 (52) 259 (57) 0.30
3 month 230 (58) 222 (54) 248 (70) 0.27
6 month 225 (49) 212 (58) 221 (75) 0.68
MPA (2020–5998 counts/min) Baseline 34 (16) 33 (13) 35 (10) <0.001 <0.001 0.92
Mid 34 (15)a 44 (15)a 59 (15)a <0.001
End 32 (14)ab 51 (16)a 56 (23)b
<0.001
3 month 32 (13)a 35 (17) 41 (16)a 0.08
6 month 33 (18) 35 (15) 35 (16) 0.84
exclusive energy expenditure zones was restructured. Changes during the intervention are ex-amined in more detail in our previous work [1].
At the end of the intervention, relative to baseline and Controls, participants in the Moderate and Extensive group were participating in an additional 147 and 322 minutes of physical activity per week according to MARCA estimates. This is largely commensurate with the prescribed physical activity program of an additional 150 and 300 minutes per week. The main finding of this study was that following this imposed physical activity pro-gram, both time spent in major domains of time use and time spent in energy expenditure zones largely returned to pre-program levels within 20 weeks after the end of the program. All significant changes found during the intervention were no longer significant at 6-month follow up, with the exception of time spent in vigorous physical activity (when measured by accelerometry), which remained statistically elevated, albeit small in magnitude (0.9–1.3 Table 4. (Continued)
EE Zone Period Control Moderate Extensive P P P
Group Time Group x Time
VPA (5999 counts/min) Baseline 0.8 (2.1) 0.8 (1.9) 0.7 (1.7) <0.001 <0.001 0.84
Mid 0.7 (1.0)ab 4.0 (5.4)a 5.1 (6.6)b
<0.001
End 0.5 (0.9)ab 3.9 (5.4)a 3.3 (4.9)b <0.001
3 month 0.4 (0.7)ab 1.5 (2.1)a 1.9 (3.0)b
<0.001
6 month 0.7 (2.5)ab 2.0 (4.7)a 1.5 (4.0)b 0.01
Note: Summary data are raw scores and significant differences are indicated inbold. MARCA; N = 107 (Control group, n = 34, Moderate group, n = 37, Extensive group, n = 36). Accelerometry; N = 95 (Control group, n = 28, Moderate group, n = 35, Extensive group, n = 32). Average number of monitored days for included accelerometry data are baseline−6.9±0.5 days, mid−6.8±0.8 days, end−6.6±1.5 days, 3 month−6.6±1.4 days, 6 month−6.7±1.1
days. Values with the same superscript were significantly different on post-hoc analysis. EE = energy expenditure, METs = metabolic equivalents, VLPA = very light physical activity, LPA = light physical activity, MPA = moderate physical activity, VPA = vigorous physical activity.
doi:10.1371/journal.pone.0126665.t004
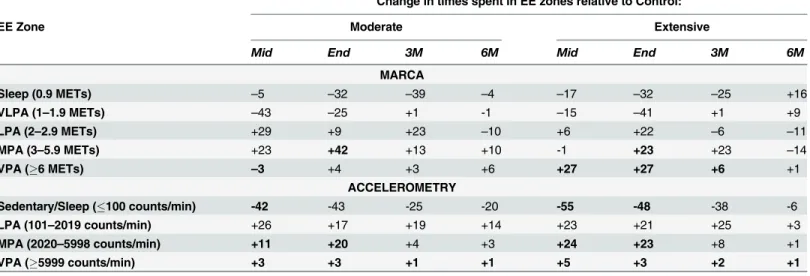
Table 5. Changes in time (min/d) spent in energy expenditure zones in the Moderate and Extensive groups relative to the Control group at mid-pro-gram, end-program and 3- and 6-month follow up according to the MARCA and accelerometry.
Change in times spent in EE zones relative to Control:
EE Zone Moderate Extensive
Mid End 3M 6M Mid End 3M 6M
MARCA
Sleep (0.9 METs) –5 –32 –39 –4 –17 –32 –25 +16
VLPA (1–1.9 METs) –43 –25 +1 -1 –15 –41 +1 +9
LPA (2–2.9 METs) +29 +9 +23 –10 +6 +22 –6 –11
MPA (3–5.9 METs) +23 +42 +13 +10 -1 +23 +23 –14
VPA (6 METs) –3 +4 +3 +6 +27 +27 +6 +1
ACCELEROMETRY
Sedentary/Sleep (100 counts/min) -42 -43 -25 -20 -55 -48 -38 -6
LPA (101–2019 counts/min) +26 +17 +19 +14 +23 +21 +25 +3
MPA (2020–5998 counts/min) +11 +20 +4 +3 +24 +23 +8 +1
VPA (5999 counts/min) +3 +3 +1 +1 +5 +3 +2 +1
Note: 3M = 3 months, 6M = 6 months. Significant differences according toTable 4are shown in bold. EE = energy expenditure, METs = metabolic equivalents, VLPA = very light physical activity, LPA = light physical activity, MPA = moderate physical activity, VPA = vigorous physical activity.
min/d), in both intervention groups, compared to controls. The results of this study demon-strate a strong pattern of recidivism and confirm previous research that maintaining physical activity participation following a structured, group-based physical activity program is chal-lenging [2,26].
Fig 3. Changes in time (min/d) relative to Controls, from baseline to 6 months follow-up in time spent by the Moderate (left panel) and Extensive (right panel) groups in the different energy expenditure zones according to MARCA recalls (panel A) and accelerometry (Panel B).Note: SED/ SLEEP = sedentary/sleep, VLPA = very light physical activity, LPA = light physical activity, MPA = moderate physical activity, VPA = vigorous
physical activity.
Implications
Possible explanations of time shifts. While recidivism is a well-known phenomenon among people undertaking physical activity programs, this study shows similar“recidivist” pat-terns in aspects of time use other than physical activity. These results raise the possibility that physical activity recidivism in interventions could be driven by the activities that have been dis-placed. Time use literature commonly divides time into obligatory time (time spent in paid and unpaid labour and personal care, such as sleeping, grooming and eating) and discretionary time (the time remaining after obligatory time has been accounted for) [27]. The results of the current study suggest that time for a new physical activity program is drawn from discretionary time, for example television viewing. It is surprising, however, to also identify a trend for a rela-tive Sleep reduction in the intervention groups, as Sleep is an activity that is not classically con-sidered as discretionary.
Large, albeit non-significant, shifts in Sleep were demonstrated in both the Moderate and Extensive groups, resulting in Sleep deficits of -39 and -32 min/d, relative to Controls. While these changes are largely driven by changes in the Control group (+46 min/d in Sleep at end in-tervention) with small absolute changes in Sleep in the intervention groups, this does not nec-essarily entail that there is not a sleep deficit, as sleep requirements can, and probably do, change across the year. This finding is also supported by subgroup analyses which revealed that intervention participants who complied with at least 70% of the physical activity program slept approximately 40 min/day less than non-compliers (p<0.01) (S1 Table).
The sustainability of decreasing time spent in obligatory activities is not well understood. Chronic reduction in sleep duration has been coined a‘sleep debt’that in the short term, can be tolerated, but in the longer term is accounted for by making up lost time [28]. These‘time debts’could also be incurred in other areas, such as television viewing. While typically consid-ered discretionary time, individuals may need a certain amount of relaxation time, which they may accumulate through television viewing time [29]. There is a possibility that reversing the accumulated‘time debt’, is what drives the return to baseline after an imposed stimulus and that addressing this drift back to baseline behaviours could be explored in future studies.
The specificity of the return to baseline levels, in most variables within 20 min/d, may also suggest a habitual preference for time use. One possible explanation is that the intervention was not a sufficient stimulus to overcome existing behavioural habits and to integrate habitual physical activity. Starting a new exercise program results in physical activity that is intentional and goal directed. However, individuals who engage in regular physical activity often exhibit habitual responses, where physical activity is triggered by precursory environmental stimuli rather than an expectant outcome [30]. Over time, this transition of action to habit is reflective of neurobiological plasticity [31]. Evidence suggests that the time for a behaviour to transition to habit is highly variable by individual, the complexity of the behaviour and the circumstances in which the behaviour is being adopted [32]. Perhaps an intervention with different parame-ters, such as longer length (>6 weeks) [32], would allow for the transition of changes in
For example, in the current study, the significant increase in active transport was not associ-ated with a subsequent decrease in passive transport in the intervention groups. Therefore, it is likely that active transport took the form of extra trips for the physical activity program. If ac-tive transport had instead displaced passive transport (e.g. commuting to work by bicycle), this may be more sustainable over time than simply adding in active transport for the duration of the intervention. To conceptualise and educate about patterns of change, it is important that in future physical activity interventions, all aspects of time use are measured, not just the activity of interest.
Additionally, while there was a downward trend in the time dedicated to active transport and physical activity at three months, changes in Physical Activity remained statistically elevat-ed relative to Controls. Future physical activity intervention research may therefore consider small‘booster shots’or‘prompts’of physical activity at approximately three monthly intervals. Booster shots of activity may be more effective in nudging individuals’baseline physical activity levels into‘sufficiently active’ranges where health benefits can be attained [33].
Strengths and limitations
There are very few studies which comprehensively track time use changes across a physical activity intervention. This study used a validated, reliable, high-resolution 24-hour recall exhaustively covering all activity domains. Use of time was assessed before, during and after the physical activity program and a randomised controlled trial design was employed, allow-ing us to filter out changes in use of time due to seasonal, maturational and environmental effects [34].
Nevertheless, this study had a number of limitations. It used a sample of convenience. The study sample was predominantly female, well educated, generally in full employment and were relatively active at baseline. Completers were significantly older than non-completers and the results cannot necessarily be generalised to other groups with different time commit-ments and constraints. It is also important to emphasise that use of time among the Control group varied a great deal across the study period, and the difference reported here are relative to the Control group. Self-report data may also be subject to social desirability bias and recall errors, though the constraint of having to account for all 24 hours in the day minimises these risks. Furthermore, the strong agreement between MARCA-estimated changes in time use and changes calculated from accelerometry data (Fig 2) supports the validity of the self-report measure.
The participants all exceeded the recommended levels of MVPA at baseline (>150 min/
wk) according to both MARCA and accelerometry estimates, therefore exceeding the inclu-sion criteria for this study, in spite of prior screening using the Active Australia instrument. There are three explanations for this, (1) the Active Australia questionnaire underestimates MVPA compared to other physical activity measures, (2) the participants could have changed their activity levels between screening and formal enrolment in the study and (3) that some participants intentionally underreported their MVPA during screening to be included in the study. We are unable to determine which explanation is most likely but this may have limited the initial compliance with the physical activity program, and limits the generalisability of the findings.
Conclusion
While the current study demonstrated that physical activity can be increased in previouslyse-dentary adults, it also confirms previous research that these are often temporary changes.
Translating these temporary changes into long-term physical activity participation contin-ues to be a challenge for physical activity research. While a six-week imposed physical activity program generated shifts in time use and energy expenditure, time use patterns returned to baseline within 20 weeks of the end of the program. Examining how time budgets are rear-ranged following an physical activity intervention is a novel method and has highlighted that physical activity must be considered in the context of other aspects of time use, which may have their own rhythms and pressures. In designing and determining the effectiveness of physi-cal interventions, it is therefore important to consider the whole profile of time use, rather than focusing on individual activities.
Supporting Information
S1 Protocol. Study protocol. (PDF)S1 Checklist. CONSORT checklist. (PDF)
S1 Table. Time (min/day) spent in each time use superdomain in low compliers compared with high compliers, measured by the MARCA.Note: Summary data are raw scores and sig-nificant differences are indicated in bold. Sample includes intervention participants only sub-divided into low compliers (attended<70% of prescribed physical activity program) and high
compliers (attended70% of prescribed physical activity program). N = 73 (Low compliers, n = 37, High compliers n = 36). SD = standard deviation, TV = television.
(PDF)
S1 Dataset. Manuscript data. (XLSX)
Acknowledgments
The authors would like to thank and acknowledge the late John Petkov who provided statistical expertise for the preparation of this paper.
Author Contributions
Conceived and designed the experiments: TO CM AR SG CE. Performed the experiments: SG. Analyzed the data: SG TO AR. Wrote the paper: SG TO CM CE AR.
References
1. Gomersall S, Norton K, Maher C, English C, Olds T. In search of lost time: when people undertake a new exercise program, where does the time come from? A randomized controlled trial. J Sci Med Sport. 2015; 18(1):43–8. doi:10.1016/j.jsams.2014.01.004PMID:24602689
2. Seefeldt V, Malina RM, Clark MA. Factors affecting levels of physical activity in adults. Sports Med. 2002; 32(3):143–68. PMID:11839079
4. Conroy M, Sward K, Spadaro K, Tudorascu D, Karpov I, Jones B, et al. Effectiveness of a physical ac-tivity and weight loss intervention for middle-aged women: healthy bodies, healthy hearts randomized trial. J Gen Intern Med. 2014:1–7. doi:10.1007/s11606-014-3077-5PMID:24737224
5. Healy GN, Matthews CE, Dunstan DW, Winkler EAH, Owen N. Sedentary time and cardio-metabolic biomarkers in US adults: NHANES 2003–06. Eur Heart J. 2011; 32(5):590–7. doi:10.1093/eurheartj/ ehq451PMID:21224291
6. Veerman JL, Healy GN, Cobiac LJ, Vos T, Winkler EAH, Owen N, et al. Television viewing time and re-duced life expectancy: a life table analysis. Br J Sports Med. 2011; 46(13):927–30. doi:10.1136/bjsm. 2011.085662PMID:23007179
7. Cappuccio FP, Taggart FM, Kandala NB, Currie A, Peile E, Stranges S, et al. Meta-analysis of short sleep duration and obesity in children and adults. Sleep. 2008; 31(5):619–26. PMID:18517032
8. Tsuno N, Besset A, Ritchie K. Sleep and depression. J Clin Psychiatry. 2005; 66(10):1254–69. PMID: 16259539
9. Rowland TW. The biological basis of physical activity. Med Sci Sports Exerc. 1998; 30(3):392–9. PMID: 9526885
10. Gomersall S, Maher CN, K., Dollman J, Tomkinson G, Esterman A, English C, et al. Testing the activity-stat hypothesis: a randomised controlled trial protocol. BMC Public Health. 2012; 12:851. doi:10.1186/ 1471-2458-12-851PMID:23043381
11. Moher D, Hopewell S, Schulz KF, Montori V, Gøtzsche PC, Devereaux PJ, et al. CONSORT 2010
Ex-planation and Elaboration: updated guidelines for reporting parallel group randomised trials. Br Med J. 2010; 340:c869. doi:10.1136/bmj.c869PMID:20332511
12. Australian Institute for Health and Welfare. The Active Australia survey: a guide and manual for imple-mentation, analysis and reporting Canberra, Australia: Australian Institute for Health and Welfare; 2003 [14 January 2011]. Available:http://www.aihw.gov.au/publication-detail/?id=6442467449.
13. Sports Medicine Australia. Sports Medicine Australia pre-exercise screening system: Sports Medicine Australia; 2009 [cited 2012 18 July]. Available from:http://www.sma.org.au/wpcontent/uploads/2009/ 05/new_pre_screening.pdf.
14. Norton L, Norton K, Lewis N, Dollman J. A comparison of two short-term intensive physical activity inter-ventions: methodological considerations. International Journal of Behavioral Nutrition and Physical Ac-tivity. 2011; 8:133. doi:10.1186/1479-5868-8-133PMID:22136578
15. Ridley K, Olds TS, Hill A. The multimedia activity recall for children and adolescents (MARCA): devel-opment and evaluation. International Journal of Behavioral Nutrition and Physical Activity. 2006; 3:10. doi:10.1186/1479-5868-3-10PMID:16725055
16. Gomersall SR, Olds TS, Ridley K. Development and evaluation of an adult use-of-time instrument with an energy expenditure focus. J Sci Med Sport. 2011; 14(2):143–8. doi:10.1016/j.jsams.2010.08.006 PMID:20932797
17. Ainsworth BE, Haskell WL, Whitt MC, Irwin ML, Swartz AM, Strath SJ, et al. Compendium of physical activities: an update of activity codes and MET intensities Med Sci Sports Exerc. 2000; 32(9):S498–
S516. PMID:10993420
18. Ainsworth BE, Haskell WL, Herrmann SD, Meckes N, Bassett DRJ, Tudor-Locke C, et al. Compendium of physical activities: a second update of codes and MET values. Med Sci Sports Exerc. 2011; 43 (8):1575–81. doi:10.1249/MSS.0b013e31821ece12PMID:21681120
19. Foley L, Maddison R, Rush E, Olds T, Ridley K, Jiang Y. Doubly labeled water validation of a computer-ized use of time recall in active young people. Metabolism. 2013; 62(1):163–9. doi:10.1016/j.metabol. 2012.07.021PMID:22980224
20. Santos-Lozano A, Marín PJ, Torres-Luque G, Ruiz JR, Lucía A, Garatachea N. Technical variablity of the GT3X accelerometer Med Eng Phys. 2012; 34:787–90. doi:10.1016/j.medengphy.2012.02.005 PMID:22417978
21. Brage S, Wedderkopp N, Franks PW, Andersen LB, Froberg K. Re-examination of validity and reliability of the CSA monitor in walking and runnin. Med Sci Sports Exerc. 2003; 35(8):1447–54 PMID:
12900703
22. Swartz AM, Strath SJ, Bassett DR, O’Brien WL, King GA, Ainsworth BE. Estimation of energy expendi-ture using CSA accelerometers at hip and wrist sites. Med Sci Sports Exerc. 2000; 39(9):S450–S6.
23. Abel M, Hannon J, Sell K, Lillie T, Conlin G, Anderson D. Validation of the Kenz Lifecorder EX and Acti-Graph GT1M accelerometers for walking and running in adults. Applied Physiology, Nutrition and Me-tabolism. 2008; 33(6):1155–64. doi:10.1139/h08-103PMID:19088773
25. Troiano R, Berrigan D, Dodd KW, Mâsse LC, Tilert T, McDowell M. Physical activity in the United States measured by accelerometer. Med Sci Sports Exerc. 2008; 40(1):181–8. PMID:18091006
26. Foster C, Hillsdon M, Thorogood M. Interventions for promoting physical activity (review). Cochrane Database of Systematic Reviews. 2005; 1. Art No.: CD003180. doi:10.1002/14651858.CD003180. pub2PMID:15674903
27. Goodin RE, Rice J.M., Bittman M, Saunders P. The time-pressure illusion: Discretionary time versus free time. New South Wales, Australia: The Social Policy Research Centre, University of New South Wales, 2002.
28. Van Dongen HPA, Rogers NL, Dinges DF. Sleep debt: Theoretical and empirical issues. Sleep and Bio-logical Rhythms. 2003; 1:5–13.
29. Weaver JB III. Individual differences in television viewing. Personality and Individual Differences. 2003; 35:1427–37.
30. Aarts H, Paulussen T, Schaalma H. Physical exercise habit: on the conceptualisation and formation of habitual health behaviours. Health Educ Res. 1997; 12(3):363–74. PMID:10174219
31. Yin HH, Knowlton BJ. The role of the basal ganglia in habit formation. Nature Reviews Neuroscience. 2006; 7:464–76. PMID:16715055
32. Lally P, Van Jaarsveld CHM, Potts HWW, Wardle J. How are habits formed: modelling habit formation in the real world. European Journal of Social Psychology. 2010; 40:998–1009.
33. Fjeldsoe B, Neuhaus M, Winkler E, Eakin EG. Systematic review of maintenance of behaviour change following physical activity and dietary interventions. Health Psychol. 2011; 30(1):99–109. doi:10.1037/ a0021974PMID:21299298
34. Gomersall S, Rowlands A, English C, Maher C, Olds T. The ActivityStat hypothesis: the concept, the evidence, and the methodologies. Sports Med. 2012; 43(2):135–49.