BGD
5, 1795–1823, 2008Paleovegetation reconstruction using
δ13C of SOM
G. Wang et al.
Title Page
Abstract Introduction
Conclusions References
Tables Figures
◭ ◮
◭ ◮
Back Close
Full Screen / Esc
Printer-friendly Version
Interactive Discussion Biogeosciences Discuss., 5, 1795–1823, 2008
www.biogeosciences-discuss.net/5/1795/2008/ © Author(s) 2008. This work is distributed under the Creative Commons Attribution 3.0 License.
Biogeosciences Discussions
Biogeosciences Discussionsis the access reviewed discussion forum ofBiogeosciences
Paleovegetation reconstruction using
δ
13
C of Soil Organic Matter
G. Wang1, X. Feng2, J. Han3, L. Zhou4, W. Tan1, and F. Su1
1
Key Laboratory of Plant-Soil Interactions, Ministry of Education, College of Resources and Environment, China Agricultural University, Beijing 100094, China
2
Department of Earth Sciences, Dartmouth College, Hanover, NH, USA 3
Institute of Geology and Geophysics, Chinese Academy of Sciences, Beijing 100029, China 4
College of Environmental Sciences, MOE Laboratory for Earth Surface Processes, Peking University, Beijing 100871, China
Received: 28 February 2008 – Accepted: 12 March 2008 – Published: 18 April 2008
Correspondence to: G. Wang ([email protected])
BGD
5, 1795–1823, 2008Paleovegetation reconstruction using
δ13C of SOM
G. Wang et al.
Title Page
Abstract Introduction
Conclusions References
Tables Figures
◭ ◮
◭ ◮
Back Close
Full Screen / Esc
Printer-friendly Version
Interactive Discussion Abstract
The relative contributions of C3 and C4plants to vegetation at a given locality may be
estimated by means ofδ13C of soil organic matter. This approach holds great potential for paleoecological reconstruction using paleosols. However, two uncertainties exist, which limits the accuracy of this application. One is13C enrichment as plant carbon
5
becomes incorporated into soil organic matter. The other is due to environmental influ-ences onδ13C of plants. Two types of data were collected and analyzed with an ob-jective of narrowing the error of paleovegetation reconstruction. First, we investigated
δ13C variations of 557 C3 and 136 C4 plants along a precipitation gradient in North
China. A strong negative relationship is found between theδ13C value of C3plants
av-10
eraged for each site and the annual precipitation with a coefficient of−0.40‰/100 mm,
while no significant coefficients were found for C4plants. Second, we measuredδ 13
C of soil organic matters for 14 soil profiles at three sites. The isotopic difference be-tween vegetation and soil organic matter are evaluated to be 1.8‰ for the surface soil and 2.8‰ for the soil at the bottom of soil profiles. Using the new data we conducted
15
a sample reconstruction of paleovegetation at the central Chinese Loess Plateau dur-ing the Holocene and the Last Glaciation, and conclude that, without corrections for
13
C enrichment by decomposition, the C4 abundance would be overestimated. The
importance and uncertainties of other corrections are also discussed.
1 Introduction
20
Carbon isotopic ratios of soil organic matter (δ13CSOM) are close to that of the
vegeta-tion, and thusδ13CSOM can be used to estimate the relative abundance of C3 and C4 biomass in the vegetation at a given locality in the past. Many researchers have used
δ13CSOM of paleosols and/or loess to reconstruct paleovegetation and paleoclimate
(e.g. Stanley et al., 1991; Boutton, 1996; Boutton et al., 1998; Guillaume et al., 2001;
25
BGD
5, 1795–1823, 2008Paleovegetation reconstruction using
δ13C of SOM
G. Wang et al.
Title Page
Abstract Introduction
Conclusions References
Tables Figures
◭ ◮
◭ ◮
Back Close
Full Screen / Esc
Printer-friendly Version
Interactive Discussion Follmer, 1998; Lin et al., 1991; Ding and Yang, 2000; Vidic and Monta ˜nez, 2004; Liu et
al., 2005; An et al., 2005). These reconstructions use isotope mass-balance equations of the following:
C3(%)=(δ13CSOM−δ13CC4)/(δ13CC3−δ13CC4)×100; (1)
C4(%)=100−C3(%) (2)
5
where δ13CC
3, δ
13
CC
4 are the mean δ
13
C values of C3 and C4 plants at a given locality at the time the soil under study was developed; C3(%) and C4(%) are
percent-ages of C3and C4biomass in the local vegetation. The accuracy of the reconstruction
depends upon the accuracy of the knowledge on the end member values of δ13CC
3
andδ13CC4. The use of these equations also assumes thatδ 13
CSOM represents the
10
δ13C value of bulk local vegetation.
To acquire the δ13C values for the pure C3 and C4 plants at the time paleosols
formed, isotopic values for modern plants are first obtained. However, modern plants may be isotopically different from ancient plants due to environmental changes, such as variations in theδ13C and concentration of the atmospheric CO2, and in the amount
15
of annual precipitation (e.g. Farquhar et al., 1982; K ¨orner et al., 1988). Attempts have been made by several authors to correct the effects of these environmental factors before Eqs. (1) and (2) were applied (Liu et al., 2005; Chen et al., 2005).
Anther source of uncertainty comes from the assumption thatδ13CSOM equals the
δ13C of vegetation. It is known that isotopic enrichment occurs during decomposition
20
such that the soil organic matter tends to have higherδ13C values than the vegetation (Troughton et al., 1974; Stout et al.,1975; Schleser and Pohling, 1980; Balesdent et al., 1993; Boutton, 1996; Bird and Pousal, 1997). To our knowledge, this effect has not been taken into consideration when Eqs. (1) and (2) are used for paleovegetation reconstruction. It has been argued that using specific biomarkers, such as n-alkanes,
25
BGD
5, 1795–1823, 2008Paleovegetation reconstruction using
δ13C of SOM
G. Wang et al.
Title Page
Abstract Introduction
Conclusions References
Tables Figures
◭ ◮
◭ ◮
Back Close
Full Screen / Esc
Printer-friendly Version
Interactive Discussion but yet to be demonstrated, it is certain that isotopic enrichment in the bulk soil organic
matter relatively to the vegetation due to decomposition should be corrected.
This paper evaluates various corrections described above for paleovegetation re-constructions. We particularly focus on the precipitation effect onδ13C in both C3and
C4 plants, and the 13C enrichment of soil organic matter relative to vegetation due to
5
decomposition. We have collected new data for quantifying these two effects.
New data is necessary because the existing data do not yield certain sensitivities for these two effects. Many studies have observed that δ13C of C3 plants decreases significantly with increases in precipitation (e.g. Ehleringer and Cooper, 1988; Smedly et al., 1991; Wang et al., 2003, 2005; Schulze et al., 2006). Liu et al. (2005) measured
10
δ13C of three C3species occurring in Northwest China, and found that the meanδ13C decrease is 1.1‰ with every 100 mm increase in annual precipitation. This sensitiv-ity is much greater than that reported by Steward et al. (1995) (−0.34‰/100 mm) and
Wang et al. (2003) (−0.49‰/100 mm). Relative to C3 plants, theδ 13
C of C4 plants is not sensitive to water availability (Farquhar et al., 1982; Henderson et al., 1992; Wang
15
et al., 2005, 2006). Studies on C4 species mostly showed slight increases in δ 13
C with increasing water availability (Buchmann et al., 1996; Schulze et al., 1996; Wang et al., 2005, 2006). However, Liu et al. (2005) observed an opposite pattern in Bothri-ochloa ischaemum(C4), i.e.,δ
13
C decreasing significantly with increasing precipitation (−0.61‰/100 mm). Our study includes an intensive investigation on the plants’ δ13C
20
response to precipitation in an arid and semiarid region by averaging a large number of species in 33 sites in North China with annual precipitation ranging from 15 to 650 mm. The13C enrichment in soil organic matter has been observed in both field and lab-oratory investigations. Some observations have come from field or lablab-oratory incu-bation experiments (e.g. Natelhoffer and Fry, 1988; Wedin et al., 1995; Fernandez et
25
BGD
5, 1795–1823, 2008Paleovegetation reconstruction using
δ13C of SOM
G. Wang et al.
Title Page
Abstract Introduction
Conclusions References
Tables Figures
◭ ◮
◭ ◮
Back Close
Full Screen / Esc
Printer-friendly Version
Interactive Discussion the early stage of decomposition. In fact, progressive13C enrichment continues even
during decomposition of resistant soil organic matter having slow turnover rates (Chen et al., 2002; Feng et al., 1999; Torn et al., 2002). Other observations have come from isotopic measurements of soil profiles (e.g. Stout et al., 1978; Dzurec et al., 1985; Gre-gorich et al., 1995; Balesdent et al., 1993; Boutton, 1996; Bowman et al., 2002). Most
5
of such studies aimed to understand vegetation dynamics, and thus study sites were chosen in areas where C3/ C4ratios in local vegetation have not been constant in the
past (e.g. Dzurec et al., 1985; Schwartz et al., 1986; Boutton et al., 1998; Guillaume et al., 2001; Krull et al., 2005). As a result, the observedδ13C differences between soil or-ganic matter and surface standing vegetation included not only the isotopic enrichment
10
during organic matter decomposition, but also changes of the C3/C4 ratio in the local
vegetation. To quantify isotopic enrichment in soil organic matter, we studied isotopic variations in 14 soil profiles at three sites. All three sites are undisturbed, and have C3only vegetations; they are chosen especially because we intended to avoid isotopic
variations in soil organic matter due to changing abundance of C3and C4 plant types.
15
We then evaluate how various corrections affect the paleovegetation reconstruction for Chinese Loess Plateau.
2 Study sites and methods
2.1 Study sites of plant sampling and plant collection
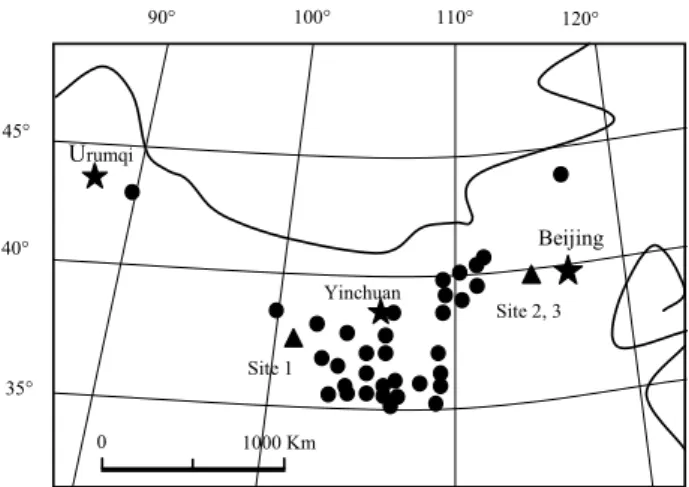
A total of 33 sites in North China were studied, among which 27 sites are in Northwest
20
China (Fig. 1). From west to east, North China is characterized by temperate arid, semiarid and semi-humid climate. The dominant control over the precipitation amount is the strength of the East Asian summer monsoon system. The precipitation occurs mostly in the summer season (from May to September), which accounts for approxi-mately 68% to 87% of the total annual precipitation. From southeast to northwest in the
25
BGD
5, 1795–1823, 2008Paleovegetation reconstruction using
δ13C of SOM
G. Wang et al.
Title Page
Abstract Introduction
Conclusions References
Tables Figures
◭ ◮
◭ ◮
Back Close
Full Screen / Esc
Printer-friendly Version
Interactive Discussion is dominated by shrubs and herbs.
Plants were sampled in August of 1998 to 2005. In order to minimize the influences attributed to human disturbance, local water supply, light regime or location within the canopy, sampling was restricted to unshaded sites far from human habitats. All the species collected were those having high abundance in the community or those widely
5
occurring in North China At each site, 5–7 plants of each species of interest were identified, and the uppermost and the second fully opened leaves of each individual were obtained. The leaves from each species at each site were mixed together into one sample. A total of 557 C3 samples (including 255 species) and 136 C4 samples
(including 43 species) were collected.
10
2.2 Study sites of soil sampling and soil collection
One of the three soil sampling sites (Site 1) is located at the northeastern part of the Qinghai-Tibetan Plateau in which the Chinese Academy of Sciences has a research station, Haibei Highland Frigid Meadow Ecosystem Experimental Station (101◦12′E, 37◦45′N; 3200 m a.s.l.). The other two sites (Sites 2 and 3) are in the Donglingshan
15
Mountain situated on the boundary between Beijing and Hebei Province in North China, approximately 130 km west of Beijing city (Fig. 1). These two sites are within Beijing Forest Ecosystem Research Station, which covers 16 000 ha of land, and was estab-lished on Donglingshan Mountain by the Chinese Academy of Sciences in 1990.
Site 1 has the characteristics of a highland continental climate, and is cold and
hu-20
mid with the mean annual temperature of −2.0◦C and the mean annual precipitation
of around 600 mm. Vegetation there is highland frigid meadow with most dominant species ofPotentilla fruticosa,Kobresia pygaeaandKobresia humilis. There are no C4
species. Soil type is alpine meadow soil. The area of Sites 2 and 3 is characterized by temperate semimoist climate. The amount of annual precipitation is 611.9 mm and
25
Dongling-BGD
5, 1795–1823, 2008Paleovegetation reconstruction using
δ13C of SOM
G. Wang et al.
Title Page
Abstract Introduction
Conclusions References
Tables Figures
◭ ◮
◭ ◮
Back Close
Full Screen / Esc
Printer-friendly Version
Interactive Discussion shan Mountain at an elevation of 1600 m. The vegetation is a deciduous broad-leaved
forest with only one birch tree species,Betula platyphylla,having an average height of 5 m and an average canopy area of 10 m2. In addition, two C3grass species,Trullius
chinensis and Galium verum, with about 0.15 m and 0.10 m high, respectively, occur within birch stands. No C4species is present at this site. The site has a brown forest
5
soil. Site 3 is located on a ridge with an elevation of 1700 m, approximately 300 m southeast of Site 2. The vegetation at Site 3 is a subalpine meadow with Roegneria kamojiandArtemisia lavandulaefoliagrasses as dominant species. Except for few Se-taria viridis(C4) occurring on roadsides and neighbor of the climatic station, which is
also located at the ridge (1700 m a.s.l.), no C4 species exists elsewhere, particularly
10
no C4species at the sampling plots. Soil type is subalpine meadow soil. There is no human habitat within 20 km2of Site 2 and Site 3, mainly because of strong winds and low temperature for many days of each year. Grazing and cutting have been strictly prohibited in the area since 1980’s.
At Site 1, six 0.5 m×0.5 m plots were laid out within one of the enclosures in Haibei
15
Highland Frigid Meadow Ecosystem Experimental Station with Kobresia pygaea and
Kobresia humilis as dominant species. For each plot, all aboveground plants were
collected (and will be used as litter input to the soil), and then the soil profile was dug to the weathered rock (saprolite). Soil profiles were sampled at 5 cm intervals. The depths of the six soil profiles are 60 cm, 120 cm, 110 cm, 60 cm, 70 cm and 90 cm,
20
respectively.
At Site 2, five plots of 0.5 m×0.5 m were sampled in Betula platyphylla stands. In
order to avoid birch roots, all plots were chosen at 2–3 m away from tree trunks. At each plot, we first sampled the litter layer, and then dug a soil profile to the weathered rock. The depths of the five soil profiles are 75 cm, 105 cm, 100 cm, 100 cm and 120 cm,
25
respectively. All soil profiles were sampled at 5 cm intervals except for one that were sampled at 10 cm intervals.
At Site 3, three plots of 0.5 m×0.5 m were sampled in the same way as described for
BGD
5, 1795–1823, 2008Paleovegetation reconstruction using
δ13C of SOM
G. Wang et al.
Title Page
Abstract Introduction
Conclusions References
Tables Figures
◭ ◮
◭ ◮
Back Close
Full Screen / Esc
Printer-friendly Version
Interactive Discussion soils were sampled at 5 cm intervals.
2.3 Measurements
The plant and litter samples were oven-dried, and ground to 40 mesh. Soil samples were air-dried and sieved with a 2-mm sieve. Plant fragments and the soil fraction coarser than 2 mm were removed. The<2 mm soil fraction was treated with 1N HCl
5
at room temperature overnight to remove carbonates, after which it was washed and oven-dried at 70◦C. Carbon contents and carbon isotopic ratios of samples were deter-mined on an elemental analyzer coupled with a DeltaPlus XP mass spectrometer in a continuous flow mode. The13C to12C ratio of the sample is reported in theδ-notation as the relative difference in parts per thousand (per mil) from the PDB standard. The
10
repeatability of C contents is better than 0.1% (1σ) and that of δ13C is better than 0.15‰ (1σ).
3 Results
3.1 δ13C variations of C3and C4plants with annual precipitation
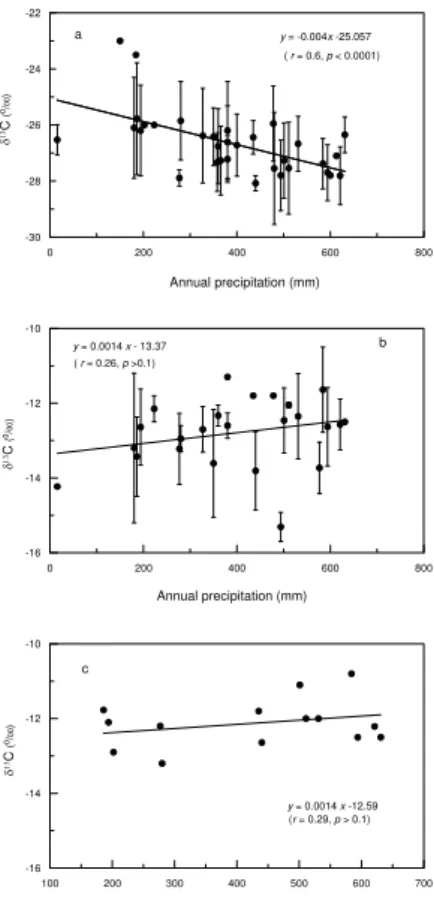
Values ofδ13C in C3 plants we measured range from−21.7‰ to−30‰ with a mean
15
value of −26.7‰ (n=557, s.d.=1.56), and those of C4 plants vary from −10.0‰ to −15.8‰ with a mean of−12.8‰ (n=136, s.d.=1.06).
Fig. 2a plots the site-averaged δ13C values for C3 plants as a function of
precip-itation, showing that δ13C increases significantly with decreasing precipitation with a slope of−0.004‰/mm (0.001 s.e., t-test, P <0.0001). C4 plant δ
13
C values display a
20
BGD
5, 1795–1823, 2008Paleovegetation reconstruction using
δ13C of SOM
G. Wang et al.
Title Page
Abstract Introduction
Conclusions References
Tables Figures
◭ ◮
◭ ◮
Back Close
Full Screen / Esc
Printer-friendly Version
Interactive Discussion also slightly increases with precipitation, with a slope of 0.001‰/mm (0.001 s.e.t-test,
P=0.321), but again the correlation is not significant (Fig. 2c).
3.2 Variations inδ13C in soil profiles
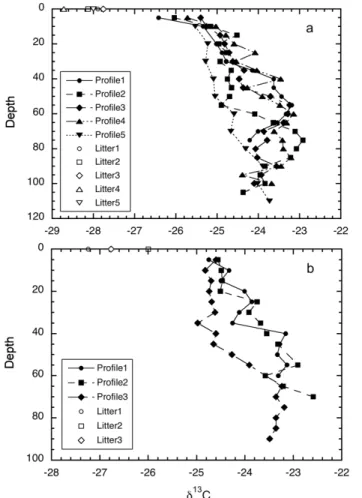
In soil, the carbon contents drop rapidly with depths near the surface, and then level offand slowly approach zero in deeper layers. All three sites share this characteristic
5
carbon distribution with depth. One example is given for Site 1 in Fig. 3a.
The carbon isotopic ratio in the soil organic matter at Site 1 increases with depth (Fig. 3b). Compared to the carbon contents (Fig. 3a), changes of δ13C with depth are more gradual. The isotopic enrichments with depth do not seem to approach a constant value within the depth of observation. Carbon isotope profiles in Site 2 and
10
Site 3 (Figs. 4a and 4b) also show the typical pattern of13C enrichment with depth. We are mostly interested in the isotopic difference between vegetation and soil or-ganic matter. Obviously, this difference depends upon which depth of soil is under discussion. When dealing with a paleosol, the specific paleo-soil horizon it is not al-ways clear. We, therefore, tabulated in Table 1 observed δ13C differences between
15
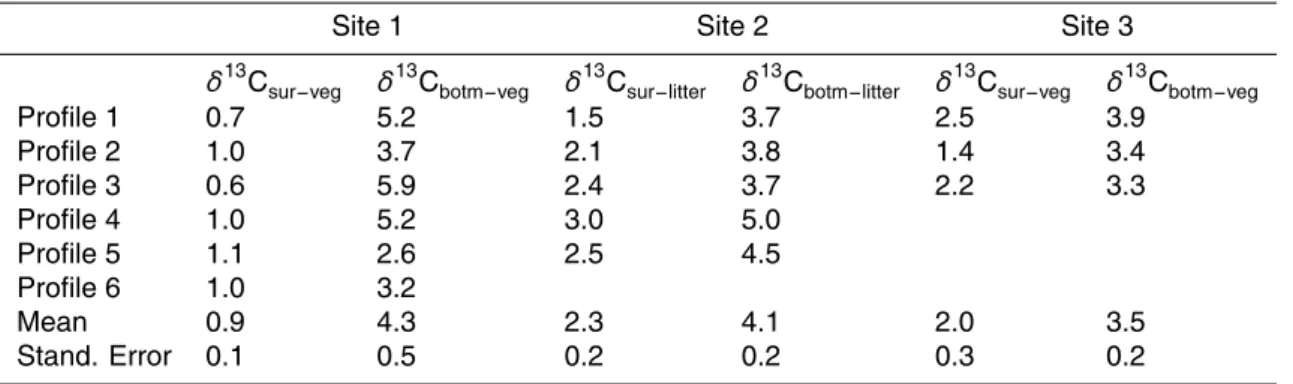
vegetation (Sites 1 and 3) or litter (Site 2) and the soil organic matter either near the surface (0∼5 cm of mineral soil) or at the bottom of soil profiles. Between the surface
soil and vegetation, theδ13C difference ranges from 0.6 to 2.5‰ (Sites 1 and 3), and between the bottom soil and vegetation, theδ13C difference ranges from 2.6 to 5.9‰. At the forested Site 2, theδ13C difference is 1.5–3.0‰ between the surface soil and
20
litter, and 3.7–5.0‰ between bottom soil and litter (Table 1). Typically, theδ13C of litter on the forest floor is about 0.5‰ higher than the foliage input (e.g. Stout et al., 1978; Dzurec et al., 1985; Gregorich et al., 1995; Balesdent et al., 1993; Wang, 2003). If this enrichment were taken in to account, theδ13C difference between soil and vegetation would be 2.0–3.5‰ for the surface soil and 4.2–5.5‰ for the bottom soil.
BGD
5, 1795–1823, 2008Paleovegetation reconstruction using
δ13C of SOM
G. Wang et al.
Title Page
Abstract Introduction
Conclusions References
Tables Figures
◭ ◮
◭ ◮
Back Close
Full Screen / Esc
Printer-friendly Version
Interactive Discussion 4 Discussion
4.1 δ13C variations of plants
For both C3and C4plants, water deficit usually causes plants to close stomatal pores to reduce water loss by transpiration, and thus the stomatal conductance (g) decreases. As a result, the ratio of intercellular to ambient CO2 concentration (ci/ca) decreases.
5
For C3 plants, a decrease inci/cadirectly results in an increase in its carbon isotopic ratio (Farquhar et al., 1982). Observations of C3 plant δ
13
C values decreasing along a precipitation gradient reported by this work and others (e.g. Steward et al., 1995; Wang et al., 2005; Liu et al., 2005; Schulze et al., 2006) are consistent with the expec-tation. For C4plants, a decrease in theci/caratio may lead to two opposite isotopic
re-10
sponses; theδ13C may increase or decrease depending on the degree of leakiness,φ
(Farquhar, 1983), the proportion of carbon dioxide produced within bundle sheath cells from C4acids that is not fixed by Rubisco but leaked back to mesophyll cells.
Accord-ing to the model developed by Farquhar (1983) (modified by Henderson et al., 1992), if theφvalue is less than 0.35, theδ13C of C4species decreases with decreasingci/ca
15
ratio; otherwise,δ13C increases. Theφparameter seems to remain relatively constant for a given species under a wide range of environmental conditions (e.g., temperature, moisture and light conditions). Henderson et al. (1992) found that theφvalues mea-sured in 10 C4 species, using a gas exchange method, remained around 0.21 over
a range of irradiance and leaf temperature. In this and other studies (Schulze et al.,
20
1996; Buchmann et al., 1996; Ghannoum et al., 2002; Wang et al., 2005),δ13C values of C4species were observed to decrease with increasing water stress, corresponding
toφvalues less than 0.35. Therefore for the observation onBothriochloa ischaemum
by Liu et al. (2005) where the plantδ13C significantly decreased with increasing annual precipitation amount, it is possible that theφvalue of this species is greater than 0.35.
25
Bothriochloa ischaemumseems to be a unique case, since it is the only C4 species
BGD
5, 1795–1823, 2008Paleovegetation reconstruction using
δ13C of SOM
G. Wang et al.
Title Page
Abstract Introduction
Conclusions References
Tables Figures
◭ ◮
◭ ◮
Back Close
Full Screen / Esc
Printer-friendly Version
Interactive Discussion 4.2 Variations inδ13C and carbon contents of soil organic matter
The soil profiles of carbon contents andδ13C show very different characteristics. The variations of carbon contents with depths are very similar within all profiles at Sites 1to 3 (Figs. 3a), which are similar to thousands of reported carbon distributions in soil profiles (Zinke et al., 1986; 1998). Typically, carbon contents decreases rapidly near the
5
surface, and then slowly at deeper soil. Judging from the carbon content profile alone it seems that little soil processes is occurring at depth. Compared to the carbon contents, the profile of soilδ13C also shows relatively rapid change near surface (although less than that of carbon contents), but the13C enrichment continues in deeper layers. This suggests that even slow decomposition of resistant organic matter is associated with
10
isotopic enrichment.
Several mechanisms have been proposed to account for 13C-enrichment of soil or-ganic matter relative to original plants. The first mechanism is the decrease in the
δ13C of atmospheric CO2since the industrial revolution because of combustion of13 C-depleted fossil fuels, and from the pre-industrial era to∼11 000 14C yr BP, theδ13C of
15
atmospheric CO2was relatively constant, with a mean of−6.40‰ (Marino et al., 1992).
This mechanism is responsible for an isotopic difference of about 1.3‰ between the pre-industrial organic carbon and the present vegetation (Marino et al., 1992; Leuen-berger et al., 1992). The second mechanism involves different decay rates of various components in organic matter having different δ13C. These effects also significantly
20
alter the total δ13C, but the expected magnitude and direction depends on the rel-ative proportions of components, and are not completely known (Feng, 2002). The third mechanism is isotopic fractionation during decomposition. The most important processes are microbial respiration and fermentation, leading to13C-enrichments in microbial products compared to the organic substrate (Macko and Estep, 1984; Poage
25
and Feng 2004). This mechanism is considered to be the main reason for observed
13
C enrichment between litter and vegetation and with increasing soil depth.
BGD
5, 1795–1823, 2008Paleovegetation reconstruction using
δ13C of SOM
G. Wang et al.
Title Page
Abstract Introduction
Conclusions References
Tables Figures
◭ ◮
◭ ◮
Back Close
Full Screen / Esc
Printer-friendly Version
Interactive Discussion from plant materials not affected by fossil fuel combustion, because the age of soil
organic matter in deep soil can be thousands of years old (Shen, 2000). We, therefore, subtract 1.3 from the observed meanδ13C difference between deep soil and vegetation to account for the effect of theδ13C decrease in atmospheric CO2since the industrial
revolution. Theδ13C values of soil organic matter at 5 cm depth, may also have been
5
affected by theδ13C decrease in atmospheric CO2in recent decades. However, we did
not measure the age of the soil organic matter, and thus cannot determine how much correction would be needed for the surface soil. We will use the observed difference without a correction for later discussions, but note here that this difference may be slightly overestimated.
10
Summarizing the above discussions, we report that theδ13C difference is 1.8±0.3‰
(1 s.e., n=14) between the surface soil and vegetation, and 2.8±0.3‰ (1 s.e., n=14)
between the bottom soil and vegetation. If all values in isotopic differences between soil and vegetation are pooled, the difference is normally distributed with a mean of 2.3‰ and standard deviation of 1.1‰ (n=28).
15
Previous investigations (e.g. Stout et al., 1978; Dzurec et al., 1985; Gregorich et al., 1995; Balesdent et al. 1993) showed that theδ13C difference between vegetation and the topsoil (down to 20 cm depth) varied between 0.5‰ and 2.5‰. Wang (2001) obtained similar results from 36 soil profiles in Northwest China, and the meanδ13C difference between vegetation and the topsoil layer is 2.2‰. These δ13C differences
20
obtained by previous studies were not corrected for the effect of theδ13C decrease in atmospheric CO2. Therefore, the 2.8‰ carbon isotopic difference we obtained between
the bottom organic matters and vegetation is probably the maximum 13C enrichment due to organic matter decomposition, because most paleosols may not represent the soil at deepest horizons. If theδ13C difference of 1.8‰ between the surface soil and
25
vegetation are considered to be the most likely value for isotopic correction due to organic matter decay, Eq. (1) should be modified to the following:
BGD
5, 1795–1823, 2008Paleovegetation reconstruction using
δ13C of SOM
G. Wang et al.
Title Page
Abstract Introduction
Conclusions References
Tables Figures
◭ ◮
◭ ◮
Back Close
Full Screen / Esc
Printer-friendly Version
Interactive Discussion 4.3 Reconstructions of paleovegetation
Equations (1) and (3) are mass balance equations for estimating C3plants’ abundance
in the vegetation using the measuredδ13C of paleosol organic matter without or with a correction for isotopic enrichment due to soil organic matter decomposition. Before using these equations, however, we also need to obtain the end memberδ13C values
5
of C3and C4plants at the time when the plants grew. If we start with modern isotopic compositions of C3 and C4 plants, we have to make several corrections to obtain the
δ13CC4 and δ 13
CC3 values for the time in the geological history, e.g., Holocene or the
Last Glaciation. These corrections account for the effects on plantδ13C of 1) changes in precipitation, 2) changes in the δ13C of atmospheric CO2, and 3) changes in the
10
CO2 concentration in the atmosphere. Here we use the published loess δ 13
C data of Holocene and the Last Glaciation (LG) in Chinese Loess Plateau reported by Vidic and Monta ˜nez (2004) to show how different types of corrections affect the qualitative reconstruction of paleovegetation.
First, we obtain plant δ13C values in Holocene. The study site in Vidic and
15
Monta ˜nez (2004) is located at Jiaodao close to Yanan city on the central Chinese Loess Plateau, which presently has a temperate semimoist climate with an annual precipita-tion amount of about 600 mm. Our study shows the meanδ13C values of standing C3
and C4 plants in this area are −27.5‰ and −12.5‰ respectively. For Holocene, we
could assume that precipitation was similar to the current level, and therefore no need
20
to correct for the climate effect on plantδ13C value. Theδ13C value of the atmospheric CO2 in most part of Holocene was 1.3‰ higher than it is today (Marino et al., 1992; Leuenberger et al., 1992). Thus,δ13C values of C3, C4plants during Holocene would
be−26.2‰ and−11.2‰ respectively (Table 2).
Without the anthropogenic input of fossil fuel CO2, the atmospheric CO2
concentra-25
tion before the industrial resolution was 80 ppm lower than it is today. It is possible that the CO2 concentration level also affect the δ
13
C values of C3 plants. However,
BGD
5, 1795–1823, 2008Paleovegetation reconstruction using
δ13C of SOM
G. Wang et al.
Title Page
Abstract Introduction
Conclusions References
Tables Figures
◭ ◮
◭ ◮
Back Close
Full Screen / Esc
Printer-friendly Version
Interactive Discussion plants, growing over a range of CO2 concentrations characteristic of the Last Glacial
Maximum to the present atmosphere, tended to have constantci/caratios, suggesting a constant carbon isotope discrimination (∆). Feng and Epstein (1995), on the other hand, reported that the mean∆value of tree rings in four trees is positively correlated to the CO2concentration with a mean slope of 0.02‰/ppm. We have recently conducted
5
a detailed study on the∆response of ∼50 tree-ring series from widely distributed
lo-cations to atmospheric CO2concentration in the past 100–200 years. We found that the pattern of theδ13C response to the CO2 concentration is complex. Before 1950, the mean∆value tended to increase with the CO2concentration increase, while since
1950 ∆have decreased. The instantaneous rate of ∆ change with the CO2
concen-10
tration varied systematically, ranging from 0.025‰/ppm in 1850 to −0.013‰/ppm in
1995 (Wang and Feng, 20081). Apparently, theδ13C response to the CO2
concentra-tion is not linear during the past 100 years, and it is likely that this response not only depends upon the absolute level of CO2but also upon the rate of CO2 concentration change. Thus, it is difficult to determine whether corrections for a CO2 concentration
15
change is necessary, and if so how much correction should be made. Here we will make paleoecolgoical reconstruction considering the two situations, with and without a CO2 concentration correction. Under the situation with the correction, we use the
co-efficient ofδ13C-CO2concentration of Feng and Epstein (1995) (−0.02‰/ppm), which
has already been used by several previous authors. δ13C value of C3 plants would
20
then be−24.6‰ in the Holocene after a 1.6‰ correction for 80 ppm change in the CO2
concentration of the atmosphere. For C4 plants, δ 13
C has a lower sensitivity to CO2
concentration change (Henderson et al., 1992), so it remains−11.2‰ (Table 2).
We now obtainδ13CC
4 andδ
13
CC
3 values for the LG. Atmospheric CO2
concentra-tion was 80 ppm lower andδ13C value of CO2 was 0.3‰ lower than that of Holocene
25
(Marino et al., 1992; Leuenberger et al., 1992). With no correction for the effect of CO2 1
BGD
5, 1795–1823, 2008Paleovegetation reconstruction using
δ13C of SOM
G. Wang et al.
Title Page
Abstract Introduction
Conclusions References
Tables Figures
◭ ◮
◭ ◮
Back Close
Full Screen / Esc
Printer-friendly Version
Interactive Discussion concentration, theδ13C values of C3and C4plants in the last ice age become−26.5‰
and−11.5‰, respectively. With corrections for the effect of CO2 concentration,δ 13
C values of C3plants in the last ice age become−23.3‰.δ13C value of C4plants is still −11.5‰.
In addition, the precipitation at the location during the Last Glaciation was about 200
5
mm lower than that in Holocene (Wu et al., 1995). We correct the precipitation effect on theδ13C of C3plants using theδ
13
C–precipitation coefficient of−0.4‰/100 mm
ob-tained in this study, which yields a 0.8‰ correction for C3plants. Therefore, theδ 13
CC3
of vegetation becomes−25.7‰ without the correction for the CO2concentration, and −22.5‰ with the CO2correction. The precipitation change does not significantly affect
10
theδ13CC4 value, and thus no further corrections are made for theδ 13
C of C4plants.
Values for various corrections are listed in Table 2.
The average δ13CSOM value of S0 (Holocene paleosol) is reported to be −19.5‰
and that of L1(loess from the last glacial period)−22.4‰ (Vidic and Monta ˜nez, 2004).
Table 2 shows the effect of each type of corrections on the estimate of C4plant
abun-15
dance in the vegetation of a given age. One important comparison is shown by the difference using Eq. (1) versus Eq. (3) (column 4 and 5). Other things being equal, a correction for isotopic enrichment due to organic matter decomposition yields a C4 plant abundance in the vegetation about 12% lower than that obtained without such a correction.
20
The correction for CO2 concentration causes additional decrease in the estimated C4 plant abundances. In Holocene, the CO2 concentration correction reduces the
es-timated C4abundances by about 6–8%. The effect is more substantial for the LG; the
estimated C4abundances become 0.9% using (1) but negative using Eq. (3). The neg-ative value indicates that we may have overcorrected either for the enrichment of soil
25
organic matter, or theδ13C end member of C3plants, or both. Since our correction for
BGD
5, 1795–1823, 2008Paleovegetation reconstruction using
δ13C of SOM
G. Wang et al.
Title Page
Abstract Introduction
Conclusions References
Tables Figures
◭ ◮
◭ ◮
Back Close
Full Screen / Esc
Printer-friendly Version
Interactive Discussion the cause. As discussed earlier, our recent compilation on tree-ringδ13C series does
not yield a mean sensitivity of−0.02‰/ppm. The highest sensitivity,−1.3‰/ppm, was
obtained for the most recent year of 1995 in the series, and before 1995 it was con-sistently lower. Nevertheless, our calculations indicate that the C4 abundance was
probably very low and close to zero during the LG.
5
Compared to previously published paleovegetation reconstructions the estimated C4 abundances from this study are consistently lower. Vidic and Monta ˜nez (2004) re-ported 53% for C4% in Holocene, and 34% in the LG. Liu et al. (2005) also reported
53% of C4vegetation in Holocene, but 11% in the LG.
The differences in the percentage of C4 plants between this study and those by
10
Vidic and Monta ˜nez (2004) and Liu et al. (2005) come from the two sources. First, both Vidic and Monta ˜nez (2004) and Liu et al. (2005) did not take into account the
13
C enrichment during decomposition of organic matters (1.8‰ used in this study). Second, their corrections to obtain end members ofδ13CC3 andδ
13
CC4 are difference
from ours. Vidic and Monta ˜nez (2004) did not make any correction, and therefore
15
they obtained 53% and 34% C4 contribution in Holocene and the LG, respectively
(see Table 2). When estimating the C4% in the Last Glaciation, Liu et al. (2005),
did corrections on the precipitation effect on plant δ13C for both C3 and C4 plants
−1.1‰/100 mm, −0.61‰/100 mm for C3, C4 plants, respectively). We think that the
sensitivity they used for C3plants might have been too high considering that our study
20
is more comprehensive. In addition, their observation on the C4 plant response to
precipitation based on one C4 species (Bothriochloa ischaemum) may have been an exception rather than the rule. While Liu et al. (2005) did correct for the effect of CO2
concentration, they overlooked the fact that theδ13C value of CO2was 1.3‰ higher in
Holocene than it is of today.
25
It is possible that Vidic and Monta ˜nez (2004) and perhaps also Liu et al. (2005) over-estimated the percentages of C4 plants. For example, the percentages of C4 plants
BGD
5, 1795–1823, 2008Paleovegetation reconstruction using
δ13C of SOM
G. Wang et al.
Title Page
Abstract Introduction
Conclusions References
Tables Figures
◭ ◮
◭ ◮
Back Close
Full Screen / Esc
Printer-friendly Version
Interactive Discussion temperature was expected to have dropped by 8–10◦C compared to Holocene in the
China Loess Plateau (Wu et al., 1995; Ganopolski et al., 1998). The annual temper-ature today in Yanan is around 9◦C. If the annual temperature in Holocene is close to this value, the annual temperature during the last glacial time might have approached 0◦C, close to the mean annual temperature at the peak of Donglingshan Mountain in
5
North China (2303 m a.s.l. the annual temperature is around 0◦C) (Fig. 1), where no C4
species are present above 1750 m (Liu, 2003). In addition, an investigation in North-west China (including the Loess Plateau) showed that C4species in natural vegetation
are rarely found at sites with annual temperature less than 3◦C (Wang, 2001). Thus, we argue that the C4plants abundance during the Last Glaciation were likely to be close
10
to zero.
5 Conclusions
The13C enrichment by decomposition of organic matters can result in overestimation of the percentage of C4plants in paleovegetation usingδ
13
C values of soil organic matter. This effect has been overlooked by previous investigators. This work provides data for
15
quantitative corrections of the decomposition effect by measuring theδ13C variation in soil organic matter with depth in 14 soil profiles from three sites. These sites all have C3 only vegetation, and include both forest and grassland vegetation type. We report
that the averageδ13C difference between soil organic matter and vegetation is 1.8 for the surface soil and 2.8 for the bottom (of the profiles) soil.
20
The effect of precipitation onδ13C of C3and C4plants has been assessed by a
com-prehensive investigation of a large number of species (255 of C3and 43 C4species) from 33 sites in North China, adding additional data to the exiting database for simi-arid to simimoist ecosystems. A strong negative relationship is found between the site-averaged δ13C of C3 plants and the annual rainfall amount with a coefficient of
25
−0.40‰/100 mm, while no significant correlations are observed for both C4 plants as
BGD
5, 1795–1823, 2008Paleovegetation reconstruction using
δ13C of SOM
G. Wang et al.
Title Page
Abstract Introduction
Conclusions References
Tables Figures
◭ ◮
◭ ◮
Back Close
Full Screen / Esc
Printer-friendly Version
Interactive Discussion increase with increasing precipitation.
This study demonstrates that the paleovegetation reconstruction can be significantly affected by various corrections to the δ13CSOM value, and to the end member δ
13
C values of C3 and C4 plants before using mass balance calculations. We recommend
that corrections for the changes in the atmosphericδ13C,13C enrichment by
decompo-5
sition, and changes in precipitation at the given location are necessary. Corrections for changes in the atmospheric CO2concentration may also be needed, but we currently
have relatively poor knowledge on how much that correction should be. Using these corrections, we show that C4 plants were likely to be absent during the Last
Glacia-tion on the central Chinese Loess Plateau, which, considering the paleo-temperature
10
and precipitation condition, is consistent with distributions of C4 plants in the modern environment.
Acknowledgements. This research was supported by grants from the National Natural Science Foundation of China (Grant No. 40673017) and Program for Changjiang Scholars and Innova-tive Research Team in University (No. IRT0511). We’d like to thank M. Yan for analyzing stable
15
carbon isotope ratios in the Isotope Lab at the College of Resources and Environment, China Agricultural University.
References
An, Z. S., Huang, Y. S., Guo, Z. H., Clemens, S., Li, L., Prell, W., Ning, Y. F., Cai, Y. J., Zhou, W. J., Lin, B. H., Zhang, Q. L., Cao, Y. N., Qiang, X. K., Chang, H., and Wu, Z. K.: Multiple
20
expansions of C4plant biomass in East Asia since 7 Ma coupled with strengthened monsoon circulation, Geology, 33, 9, 705–708, 2005.
Balesdent, J., Girardin, C., and Mariotti, A.: Site-relatedδ13C of tree leaves and soil organic matter in a temperate forest, Ecology, 74, 6, 1713–1721, 1993.
Bird, M. I. and Pousai, P.: Variations ofδ13C in the surface soil organic carbon pool, Global
25
Biogeochem. Cy., 112, 313–322, 1997.
BGD
5, 1795–1823, 2008Paleovegetation reconstruction using
δ13C of SOM
G. Wang et al.
Title Page
Abstract Introduction
Conclusions References
Tables Figures
◭ ◮
◭ ◮
Back Close
Full Screen / Esc
Printer-friendly Version
Interactive Discussion
organic carbon and their use in documenting vegetation change in a subtropical savanna ecosystem, Geoderma, 82, 1, 5–14, 1998.
Boutton, T. W.: Stable carbon isotope ratios of soil organic matter and their use as indicators of vegetation and climate change, in: Mass Spectrometry of soils, edited by: Boutton, T. W., Yamasaki, S. I., Dekker, M., Inc., New York, 47–82, 1996.
5
Bowman, D. M. J. S. and Cook, G. D.: Can stable carbon isotopes (δ13C) in soil carbon be used to describe the dynamics ofEucalyptussavanna-rainforest boundaries in the Australian monsoon tropics?, Austral. Ecology, 27, 1, 94–102, 2002.
Buchmann, N., Brooks, J. R., Rapp, K. D., and Ehleringer, J. R.: Carbon isotope composition of C4 grasses is influenced by light and water supply, Plant Cell Environ., 19, 4, 392–402,
10
1996.
Chen, Q. Q., Shen, C. D., Peng, S. L., Yi, W. X., Sun, Y. M., Li, Z. A., and Jiang, M. T.: Charac-teristics and controlling factors of soil organic matter turnover processes in the Subtropical mountainous area, South China. Acta Ecologia Sinica, 22, 9, 1446–1454, 2002 (in Chinese with English abstract).
15
Connin, S. L., Feng, X., and Virginia, R. A.: Isotopic discrimination during long-term decompo-sition in an arid land ecosystem, Soil Biol. Biochem., 33, 41–51, 2001.
Ding, Z. L. and Yang, S. L.: C3/ C4vegetation evolution over the last 7.0 Myr in Chinese Loess Plateau: evidence from pedogenic carbonate δ13C, Palaeogeogr. Palaeocl., 160, 4, 291– 299, 2000.
20
Dzurec, R. S., Boutton, T. W., Caldwell, M. M., and Smith, B. N.: Carbon isotope ratios of soil organic matter and their use in assessing community composition changes in Curlew Valley, Utah, Oecologia, 66, 1, 17–24, 1985.
Ehleringer, J. R. and Cooper, T. A.: Correlations between carbon isotope ratio and microhabitat in desert plants, Oecologia, 76, 5, 562–566, 1988.
25
Farquhar, G. D.: On the nature of carbon isotope discrimination in C4 species, Aust. J. Plant. Physiol., 10, 2, 205–226, 1983.
Farquhar, G. D, O’Leary, M. H., and Berry, J. A.: On the relationship between carbon isotope discrimination and the intercellular carbon dioxide concentration in leaves, Aust. J. Plant. Physiol., 9, 1, 121–137, 1982.
30
BGD
5, 1795–1823, 2008Paleovegetation reconstruction using
δ13C of SOM
G. Wang et al.
Title Page
Abstract Introduction
Conclusions References
Tables Figures
◭ ◮
◭ ◮
Back Close
Full Screen / Esc
Printer-friendly Version
Interactive Discussion
Feng, X., Peterson, J. C., Quideau, S. A., Virginia, R. A., Graham, R. C., Sonder, L. J., and Chadwick, O. A.: Distribution, accumulation and fluxes of soil carbon in four monoculture lysimeters at San Dimas Experimental Forest, California, Geochim. Cosmochim. Ac., 63, 9, 1319–1333, 1999.
Feng, X.: A theoretical analysis of carbon isotope evolution of decomposing plant litters and soil
5
organic matter, Global Biogeochem. Cy., 16, 4, 1119, doi:10.1029/2002GB001867, 2002. Fernandez, I., Mahieu, N., and Cadisch, G.:. Carbon isotopic fractionation during
de-composition of plant materials of different quality, Global Biogeochem. Cy., 17, 1075, doi:10.1029/2001GB001834, 2003.
Frakes, L. A. and Sun, J. Z.: A carbon isotope record of the upper Chinese loess sequence:
10
estimates of plant types during stadials and interstadials, Palaeogeogr. Palaeocl., 108, 2, 183–189, 1994.
Friedli, H., Moore, E., Oeschger, H., Siegenthaler, U., and Stauffer, B.: 13C/12C ratios in CO2 extracted from Antarctic ice, Geophys. Res. Lett., 11, 5, 1145–1148, 1984.
Ganopolski, A., Rahmstorf, S., Petoukhov, V., and Claussen, M.: Simulation of mordern and
15
glacial climates with a coupled global model of intermediate complexity, Nature, 391, 6665, 351–356, 1998.
Ghannoum, O., von Gaemmerer, S., and Conory, J. P.: The effect of drought on plant water use efficiency of nine NAD–ME and nine NADP–ME Australian C4 grasses, Funct. Plant Biol., 29, 7, 1337–1348, 2002.
20
Gregorich, E. G., Ellert, B. H., and Monreal, C. M.: Turnover of soil organic matter and storage of corn residue carbon estimated from natural13C abundance, Can. J. Soil Sci., 75, 2, 161– 167, 1995.
Gu, Z.: The carbonate isotopic composition of the loess – paleosol sequence and its implication of paleoclimatic change, Chinese Sciences Bulletin, 36, 10, 1979–1983, 1991.
25
Guillaume, K., Huard, M., Gignoux, J., Mariotti, A., and Abbadie, L.: Does the timing of litter inputs determine natural abundance of13C in soil organic matter? Insights from an African tiger bush ecosystem, Oecologia, 127, 295–304, 2001.
Han, J. M., Keppens, E., Liu, T. S., Paepe, R., and Jiang, W. Y.: Stable isotope composition of the carbonate concretion in loess and climate change, Quatern. Int., 37, 1, 37–43, 1996.
30
BGD
5, 1795–1823, 2008Paleovegetation reconstruction using
δ13C of SOM
G. Wang et al.
Title Page
Abstract Introduction
Conclusions References
Tables Figures
◭ ◮
◭ ◮
Back Close
Full Screen / Esc
Printer-friendly Version
Interactive Discussion
Institute of Botany: CAS Flora of China (in Chinese), Chinese Science Press, Beijing, 1982. Krull, E. S., Bestland, E. A., and Gates, W. P.: Soil organic matter decomposition and turnover
in a Tropical Ultisol: Evidence fromδ13C,δ15N and Geochemistry, Radiocarbon, 44, 1, 93– 112, 2005.
K ¨orner, C., Farquhar, G., and Dand Roksandic, Z.: A global survey of carbon isotope
discrimi-5
nation in plants from high altitude, Oecologia, 74, 6, 623–632, 1988.
Leuenberger, M., Siegenthaler, U., and Langway, C. C.: Carbon isotope composition of atmo-spheric CO2during the last ice age from an Antarctic ice core, Nature, 357, 6385, 488–490, 1992.
Lin, B., Liu, R., and An, Z.: Preliminary research on stable isotopic composition of Chinese
10
loess, in: Loess, Environment and Global Chang, edited by: Liu, T., Science Press, Beijing, 124–131, 1991.
Liu, M.: Composition of carbon isotope of plants in Donglingshan Mountain, North China, MS. thesis, Peking University, 2003.
Liu, W. G., Feng, X. H., Ning, Y. F., Zhang, Q. L., and Cao, Y. N.: δ13C variation of C3and C4
15
plants across an Asian monsoon rainfall gradient in arid northwestern China, Global Change Biol., 11, 1094–1100, doi:10.1111/j.1365-246.2005.00969.x., 2005.
Macko, A. and Estep, M. L. F.: Microbial alteration of stable nitrogen and carbon isotopic com-positions of organic matter, Org. Geochem., 6, 787–790, 1984.
Marino, B. D., McElroy, M. B., Salawitch, R. J., and Spaulding, W. G.: Glocial to interglacial
20
variations in the carbon isotopic composition of atmospheric CO2, Nature, 357, 6385, 461– 466, 1992.
Natelhoffer, K. J. and Fry, B.: Controls on natural nitrogen-15 and carbon-13 abundances in forest soil organic matter, Soil Sci. Soc. Am. J., 52, 6, 1633–1640, 1988.
Poage, M. A. and Feng, X.: A theoretical model of steady state δ13C vs. depth
25
profiles of decomposing soil organic matter, Global Biogeochem. Cy., 18, GB2016, doi:10.1029/2003GB002195, 2004.
Polley, H. W., Johnson, H. B., Marino, B. D., and Mayeux, H. S.: Increase in C3 plant water-use efficiency and biomass over Glacial to present CO2concentrations, Nature, 361, 6433, 61–64, 1993.
30
Schleser, G. H. and Pohling, R.:δ13C record in forest soil using a rapid method for preparing carbon dioxide samples, Int. J. Appl. Radiat. Is., 31, 7, 769–773, 1980.
BGD
5, 1795–1823, 2008Paleovegetation reconstruction using
δ13C of SOM
G. Wang et al.
Title Page
Abstract Introduction
Conclusions References
Tables Figures
◭ ◮
◭ ◮
Back Close
Full Screen / Esc
Printer-friendly Version
Interactive Discussion
carbon isotope ratios in the grass flora of Namibia in relation to growth form, precipitation and habitat conditions, Oecologia, 106, 352–369, 1996.
Schulze, E.-D., Turner, N. C., Nicolle, D., and Schumacher, J.: Leaf and wood carbon isotope ratios, specific leaf areas and wood growth of Eucalyptus species across a rainfall gradient in Australia, Tree Physiol., 26, 5, 479–492, 2006.
5
Schwartz, D., Mariotti, R., Lanfranchi, R., and Guillet B.: 13C/12C ratios of soil organic matter as indicators of vegetation changes in the Congo, Geoderma, 39, 2, 97–103, 1986.
Shen, C. D., Yi, W. X., Sun, Y. M., Xing, C. P., Yang, Y., Peng, S. L., and Li, Z. A.:14C apparent ages andδ13C distribution of forest soils in Dinghushan Natural Reserve, Quatern. Sci., 20, 4, 335–344, 2000 (in Chinese with English abstract).
10
Smedley, M. P., Dawson, T. E., Comstock, J. P., Donovan, L. A., Sherrill, D. E., Cook, C. S., and Ehleringer, J. R.: Seasonal carbon isotope discrimination in a grassland community, Oecologia, 85, 314–320, 1991.
Stanley, H. A. and Nancy, E. S.: Soil carbon isotope evidence for Holocene habitat change in the Kenya Rift Valley, Science, 253, 1402–1405, 1991.
15
Stewart, G. R., Turnbull, M. H., Schmidt, S., and Erskine, P. D.:13C Natural abundance in plant communities along a rainfall gradient: a biological integrator of water availability, Aust. J. Plant. Physiol., 22, 1, 51–55, 1995.
Stout, J. D. and Rafter, T. A.: The13C/12C isotopic ratios of some New Zealand tussock grass-land soils, in: Stable Isotopes in the Earth Sciences, edited by: Robinson, B. W., DSIR BULL,
20
Wellington, 75–83, 1978.
Stout, J. D., Rafter, T. A., and Throughton, J. H.: The possible significance of isotopic ratios in paleoecology, in: Quaternary Studies, edited by: Suggate, R. P., Cresswell, M., Royal Society of New Zealand, Wellington, 279–286, 1975.
Torn, M. S., Lapenis, A. G., Timofeev, A., Fischer, M., Babikov, B., and Harden, J. W.: Organic
25
carbon and carbon isotopes in modern and 100-year-old-soil archives of the Russian steppe, Glob. Change Biol., 8, 10, 941–953, 2002.
Trolier, M., White, J. W., Tans, P. P., Masarie, K. A., and Gemery, P. A.: Monitoring the iso-topic composition of atmospheric CO2: measurements from the NOAA Global Air Sampling Network, J. Geophys. Res., 100, 10, 25 897–25 916, 1996.
30
Troughton, J. H., Stout, J. D., and Rafter, T. A.: Long-term stability of plant communities, Carnegie Inst Wash Yearbook, 73, 838–845, 1974.
BGD
5, 1795–1823, 2008Paleovegetation reconstruction using
δ13C of SOM
G. Wang et al.
Title Page
Abstract Introduction
Conclusions References
Tables Figures
◭ ◮
◭ ◮
Back Close
Full Screen / Esc
Printer-friendly Version
Interactive Discussion
plant proportions on the Chinese Loess Plateau, Geology, 32, 4, 337–340, 2004.
Wang, G. A., Han, J. M., and Liu, T. S.: The carbon isotopic composition of C3herbaceous plants in loess area of North China, Science in China in Series D- Earth Sciences, 46, 10, 1069–1076, 2003.
Wang, G. A., Han, J. M., Zhou, L. P., Xiong, X. G., and Wu, Z. H.: Carbon isotope ratios of
5
plants and occurrences of C4species under different soil moisture regimes in arid region of Northwest China, Physiol. Plantarum, 125, 1, 74–81, 2005.
Wang, G. A., Han, J. M., Zhou, L. P., Xiong, X. G., Tan, M., Wu, Z. H., and Peng, J.: Carbon isotope ratios of C4plants in loess areas of North China, Science in China in Series D- Earth Sciences, 49, 1, 97–102, 2006.
10
Wang, G. A.:δ13C values in herbaceous plants and surface soil organic matter in north China. Ph.D. thesis in the Institute of Geology and Geophysics, Chinese Academy of Sciences, 2001.
Wang, H. and Follmer, L. R.: Proxy of monsoon seasonality in carbon isotopes from paleaosols of the southern Chinese Loess Plateau, Geology, 26, 11, 987–990, 1998.
15
Wang, Y. and Zheng, S. H.: Paleosol nodules as Pleistocene paleoclimatic indicators, Lu-ochuan, P. R. China, Palaeogeogr. Palaeocl., 76, 1, 39–44, 1989.
Wedin, D. A, Tieszen, L. L., Dewey, B., and Pastor, J.: Carbon isotope dynamics during grass decomposition and soil organic matter formation, Ecology, 76, 5, 1383–1392, 1995.
Wu, N. Q., Lu, H. Y., and Sun, X. J.: Climatic factor transfer function from opal phytolith and
20
its application in paleoclimate reconstruction of China loess- palaeosol sequence, Scientia Geologia Sinica, 1(Supplement), 105–114, 1995.
Zhang, Z. H., Zhao, M. X., Yang, X. D., Wang, S. M., Jiang, X. Z., Oldfield, F., and Eglinton, G.: A hydrocarbon biomarker record for the last 40 Kyr of plant input to Lake Heqing, Southwestern China, Org. Geochem., 35, 5, 595–613, 2004.
25
Zinke, P. J., Stangenberger, A. G., Post, W. M., Emanuel, W. R., and Olson, J. S.: Worldwide Or-ganic Soil Carbon and Nitrogen Data. NDP-018http://cdiac.esd.ornl.gov/ndps/ndp018.html. Carbon Dioxide Information Analysis Center, Oak Ridge National Laboratory, Oak Ridge, Tennessee, USA, 1986.
Zinke, P. J., Stangenberger, A. G., Post, W. M., Emanuel, W. R., and Olson, J. S.: Global
30
Organic Soil Carbon and Nitrogen (Zinke et al.). Data set. Available on-linehttp://www.daac.
BGD
5, 1795–1823, 2008Paleovegetation reconstruction using
δ13C of SOM
G. Wang et al.
Title Page
Abstract Introduction
Conclusions References
Tables Figures
◭ ◮
◭ ◮
Back Close
Full Screen / Esc
Printer-friendly Version
Interactive Discussion
Table 1. Observed carbon isotopic differences between vegetation or plant litter and soil organic matter.
Site 1 Site 2 Site 3
δ13Csur−veg δ13Cbotm−veg δ13Csur−litter δ13Cbotm−litter δ13Csur−veg δ13Cbotm−veg
Profile 1 0.7 5.2 1.5 3.7 2.5 3.9
Profile 2 1.0 3.7 2.1 3.8 1.4 3.4
Profile 3 0.6 5.9 2.4 3.7 2.2 3.3
Profile 4 1.0 5.2 3.0 5.0
Profile 5 1.1 2.6 2.5 4.5
Profile 6 1.0 3.2
Mean 0.9 4.3 2.3 4.1 2.0 3.5
Stand. Error 0.1 0.5 0.2 0.2 0.3 0.2
BGD
5, 1795–1823, 2008Paleovegetation reconstruction using
δ13C of SOM
G. Wang et al.
Title Page
Abstract Introduction
Conclusions References
Tables Figures
◭ ◮
◭ ◮
Back Close
Full Screen / Esc
Printer-friendly Version
Interactive Discussion
Table 2. Comparison of C4% contribution to paleovegetation with various corrections.
Holocene Using Eq. (1)* Using Eq. (3)*
δ13CC3 δ
13
CC4 C4% C4%
Today’s vegetation −27.5 −12.5 53.3 41
δ13Catmcorrection (+1.3) −26.2 −11.2 44.7 32.7
CO2concentration correction (C3:+1.6‰) −24.6 −11.2 38.1 24.6
Last Glaciation Using Eq. (1)* Using Eq. (3)*
δ13CC3 δ
13
CC3 C4% C4%
Today’s vegetation −27.5 −12.5 34 22
δ13Catmcorrection (+1.3‰–0.3‰) −26.5 −11.5 27.3 15.3
Precipitation correction (C3:+0.8‰) −25.7 −11.5 23.2 10.6
CO2concentration correction (C3:+1.6‰+1.6‰) −22.5 −11.5 0.9 −15.5
∗
BGD
5, 1795–1823, 2008Paleovegetation reconstruction using
δ13C of SOM
G. Wang et al.
Title Page
Abstract Introduction
Conclusions References
Tables Figures
◭ ◮
◭ ◮
Back Close
Full Screen / Esc
Printer-friendly Version
Interactive Discussion Site 1
Site 2, 3
90° 100° 120°
45°
40°
35°
Beijing
0 1000 Km
110°
Yinchuan
Urumqi
BGD
5, 1795–1823, 2008Paleovegetation reconstruction using
δ13C of SOM
G. Wang et al.
Title Page
Abstract Introduction
Conclusions References
Tables Figures
◭ ◮
◭ ◮
Back Close
Full Screen / Esc
Printer-friendly Version
Interactive Discussion 0 200 400 600 800
-30 -28 -26 -24 -22
y = -0.004x -25.057 ( r = 0.6, p < 0.0001)
Annual precipitation (mm)
δ
13C
(
0/00
)
a
0 200 400 600 800 -16
-14 -12 -10
y = 0.0014 x - 13.37 ( r = 0.26, p >0.1)
Annual precipitation (mm) b
100 200 300 400 500 600 700 -16
-14 -12 -10
Annual precipitation (mm)
y = 0.0014 x -12.59 (r = 0.29, p > 0.1)
c
δ
13C
(
0/00
)
δ
13C
(
0/00
)
BGD
5, 1795–1823, 2008Paleovegetation reconstruction using
δ13C of SOM
G. Wang et al.
Title Page
Abstract Introduction
Conclusions References
Tables Figures
◭ ◮
◭ ◮
Back Close
Full Screen / Esc
Printer-friendly Version
Interactive Discussion
BGD
5, 1795–1823, 2008Paleovegetation reconstruction using
δ13C of SOM
G. Wang et al.
Title Page
Abstract Introduction
Conclusions References
Tables Figures
◭ ◮
◭ ◮
Back Close
Full Screen / Esc
Printer-friendly Version
Interactive Discussion