www.biogeosciences.net/10/1693/2013/ doi:10.5194/bg-10-1693-2013
© Author(s) 2013. CC Attribution 3.0 License.
Biogeosciences
Geoscientiic
Geoscientiic
Geoscientiic
Geoscientiic
Geomorphic control on the
δ
15
N of mountain forests
R. G. Hilton1, A. Galy2, A. J. West3, N. Hovius2, and G. G. Roberts4 1Department of Geography, Durham University, Durham, DH1 3LE, UK
2Department of Earth Sciences, University of Cambridge, Cambridge, CB2 3EQ, UK
3Department of Earth Sciences, University of Southern California, Los Angeles, CA 90089, USA
4Bullard Laboratories, Department of Earth Sciences, University of Cambridge, Cambridge, CB3 0EZ, UK Correspondence to:R. G. Hilton ([email protected])
Received: 24 August 2012 – Published in Biogeosciences Discuss.: 14 September 2012 Revised: 24 January 2013 – Accepted: 14 February 2013 – Published: 13 March 2013
Abstract. Mountain forests are subject to high rates of physical erosion which can export particulate nitrogen from ecosystems. However, the impact of geomorphic processes on nitrogen budgets remains poorly constrained. We have used the elemental and isotopic composition of soil and plant organic matter to investigate nitrogen cycling in the moun-tain forest of Taiwan, from 24 sites with distinct geomorphic (topographic slope) and climatic (precipitation, temperature) characteristics. The organic carbon to nitrogen ratio of soil organic matter decreased with soil14C age, providing con-straint on average rates of nitrogen loss using a mass balance model. Model predictions suggest that present day estimates of nitrogen deposition exceed contemporary and historic ni-trogen losses. We found∼6 ‰ variability in the stable iso-topic composition (δ15N) of soil and plants which was not re-lated to soil14C age or climatic conditions. Instead,δ15N was significantly, negatively correlated with topographic slope. Using the mass balance model, we demonstrate that the cor-relation can be explained by an increase in nitrogen loss by non-fractioning pathways on steeper slopes, where physical erosion most effectively removes particulate nitrogen. Pub-lished data from forests on steep slopes are consistent with the correlation. Based on our dataset and these observations, we hypothesise that variable physical erosion rates can sig-nificantly influence soilδ15N, and suggest particulate nitro-gen export is a major, yet underappreciated, loss term in the nitrogen budget of mountain forests.
1 Introduction
Nitrogen (N) is essential to primary productivity in the terres-trial biosphere (Evans, 1989; Vitousek and Howarth, 1991). The stock of bioavailable N influences an ecosystem’s abil-ity to buffer increases in atmospheric carbon dioxide through enhanced productivity (Oren et al., 2001), and also deter-mines the impact of anthropogenic N deposition on plant growth and soil biogeochemistry (Aber et al., 1989; Mat-son et al., 1999; Zaehle et al., 2011). For these reaMat-sons, there have been considerable efforts to better understand the pro-cesses and rates of N loss from forests, and the factors which inhibit or amplify nutrient export (e.g. Hedin et al., 1995; Howarth et al., 1996; Lewis et al., 1999; Saunders et al., 2006; Schlesinger et al., 2006).
(POC) derived from plant and soil organic matter at rates >10 t C km−2yr−1(Kao and Liu, 2000; Hilton et al., 2008a, 2012; Townsend-Small et al., 2008; Hatten et al., 2012). De-spite its potential importance, the impact of physical ero-sion and PN loss on N cycling in ecosystems remains poorly constrained (Brenner et al., 2001; Amundson et al., 2003; Quinton et al., 2010). This is particularly the case for moun-tain forests, where PN transfers are not typically considered alongside dissolved N export (Saunders et al., 2006; Mc-Groddy et al., 2008; Brookshire et al., 2012a; Huang et al., 2012), evolution of soil carbon stocks or POC transfer (Yoo et al., 2006; Hilton et al., 2008b, 2012).
Here we examine N cycling in the subtropical mountain forest of the Central Range, Taiwan, and assess the role of physical erosion as a driver of N loss in ecosystems. Ero-sion rates in this mountain belt are 3–6 mm yr−1 (Dadson et al., 2003), amongst the highest in the world (Milliman and Farnsworth, 2011). Topographic slope is the fundamen-tal control on particulate export at the hillslope scale (Gilbert, 1909; Culling, 1960; Roering et al., 2001; Dietrich et al., 2003). Therefore, we have collected soil and plant organic matter from sites which randomly sample slope angle as an environmental variable and measured its N isotopic com-position (reported as δ15N, ‰), and organic carbon to ni-trogen ratio (C/N), as well as the radiocarbon concentra-tion of soil organic matter (reported as 14C age, yr). The sites also span climatic conditions (temperature, precipita-tion), which are thought to play an important role for N cy-cling in ecosystems (Amundson et al., 2003). These samples provide a record of the integration of N inputs and outputs from the mountain forest over decades to millennia (Del-wiche and Steyn, 1970; Mariotti et al., 1980; Handley and Raven, 1992; H¨ogberg and Johannisson, 1993; Martinelli et al., 1999; Robinson, 2001), and in combination with a mass balance model (Shearer et al., 1974; Brenner et al., 2001) our measurements give new insight into the pathways of N loss and N cycling in mountain forests.
2 Study area and site characteristics
Taiwan is located at 22–25◦N on the West Pacific margin at the convergence zone between the Eurasian and Philip-pine Sea plates. The Central Range mountains form the to-pographic spine of the island,∼350 km long and∼50 km wide with numerous peaks over 3000 m (Fig. S1). Mean an-nual precipitation (MAP) averages∼2500 mm and can reach 6000 mm (Dadson et al., 2003). Much of this falls as rain dur-ing tropical cyclones that impact the island between June and October. The tectonic and climatic regime combine to pro-duce high rates of physical erosion (Dadson et al., 2003) and build catchments where steep slopes are prevalent (Hilton et al., 2012). Vegetation grows up to the crests of the high-est ridges and on the steep slopes, with the subtropical for-est containingFicus,Machilus,Castanopsis,Quercus,Pinus,
Tsuga, and Picea (Su, 1984). The above ground standing biomass stock in mixed conifer–hardwood forest of Taiwan is∼22 000 t km−2 (West et al., 2011), similar to the aver-age estimated for the tropics (Dixon et al., 1994), making the mountain forest of Taiwan a suitable location to study the in-fluence of climatic and geomorphic gradients on N cycling.
Samples were collected from sites on two east–west trend-ing transects, separated north–south by∼100 km (Fig. S1), on the mid- to upper-part of convex hillslopes. The northern transect was∼30 km long and located mostly in the Liwu River catchment (435 km2). The southern leg was∼40 km long in the catchment of the Wulu River (639 km2). Rates of POC export from these and other mountain catchments in Taiwan have been determined previously from direct sam-pling of rivers, returning yields of POC from vegetation and soil (Kao and Liu, 2000; Hilton et al., 2008a, 2012) after ac-counting for fossil POC input to the river sediments (Hilton et al., 2010). According to these estimates, the inter-annual rate of POC export from the Liwu and Wulu catchments was 6.8±2.7 t C km−2yr−1 and 13.8±4.8 t C km−2yr−1, respectively (Hilton et al., 2012). While some of this ma-terial may have derived from erosion of biomass by slope-clearing bedrock landslides (Hilton et al., 2011a; West et al., 2011), soil loss via overland flow is important for POC ex-port from mountainous terrain (Larsen et al., 1999; Hilton et al., 2008a, 2012; Walker and Shiels, 2008; Hatten et al., 2012). Soil organic matter in Taiwan has an organic car-bon to nitrogen ratio of∼12 (Kao and Liu, 2000). Hence, measured rates of POC export could correspond to a PN export of∼1 t N km−2yr−1 from the mountain forest. This estimate is consistent with other measurements from Tai-wan in the Lanyang River catchment (820 km2; Fig. S1), lo-cated in the north–east where erosion rates are lower (Dad-son et al., 2003), where PN export from vegetation and soil is 0.4±0.2 t N km−2yr−1(Kao and Liu, 2000).
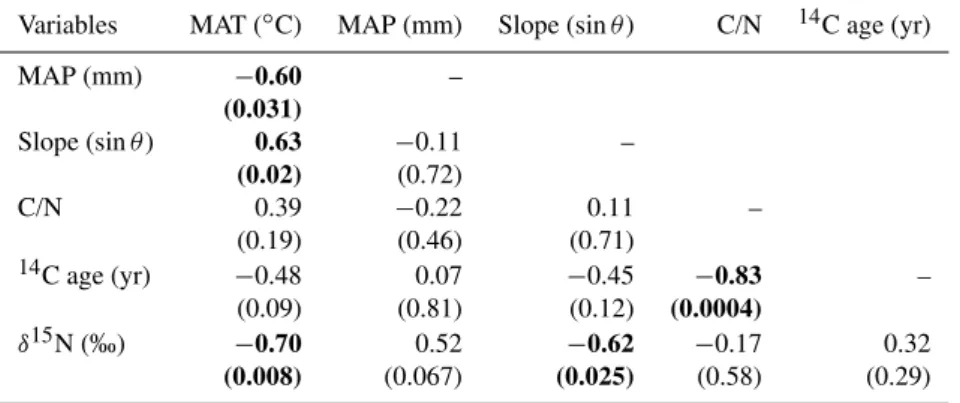
Table 1.Correlation matrix (Pearson) for soil samples (n=13) from the Central Range, Taiwan. Values in bold are different from 0 with a significance level ofα=0.05;P values are given in parentheses.
Variables MAT (◦C) MAP (mm) Slope (sinθ) C/N 14C age (yr)
MAP (mm) −0.60 –
(0.031)
Slope (sinθ) 0.63 −0.11 –
(0.02) (0.72)
C/N 0.39 −0.22 0.11 –
(0.19) (0.46) (0.71)
14C age (yr) −0.48 0.07 −0.45 −0.83 –
(0.09) (0.81) (0.12) (0.0004)
δ15N (‰) −0.70 0.52 −0.62 −0.17 0.32
(0.008) (0.067) (0.025) (0.58) (0.29)
In line with the objectives of this study, other attributes were not considered in site selection and are assumed to be sampled randomly. Decadal averaged MAP (mm) was obtained from a digital map gridded at 1×1 km (Dad-son et al., 2003). Hillslope angle (θ, ◦) was determined using ArcInfoTM software, from a digital elevation model (40×40 m grid) and sampled over a 100 m length scale which is appropriate when considering erosion laws in moun-tain landscapes (Dietrich et al., 2003). Topographic slope was recorded as sinθ. The sample sites ranged between 530 m and 3190 m elevation, 7◦C to 21.9◦C MAT, 2060 mm to 3500 mm MAP, and had a slope angle θ between 7◦and 50◦ (0.12 to 0.76 sinθ) (Table S1). We note that signifi-cant correlations exist between attributes of our soil sites (Table 1), with a negative relationship between MAT and MAP (P=0.03) reflecting orographic forcing of precipita-tion, and a positive relationship between MAT and slope an-gle (P =0.02). The latter is not observed for plant sample sites (Table 2).
3 Materials and methods
3.1 Samples
Plant samples were collected in March 2006 fromPinus mor-risonicola(Taiwan white pine), selected for its ubiquitous presence across the full elevation range of forest (Su, 1984). Stems∼5–10 mm in diameter (to provide an integration of several growing seasons) and less than ∼30 cm long were cut from live adult (>4 m) specimens. In addition, stems of ∼1 m tallCymbopogonsp. grasses were collected to inves-tigate interspecies heterogeneity. Stems were stored in ster-ile sample bags and frozen less than one week after collec-tion. After storage for one month, plant samples were oven dried at<80◦C to remove remaining moisture. Bark was re-moved from pine stems and samples cut into∼1 mg pieces and stored in sealed glass vials.
Table 2.Correlation matrix (Pearson) forPinus morrisonicolaand
Cymbopogonsp. (n=23) from the Central Range, Taiwan. Val-ues in bold italic are different from 0 with a significance level of α=0.05;P values are given in parentheses.
Variables MAT (◦C) MAP (mm) Slope (sinθ ) C/N
MAP (mm) −0.70 –
(0.0002)
Slope (sinθ) 0.29 −0.07 –
(0.34) (0.76)
C/N 0.40 −0.32 0.23 –
(0.06) (0.14) (0.29)
δ15N (‰) −0.11 0.18 −0.59 −0.25
(0.62) (0.42) (0.003) (0.24)
Soil samples correspond to A–E soil horizons (variable humified organic matter intimately mixed with coarse and fine mineral fractions, bearing little structure of the original bedrock) were obtained at the same time as plants. Approxi-mately 500 cm3of bulk material were collected over a depth of∼10 cm and sealed in sterile bags, dried at 80◦C within one week of collection and decanted for dark storage within sealed sterile bags. To obtain an integrated bulk soil sample at each site, the entire sampled mass was then homogenised us-ing a Cyclostec mill grinder. Inorganic carbon was removed from soils using a HCl leach (Hilton et al., 2010).
3.2 Measurement procedures and data analysis
Weight percent organic C (Corg, %) and N were determined on plant material and soil (following inorganic carbon re-moval) by combustion at 1020◦C in O
(oxalic acid and porano), corrected for internal and procedu-ral blanks and reported inδ15N andδ13C notation relative to air (Mariotti, 1983) and Vienna Peedee Belemnite, respec-tively. For plant samples, to obtain desired amounts of N2 for isotopic analysis large amounts of CO2 were produced. A CARBOSORBTM trap was used to scrub CO2 prior to its introduction to the EA GC-column. For soils,14C con-centrations were determined, after graphitisation of CO2, by accelerator mass spectrometry at the UK National En-vironmental Research Council Radiocarbon Facility and are reported as14C age.
Precision (2σ) and accuracy of stable isotope measure-ments were determined using IAEA 600 and USGS-40 stan-dards. Measured meanδ15N were 1.2±0.2 ‰ (IAEA 600, ±2σ, n=28) and −4.5±0.5 ‰ (IAEA USGS-40, ±2σ, n=18), and meanδ13C −27.6±0.3 ‰ (IAEA 600, ±2σ, n=30), indicating average accuracies of 0.1 ‰ and−0.1 ‰ for δ15N andδ13C, respectively. Further replicates of soil samples returned average 2σof±0.4 ‰ (n=8) and±0.3 ‰ (n=19), forδ15N andδ13C, respectively. Average precision on14C age measurements was 72 yr (2σ). The inorganic re-moval procedure did not alter the measuredδ15N of the soil materials beyond this precision according to a comparison with aliquots not subjected to the acid leach, which conforms with results from soil materials elsewhere (Brodie et al., 2011), nor did it alter the14C age andδ13C of treated IAEA standards (Hilton et al., 2008a). The measured variables were analysed for statistically significant inter-correlation using OriginProTM. Mean values of sample sets are reported±the standard error of the mean throughout.
4 Results
4.1 Dataset size
The number of sample sites was relatively few across the two transects studied in Taiwan. In a global completion, Amund-son et al. (2003) have previously assessed the role of dataset size for the return of significant correlations between plant and bulk soilδ15N values and environmental variables. They showed that the statistical link betweenδ15N and site condi-tions (in their case MAP and/or MAT) were preserved both when the number of sites were similar to this study (n <30) and with∼4 times the number of sites studied in Taiwan. These findings are consistent with the results of K¨orner et al. (1988), who report significant correlations between the isotopic composition of plants and site elevation which are preserved in sample sub-sets with n<30. We are therefore confident that the number of sites in this study can inform us of the first-order environmental controls on the measured δ15N of Taiwan plants and soil.
Plants
Soil
δ
15N
s
(‰)
δ
15N
p(‰)
I
exEcosystem
Fractionating N loss
Non-fractionating N loss αE = 1 αf ≠ 1
Rex
k
fk
Ek
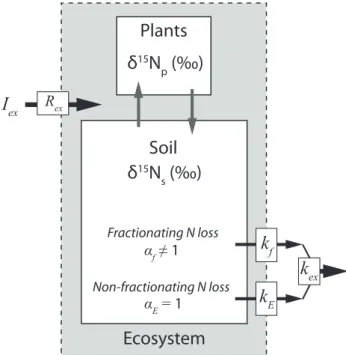
exFig. 1.Controls on the bulkδ15N of a forest ecosystem with exter-nal N input and output (black arrows) and interexter-nal N cycling (grey arrows). The isotopic ratio of external inputs (Rex)delivered at a rateIex(t N km−2yr−1)are modified by N losses which fraction-ate N isotopes by a factorαf(6=1) by the rate constantkf(yr−1). N can also be lost by non-fractioning pathways (αE=1) which occur at a ratekE(yr−1). The total N loss rate constant,kex=kf+kE.
4.2 Vegetation
0.3
0.2
0.0 0.1
-6 -4 -2 0 2 4 6 8
δ
15N (‰)
P
robabilit
y densit
y
Soils (n=13) Plants (n=23)
Fig. 2. δ15N of soil and plant organic matter from the Central Range, Taiwan. Probability density shown for soil (black),Pinus morrisonicola(dark grey) andCymbopogonsp. (light grey).
4.3 Soil
The bulk C/N ratios of soil organic matter ranged between 3 and 14 (Table S3) and were similar to those reported else-where in Taiwan (Kao and Liu, 2000). A significant nega-tive correlation (P=0.0004) existed between C/N and14C age of bulk soil across all sample sites (Table 1). This cor-relation is not compatible with mixing of fossil organic mat-ter from sedimentary bedrock (infinite14C age, C/N∼5–10) with vegetation (Hilton et al., 2010). Instead, the14C deple-tion represents aging of organic matter. Soil14C age was not correlated with the climatic and geomorphic characteristics of the sample sites, or withδ15N values (Table 1).
The averageδ15N of bulk soil was 4.0±0.5 ‰ (n=13) and ranged over∼6 ‰ from 0.7 ‰ to 6.5 ‰ (Fig. 2). These values are similar to published measurements from soils in other locations in Taiwan (Kao and Liu, 2000; Liu et al., 2006).δ15N values of duplicate and triplicate samples col-lected at two of the sites (Tables S1 and S3) were indistin-guishable within the analytical uncertainty of 0.4 ‰, with means of 6.2±0.3 ‰ (n=2) and 4.5±0.3 (n=3), indicat-ing that measured soilδ15N values can be taken as represen-tative site averages.
Soilδ15N values were significantly, negatively correlated with slope (P =0.025; Table 1) and displayed a similar re-lationship as plantδ15N (Fig. 3). A negative relationship ex-isted betweenδ15N and MAT (P =0.008) andδ15N was pos-itively correlated with MAP, but not significantly at the 95 % level (P=0.07). Correlations amongstδ15N and MAT and MAP were not observed in the larger vegetation sample set
0.0
0.2
0.4
0.6
0.8
-6
-4
-2
0
2
4
6
8
Slope (sin
θ)
δ
15
N (‰)
P. morrisonicola Cymbopogon sp.
Soil
r2 = 0.31
P = 0.003
r2 = 0.32
P = 0.02
Fig. 3.Relationship between topographic slope (sinθ) andδ15N of soil (squares) and plants (triangles,P. morrisonicolain dark grey andCymbopogonsp. in light grey) from the Central Range, Tai-wan. Analytical uncertainty is smaller than the point size. The lin-ear fit to the soil (dashed line) and plant (black line) data are shown with 95 % confidence bands shaded grey, returning identical gradi-ents, with soilδ15N=(−8±3)×Slope+(8.0±1.6) ‰ and plant δ15N=(−9±3)×Slope+(3.4±1.3) ‰.
(Table 2). The statistical link between these variables in the soil dataset may be the product of the negative correlation be-tween MAT and slope at the soil sites (Table 1). It can explain why the soil δ15N–MAP and δ15N–MAT trends are oppo-site to those generally observed elsewhere in tropical forests (Amundson et al., 2003; Craine et al., 2009).
5 Discussion
5.1 Constraints on rates of N flux from the ecosystem
The balance between the input of N to an ecosystem and the rate of N loss from soil places a first-order control on the amount of bioavailable N for productivity (Fig. 1). Con-straining the fluxes of N and the operation of this mass bal-ance is important for understanding how an ecosystem may respond to ongoing anthropogenic perturbation of the N cy-cle (Matson et al., 1999; Zaehle et al., 2011). In our samples, the soil C/N decreases with increasing14C age over centuries to millennia (Table 1). This suggests retention of N relative to C in soils across this mountain forest, consistent with het-erotrophic consumption of organic compounds. However, it does not preclude N loss from the soil, and here we seek to model the observed C/N evolution to provide insight to the rates of N loss to the environment.
A multi-component, multi-pool soil model (Trumbore, 1993; Baisden et al., 2002a, b; Manzoni and Porporato, 2009) is not appropriate here, because the soil C/N and14C mea-surements were made on homogenised, bulk surface soil, in-tegrating a range of grain sizes and organic-mineral aggre-gates. In addition, soils in the forested mountains of Taiwan are thin, with the base of the saprolite typically at<0.8 m below surface (Tsai et al., 2001). As such, transport of or-ganic material to deeper horizons can be considered negligi-ble (cf. Yoo et al., 2006). Therefore, we use a single pool soil model, which describes the evolution of bulk soil N as a mass balance of net inputs and outputs (Fig. 1; Bren-ner et al., 2001). The soil N content over a constant depth (Ns, t N km−2) evolves at a rate (t N km−2yr−1):
dNs
dt =Iex−kex·Ns, (1)
whereIex (t N km−2yr−1)is the sum of external N inputs to the ecosystem (wet and dry N deposition and N fixation) andkexis the rate constant of the ensemble of pathways of N loss (inorganic and organic, gaseous, dissolved and partic-ulate) to the environment (yr−1). Here we do not attempt to de-convolve thesekexpathways using C/N alone; instead we useδ15N to examine them in more detail in Sect. 5.2. The model assumes that internal N cycling between soil and veg-etation (Fig. 1) operates at a steady state. When considering periods shorter than the time required for soil N to turnover, ∼50–100 yr (Brenner et al., 2001), this assumption does not hold and the model should be adapted to include internal N cycling (e.g. Menge et al., 2009; Brookshire et al., 2012b) which can show marked inter-annual variability (e.g. Owen et al., 2003). However, for periods longer than this turnover time, the evolution of Ns is principally governed by the ex-ternal loss ratekex(Brenner et al., 2001; Menge et al., 2009), and Eq. (1) is adequate.
By analogy, the rate of change in soil organic C con-tent (Cs, t C km−2) through time can also be described
by mass balance. Here, the soil input is by supply of plant-fixed carbon:
dCs
dt =js·Cp−jex·Cs, (2)
where js (yr−1) is the rate constant of organic C supply from plants with a C content Cp (t C km−2) andjex (yr−1) is the rate constant of C loss from soils, adapted from Bais-den et al. (2002a). Again, we consider centennial to millen-nial timescales (>soil C turnover time) for which a steady state assumption is relevant, where Cp≈Csfor tropical forest (Dixon et al., 1994). The mass balance can then be simplified to
dCs
dt = −jnet·Cs, (3)
where the variablejnet(yr−1) is the net C loss rate constant. Ns and Cs are modelled at 50 yr intervals to exam-ine the average rate of N loss from soil integrated over the full dataset. This approach is comparable to consider-ing N export at the catchment-scale, where rivers integrate over large areas>100 km2 (Lewis et al., 1999). The start-ing condition is set by the three “modern” soils (assigned 14C age=5±36 yr) with an average C/N=12 (Table S3). Changes in 14C abundance are attributed fully to radioac-tive decay of the bulk soil C pool through time, with a de-cay constant of 1.2097×10⁻⁴yr−1 (Godwin, 1962), and the 50-yr resolution of the model means that bomb-14C in-put is not considered (Levin and Hesshaimer, 2000). The variables Iex, knet and jnet are then used to minimise the misfit between modelled and measured soil C/N with age (Fig. 4). Best fit solutions have co-variation ofjnetandkex for a given Iex. For Iex=0 t N km−2yr−1, the minimised misfit solutions of the model yield a linear relationship, kex=1.017×jnet−0.00033, with a relative C/N misfit of 19.9 %. ForIex >0 t N km−2yr−1, model solutions exhibit a positive non-linear relationship betweenjnetandkex.
14
12
10
8
6
4
2
0
0 1000 2000 3000 4000
S
oil C/N
Soil
14C age (yr)
Iex = 0.3 tN km-2 yr-1
kex = 1.1x10⁻³ yr-1
jnet = 4.8x10⁻⁴ yr-1
r2= 0.63; P = 0.0006
Best fit variables:
Fig. 4.C/N and 14C age for soil organic matter from the Cen-tral Range, Taiwan. Analytical uncertainty is indicated by grey whiskers if larger than the point size. A mass balance model (black line, Eqs. 1 and 3) describes the first-order trend in the data and predicts an integrated average N loss rate constant (kex) across the dataset, with a minimum misfit parameterisation as shown (r2=0.63;P=0.0006).
jnet=4.8×10⁻⁵yr−1, the fit to the data is strong (r2=0.63; P=0.0006), predictingkex=1.1×10⁻³yr−1 (Fig. 4). The dependence of kex on Iex can be explored using the quoted range from tropical forests, returning best fit solu-tions ofkex=0.8×10⁻³yr−1(Iex=0.2 t N km−2yr−1) and kex=1.5×10⁻³yr−1(Iex=0.4 t N km−2yr−1).
The model predictions for the average rate of N loss to the environment,kex, are consistent with the range of N loss con-stants in forest ecosystems worldwide (Brenner et al., 2001). However, it is worth remembering that our estimate ofkexis an average for the whole dataset, derived from soils spread over>100 km (Fig. S1). Deviation from the best fit model (Fig. 4) may reflect local variability in N loss rate around this mean, which is to be expected, but it could also de-rive from the assumptions applied in the modelling. First, the model misfit was minimised to the measured soil C/N (y-axis), which is justified if the measured14C ages (x-axis) result only from aging. However, physical erosion can result in thin soils which contain14C-depleted fossil organic C de-rived from sedimentary bedrock (Keller and Bacon, 1998). In Taiwan, bedrocks have Corg∼0.3 % which is incompletely oxidized in the environment (Hilton et al., 2011b). Addition of fossil organic C could increase the14C age of soil sam-ples, affecting the oldest14C ages with Corgvalues close to bedrock (Table S3). While mixing of fossil organic C, with C/N∼5–10 and no resolvable14C (Hilton et al., 2010), with
recent biomass is not consistent with the overall trend in the data (Fig. 4), its input could decrease the gradient between C/N and age. This would also occur if any pre-aged POC existed within the soil. Neither of these scenarios are con-sidered by the single pool model (Trumbore, 1993), but they can lead to an underestimation of the rate of change of C/N with time, loweringkex. Second, the assumption of a steady state exchange between plants and soil (Eqs. 1 and 3) is prob-ably not appropriate for young soils (<100 yr,n=4), which are prone to progressive N accumulation early in succession (Brenner et al., 2001; Walker and Shiels, 2008). By not ac-counting for this additional supply,kexis underestimated by the model at these young sites, but this assumption should not affect the soil C/N versus age relation on longer, multi-centennial timescales (Fig. 4).
Mindful of these caveats,kexcan be converted to an ab-solute N loss from soils and compared to measured N loss rates. The C stock of soil litter in mixed conifer forests in Taiwan has been measured as 7±2×10³t C km−2(Chang et al., 2006), and for the C/N of modern soil organic mat-ter (C/N=12), the corresponding soil N stock would be 570±160 t N km−2. For this stock, the modelled best fitkex values (0.8–1.5×10⁻³yr−1) are equivalent to an initial N loss rate of 0.5–0.9 t N km yr−1 (Fig. 4). This is within the lower range of contemporary estimates of N exports at the river catchment scale, which put leaching of dissolved inor-ganic N at 0.66±0.12 t N km−2yr−1(Kao et al., 2004) and PN export up to∼1 t N km−2yr−1(Sect. 2).
At present, estimated N losses from Taiwanese forests are exceeded by the estimated N deposition of ∼1.8 t N km−2yr−1 from local sources and emissions from continental Asia (Kao et al., 2004). If we consider additional N inputs though symbiotic biological fixation (Vitousek and Howarth, 1991), a contemporary net input of at least ∼0.2 t N km−2yr−1 is supplied to the soil. In contrast, the modelled fit to the 14C and C/N trend suggests that the mountain forest of Taiwan operated with a much closer bal-ance between inputs and outputs prior to the anthropogenic increase in N input (Fig. 4). This finding is consistent with observations from tropical forests elsewhere (Matson et al., 1999) and indicates that N saturation could increasingly af-fect the Taiwan mountain forest ecosystem if anthropogenic N deposition persists (Aber et al., 1989). Denitrification of a fraction of this accumulated N may produce regionally significant emissions of the greenhouse gas N2O (e.g. Houlton et al., 2006) and is a poorly understood flux which warrants further assessment in Taiwan (Kao et al., 2004).
5.2 Insight to pathways of N loss fromδ15N
N loss (e.g. dissolved, gaseous, particulate) depending upon their climatic and geomorphic conditions. While it is diffi-cult to resolve this with C/N, the stable isotope values (δ15N) of soils and plants can provide insight. Theδ15N records an integration of N inputs and outputs, and their isotopic sig-natures (Fig. 1) andδ15N values are sensitive to the modes of N loss and the rates at which they occur (Mariotti et al., 1980; H¨ogberg and Johannisson, 1993; Brenner et al., 2001; Robinson, 2001; Houlton et al., 2006; Hobbie and H¨ogberg, 2012). Hence, we useδ15N values from Taiwan to further interrogate the N cycle operating in this mountain forest.
The decrease in C/N of soil organic matter with soil age is not accompanied by an increase inδ15N values (Table 1). Therefore, the∼6 ‰ range inδ15N recorded in both soil and plant organic matter is not simply the isotopic expression of accumulated mineral N losses with ecosystem age (cf. Mar-tinelli et al., 1999; Brenner et al., 2001). Instead, the variabil-ity inδ15N, which is statistically correlated with slope (Ta-bles 1 and 2), must reflect some combination of (i) variable rates orδ15N of external inputs (Kendall, 1998; Hobbie et al., 1999), and/or (ii) variable rates of fractionating and non-fractioning pathways of N loss (Fig. 1). First, if we consider rates of N input by deposition, it is known that spatial pat-terns can be complicated in mountainous terrain (Weathers et al., 2006). These authors found that elevation and forest canopy height best explained the spatial pattern of N deposi-tion, with slope angle playing a minor role. In addideposi-tion, we are not aware of any study in which mycorrhizal fungi distri-bution and N fixation are linked to hillslope angle (Hobbie et al., 1999; Vitousek et al., 2002). Thus, although we did not measure isotope values of inputs, it is difficult to identify a process by which either the rate of N deposition or its iso-topic composition depends systematically on slope, and we still require a mechanistic explanation for the observed in soil and plantδ15N (Fig. 3).
A strong candidate to explain the trends in the data is the loss of PN which operates as a function of slope angle. Hillslope angle is a principal control on the rate of phys-ical erosion (Gilbert, 1909; Culling, 1960; Roering et al., 2001; Dietrich et al., 2003). The stability of hillslope ma-terials is determined by the balance of the down-slope com-ponent of its weight and the frictional resistance to motion aided by the slope-normal component of the weight. As the angle increases, this balance shifts in favour of the force driv-ing motion. Therefore, the rate of soil erosion increases with slope (sinθ) for both overland flow and mass wasting pro-cesses such as landsliding (Dietrich et al., 2003; Yoo et al., 2006), and the local topographic gradient should rule the ex-port of PN by soil erosion. Therefore, in analogy to other studies (e.g. H¨ogberg and Johannisson, 1993; Martinelli et al., 1999; Robinson, 2001; Houlton et al., 2006) we seek to explain the variability inδ15N values by gradients in the processes that remove N.
If erosion does not preferentially remove N from plants over soil organic matter, PN loss should impart no direct iso-topic fractionation on an ecosystem. However, it can change the bulk isotopic fractionation that the ecosystem experiences due to N loss, and control soil and plantδ15N values (Brenner et al., 2001). To assess whether PN loss can explain the vari-ability inδ15N with slope (Fig. 3), the mass balance model (Eq. 1) can be used to examineδ15N for a given range ofkex values. The solutions at steady state can provide constraint on the sign of theδ15N change and the maximum expected shifts (Brenner et al., 2001). In this case, the15N/14N ratio of the ecosystem (Rs)is modified from the isotopic ratio of in-puts (Rex)by a bulk fractionation factor (αex) induced bykex:
Rs= Rex αex
. (4)
The rate constant kex (Eq. 1) includes processes that frac-tionate isotopes and others that do not (Fig. 1). Fractionating losses can be accounted for by the rate constantkf (yr−1). These include gaseous loss by denitrification and hydrologi-cal leaching of nitrified products, which are generally consid-ered to leave the residual15N enriched by a fractionation fac-torαf<1 (Handley and Raven, 1992). Non-fractioning loss is considered here as PN export (kE, yr−1) withαE=1. By definition then,kex=kf+kE(Fig. 1), and soαexcan be de-termined from the relative contribution of fractionating and non-fractioning losses to total N loss:
αex=αf· kf kex
+αE· kE kex
. (5)
Hence, in the absence of any significant change inRex,Rs (Eq. 4) can vary due to changes in the nature of fractionating losses (αf), or in the relative importance of non-fractioning pathways to the total N loss (kE/ kex).
Steady state values for Rs can be calculated using Rex=0.0036765 (atmosphere) and kex=1×10⁻³yr−1 rived from the best fit modelled solution of the C/N de-crease with14C age (Fig. 4). The observed range in ecosys-tem δ15N (∼6 ‰) is returned forαexin the range 0.994 to
6
4
2
0
S
oil δ
15
N (‰)
Particulate N loss,
k
E(10
-3yr
-1)
0.0 0.6 1.0
kex = kf + kE
Rex = 0.0036765 (0 ‰)
αE = 1; αf = 0.994
k
ex constan
t
k
exvariable
0.8
0.2 0.4
Fig. 5.Mass balance model (Eqs. 1 and 4) predictions of soilδ15N at steady state for a forest experiencing N loss by physical erosion of particulate N, at a loss ratekE(yr−1). Lines show model scenarios where the total N loss ratekex(yr−1) remains constant (black line) and increases (dashed line) askEincreases. The isotopic ratio of inputs (Rex) and the fractionation factor of fractioning losses (αf) are kept constant with values as shown.
Tables 1 and 2). Therefore PN loss provides a process-based explanation for the first-order patterns in the data.
We can also use the mass balance model to examine how other N loss processes which fractionate isotopes,kf(Fig. 1), might vary with slope and impact soil δ15N. The isotopic signatures of fractionating loss processes have not been as-sessed in Taiwan (Kao et al., 2004; Huang et al., 2012), but the assumed αf=0.994 is well within the published range of values (Handley and Raven, 1992; Brenner et al., 2001). Gaseous loss can occur under anaerobic conditions in water-logged soils (e.g. Houlton et al., 2006), which are more likely on low slopes. This would imply a decrease in kf where slopes are steepest. In fact, we model this in the “kexconstant” scenario described above (Fig. 5), wherekf de-creases with increasing slope and PN loss becomes relatively more important. However, increased solute leaching on steep slopes could increasekf, and high rates of dissolved N loss have been observed in mountain forests elsewhere (Brook-shire et al., 2012a; Ohte, 2012). To consider these competing controls onkf, we also model a scenario wherekf remains constant at 1×10⁻³yr−1, while kE increases from 0 yr−1 to 1×10⁻³yr−1(i.e. “kexvariable”). This predicts a nega-tive reciprocal relationship betweenkE and ecosystemδ15N (Fig. 5). A reciprocal trend betweenδ15N and slope is also consistent with the soil (r2=0.35;P <0.0001) but not the plant data (r2=0.12; P=0.07). In this case it is also
dif-0.0
0.2
0.4
0.6
0.8
-6
-4
-2
0
2
4
6
8
Slope (sin
θ)
δ
15
N (‰)
Peru Soil
Peru Plant
Californian Soil
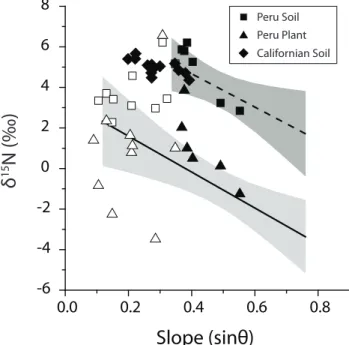
Fig. 6.δ15N and slope for soil and plant organic matter from sites in Peru (squares and triangles) and California (diamonds). Lines and shaded regions show linear fits to the soil and plant samples from Taiwan (Fig. 3). Below sinθ=0.35 (∼20◦), erosion rate increases relatively slowly with slope angle. Above this threshold (which re-lates to thresholds in the activity of erosion processes), soil erosion rates increase rapidly, with a much steeper relationship between slope and erosion rate (Roering et al., 1999). For the Peruvian data, filled symbols are those where sinθ >0.35 (see Sect. 5.3).
ficult to model the observed variability inδ15N values. The “kexconstant” scenario describes better the first-order pattern in the data (Fig. 3). These findings support the hypothesis of marked heterogeneity in the source of riverine dissolved N from ecosystems (Hedin et al., 2009; Brookshire et al., 2012a) and extend it to PN loss pathways (Fig. 5). It also im-plies that N loss pathways which fractionate N isotopes may decrease on steep slopes where PN loss dominates export, a geomorphic control on inorganic N pools that warrants fur-ther investigation.
5.3 A common geomorphic control onδ15N
in the literature (e.g. Brookshire et al., 2012a). Our process-based explanation of the trends in the data should not be unique to Taiwan, but also should affect other mountain for-est ecosystems around the world. This hypothesis can be tested more widely with additional field data from different biomes and experimental studies of N loss which are out-side the scope of the present study. Herein, we seek existing datasets to evaluate the existence of a possible common geo-morphic control onδ15N.
To date, many ecological studies using δ15N have at-tempted to eliminate slope as an environmental variable when collecting soil and plant samples (e.g. Martinelli et al., 1999; Houlton et al., 2006). In contrast, Townsend-Small et al. (2005) applied a sampling strategy similar to ours, col-lecting bulk soils and plant organic matter along an elevation transect in the Peruvian Andes. They reported a large range in soil and plant δ15N values, with no significant link be-tweenδ15N and temperature (elevation). We reinterpret their data with additional measurements of the local slope at sam-ple sites obtained from the SRTM digital elevation model (90×90 m grid). Further, we also consider published soil data from Marin County, California, where the inverse of slope angle (a proxy for residence time) was used to explain variability in soilδ15N (Amundson et al., 2003).
The Peruvian and Californian soil data are broadly con-sistent with the findings from Taiwan (Fig. 6). The Cal-ifornian data exhibit a significant negative correlation be-tween slope andδ15N (P =0.007,n=14) which is stronger than that reported for the inverse of slope (Amundson et al., 2003). On slopes steeper than sinθ=0.35, the Peru-vian soil data (Townsend-Small et al., 2005) also exhibit a significant negative correlation between slope and δ15N (P=0.004,n=7). Plant samples from multiple species also mirror this trend (P=0.05, n=6). Like Taiwan, both lo-cations experience tectonic convergence, which builds steep topography and promotes high physical erosion rates (Bren-ner et al., 2001; Townsend-Small et al., 2008). However, on slopes sinθ <0.35 the link between soil and plantδ15N val-ues and slope is not significant in the Andean forest (Fig. 6). The switch in behaviour is consistent with the threshold be-haviour of geomorphic processes (Roering et al., 1999) and the difference in overall erosion rates between these settings. In headwater catchments of the Andes, physical erosion rates have been estimated at 0.2–0.4 mm yr−1(Safran et al., 2005), 10–20 times lower than those of the Central Range, Tai-wan (Dadson et al., 2003). Above∼20◦, the erosion rate increases more rapidly with slope than below this threshold (Roering et al., 1999, 2001). This means that if catchment-wide erosion rates are lower, the reduction in PN loss should be most pronounced on the shallow slopes below this thresh-old. As a consequence,kE only becomes significant for the N mass balance on the steepest slopes with the highest ero-sion rates (when sinθ >0.35). On shallower slopes (angle <20◦), variability in pathways of fractionating loss (kf and αf)or the isotopic expression of N inputs can controlδ15N
values as they are thought to do elsewhere (e.g. Hobbie at al., 1999; Houlton et al., 2006). Nevertheless, the commonality between our findings (Fig. 3), the Californian data and steep Andean forest (Fig. 6) suggests that PN removal by physical erosion and its export by mountain rivers can set soilδ15N, and is a major loss term in the N cycle of mountain forests.
PN loss provides a strong coupling between climate and N cycling, which has not previously been recognised (Amund-son et al., 2003; Hobbie and H¨ogberg, 2012). It arises be-cause physical erosion rates and erosion of biomass from mountain forest are closely linked to the amount and variabil-ity of precipitation and runoff (Dadson et al., 2003; Milliman and Farnsworth, 2011; Hilton et al., 2012). Our findings sug-gest that a change to a wetter and/or stormier, more erosive climate may impact the N cycle of forests by enhanced PN loss. However, in Taiwan this effect is subsumed at present by significant anthropogenic N inputs, which exceed PN export by physical erosion, explaining the combination of high N export rates and inferred N rich conditions in this ecosystem (Kao et al., 2004). Under natural conditions, PN export may reinforce the coupling of N cycling and climate in moun-tain forests, providing a broader context and motivation for further studies on the impact of erosion on N cycling at the catchment scale.
Supplementary material related to this article is available online at: http://www.biogeosciences.net/10/ 1693/2013/bg-10-1693-2013-supplement.pdf.
Acknowledgements. Radiocarbon measurements were funded by the National Environmental Research Council (NERC), UK, Allo-cation # 1228.0407. We thank: M. C. Chen and Taroko National Park for access to research sites; H. Chen (National Taiwan Univer-sity) for logistical support; J. Rolfe (Godwin Institute, University of Cambridge) and C. Bryant (NERC, Radiocarbon Facility) for analytical support; A. Townsend-Small and R. Amundson for providing published data; and E. Tanner and D. Calmels for discussions prior to submission. We thank two anonymous referees for their comments which helped to improve the manuscript.
Edited by: N. Ohte
References
Aber, J. D., Nadelhoffer, K. J., Steudler, P., and Melillo, J. M.: Ni-trogen saturation in northern forest ecosystems, BioScience, 39, 378–386, doi:10.2307/1311067, 1989.
Baisden, W. T., Amundson, R., Brenner, D. L., Cook, A. C., Kendall, C., and Harden, J. W.: A multiisotope C and N modeling analysis of soil organic matter turnover and trans-port as a function of soil depth in a California annual grass-land soil chronosequence, Global Biogeochem. Cy., 16, 1135, doi:10.1029/2001GB001823, 2002a.
Baisden, W. T., Amundson, R., Cook, A. C., and Brenner, D. L.: Turnover and storage of C and N in five density fractions from California annual grassland surface soils, Global Biogeochem. Cy., 16, 1117, doi:10.1029/2001GB001822, 2002b.
Brenner, D. L., Amundson, R., Baisden, W. T., Kendall, C., and Harden, J.: Soil N and15N variation with time in a California an-nual grassland ecosystem, Geochim. Cosmochim. Ac., 65, 4171– 4186, doi:10.1016/S0016-7037(01)00699-8, 2001.
Brodie C. R., Heaton, T. H. E., Leng, M. J., Kendrick, C. P., Casford, J. S. L., and Lloyd, J. M.: Evidence for bias in measuredδ15N values of terrestrial and aquatic organic materials due to pre-analysis acid treatment, Rapid Commun. Mass Sp., 25, 1089– 1099, doi:10.1002/rcm.4970, 2011.
Brookshire, E. N. J., Hedin, L. O., Newbold, J. D., Sigman, D. M., and Jackson, J. K.: Sustained losses of bioavailable nitro-gen from montane tropical forests, Nat. Geosci., 5, 123–126, doi:10.1038/ngeo1372, 2012a.
Brookshire, E. N. J., Gerber, S., Menge, D. N. L., and Hedin, L. O.: Large losses of inorganic nitrogen from tropical rain-forests suggest a lack of nitrogen limitation, Ecol. Lett., 15, 9–16, doi:10.1111/j.1461-0248.2011.01701.x, 2012b.
Chang, Y. F., Lin, S. T., and Tsai, C. C.: Estimation of soil organic carbon storage in a Cryptomeria plantation forest of northeastern Taiwan, Taiwan J. Forest. Sci., 21, 383–393, 2006.
Craine, J. M., Elmore, A. E., Aidar, M. P. M., Bustamante, M., Daw-son, T. E., Hobbie, E. A., Kahmen, A., Mack, M. C., McLauch-lan, K. K., Michelsen, A., Nardoto, G. B., Pardo, L. H., Pe˜nuelas, P., Reich, P. B., Schuur, E. A. G., Stock, W. D., Templer, P. H., Virginia, R. A., Welker, J. M., and Wright, I. J.: Global patterns of foliar nitrogen isotopes and their relationships with climate, mycorrhizal fungi, foliar nutrient concentrations, and nitrogen availability, New Phytol., 183, 980–992, 2009.
Culling, W. E. H.: Analytical theory of erosion, J. Geol., 68, 336– 344, 1960.
Dadson, S. J., Hovius, N., Chen, H., Dade, W. B., Hsieh, M. L., Willett, S. D., Hu, J. C., Horng, M. J., Chen, M. C., Stark, C. P., Lague, D., and Lin, J. C.: Links between erosion, runoff variabil-ity and seismicvariabil-ity in the Taiwan orogen, Nature, 426, 648–651, doi:10.1038/nature02150, 2003.
Delwiche, C. C. and Steyn, P. L.: Nitrogen isotope fractionation in soils and microbial reactions, Environ. Sci. Technol., 4, 929–935, doi:10.1021/es60046a004, 1970.
Dietrich, W. E., Bellugi, D. G., Sklar, L. S., Stock, J. D., Heimsath, A. M., and Roering, J. J.: Geomorphic transport laws for predict-ing landscape form and dynamics prediction in geomorphology, in: Prediction in geomorphology, edited by: Wilcock, P. R. and Iverson, R. M., American Geophysical Union, Geoph. Monog. Series, 135, 1–30, doi:10.1029/135GM09, 2003.
Dixon, R. K., Brown, S., Houghton, R. A., Solomon, A. M., Trexler, M. C., and Wisniewski, J.: Carbon pools and flux of global forest ecosystems, Science, 263, 185–190, doi:10.1126/science.263.5144.185, 1994.
Evans, J. R.: Photosynthesis and nitrogen relationships in leaves of C-3 plants, Oecologia, 78, 9–19, doi:10.1007/BF00377192, 1989.
Gilbert, G. K.: The convexity of hilltops, J. Geol., 17, 344–350, 1909.
Godwin, H.: Half-life of Radiocarbon, Nature, 195, p. 984, doi:10.1038/195984a0, 1962.
Handley, L. L. and Raven, J. A.: The use of natural abundance of nitrogen isotopes in plant physiology and ecology, Plant Cell En-viron., 15, 965–985, doi:10.1111/j.1365-3040.1992.tb01650.x, 1992.
Hatten, J. A., Go˜ni, M. A., and Wheatcroft, R. A.: Chemical charac-teristics of particulate organic matter from a small mountainous river in the Oregon Coast Range, USA, Biogeochem., 107, 43– 66, doi:10.1007/s10533-010-9529-z, 2012.
Hedin, L. O., Armesto, J. J., and Johnson, A. H.: Patterns of nutrient loss from unpolluted, old-growth temperate forests – Evaluation of biogeochemical theory, Ecology, 76, 493–509, doi:10.2307/1941208, 1995.
Hedin, L. O., Brookshire, E. N. J., Menge, D. N. L., and Barron, A. R.: The nitrogen paradox in tropical forest ecosystems, Annu. Rev. Ecol. Evol. S., 40, 613–635, 2009.
Hilton, R. G., Galy, A., Hovius, N., Chen, M. C., Horng, M. J., and Chen, H.: Tropical-cyclone-driven erosion of the ter-restrial biosphere from mountains, Nat. Geosci., 1, 759–762, doi:10.1038/ngeo333, 2008a.
Hilton, R. G., Galy, A., and Hovius, N.: Riverine particu-late organic carbon from an active mountain belt: Impor-tance of landslides, Glob. Biogeochem. Cy., 22, GB1017, doi:10.1029/2006GB002905, 2008b.
Hilton, R. G., Galy, A., Hovius, N., Horng, M. J., and Chen, H.: The isotopic composition of particulate organic carbon in mountain rivers of Taiwan, Geochim. Cosmochim. Ac., 74, 3164–3181, doi:10.1016/j.gca.2010.03.004, 2010.
Hilton, R. G., Meunier, P., Hovius, N., Bellingham, P., and Galy, A.: Landslide impact on organic carbon cycling in a tem-perate montane forest, Earth Surf. Processes, 36, 1670–1679, doi:10.1002/esp.2191, 2011a.
Hilton, R. G., Galy, A., Hovius, N., Horng, M. J., and Chen, H.: Efficient transport of fossil organic carbon to the ocean by steep mountain rivers: An orogenic carbon sequestration mechanism, Geology, 39, 71–74, doi:10.1130/G31352.1, 2011b.
Hilton, R. G., Galy, A., Hovius, N., Kao, S. J., Horng, M. J., and Chen, H.: Climatic and geomorphic controls on the erosion of terrestrial biomass from subtropical mountain forest, Global Bio-geochem. Cy., 26, GB3014, doi:10.1029/2012GB004314, 2012. Hobbie, E. A. and H¨ogberg, P.: Nitrogen isotopes link mycorrhizal fungi and plants to nitrogen dynamics, New Phytol., 196, 367– 382, 2012.
Hobbie, E. A., Macko, S. A., and Shugart, H. H.: Patterns in N dynamics and N isotopes during primary succession in Glacier Bay, Alaska, Chem. Geol., 152, 3–11, doi:10.1016/S0009-2541(98)00092-8, 1999.
H¨ogberg, P. and Johannisson, C.:15N abundance of forests is cor-related with losses of nitrogen, Plant Soil, 157, 147–150, 1993. Houlton, B. Z., Sigman, D. M., and Hedin, L. O.:
Howarth, R. W., Billen, G., Swaney, D., Townsend, A., Jaworski, N., Lajtha, K., Downing, J. A., Elmgren, R., Caraco, N., Jordan, T., Berendse, F., Freney, J., Kudeyarov, V., Murdoch, P., and Zhu, Z. L.: Regional nitrogen budgets and riverine N & P fluxes for the drainages to the North Atlantic Ocean: Natural and human influ-ences, Biogeochemistry, 35, 75–139, doi:10.1007/BF02179825, 1996.
Huang, J.-C., Lee, T.-Y., Kao, S.-J., Hsu, S.-C., Lin, H.-J., and Peng, T.-R.: Land use effect and hydrological control on nitrate yield in subtropical mountainous watersheds, Hydrol. Earth Syst. Sci., 16, 699–714, doi:10.5194/hess-16-699-2012, 2012.
Kao, S. J. and Liu, K. K.: Stable carbon and nitrogen isotope systematics in a human-disturbed watershed (Lanyang-Hsi) in Taiwan and the estimation of biogenic particulate organic car-bon and nitrogen fluxes, Global Biogeochem. Cy., 14, 189–198, 2000.
Kao, S. J., Shiah, F. K., and Owen, J. S.: Export of dissolved inor-ganic nitrogen in a partially cultivated subtropical mountainous watershed in Taiwan, Water Air Soil Poll., 156, 211–228, 2004. Keller, C. K. and Bacon, D. H.: Soil respiration and
geores-piration distinguished by transport analyses of vadose CO2, 13CO
2 and 14CO2, Global Biogeochem. Cy., 12, 361–372, doi:10.1029/98GB00742, 1998.
Kendall, C.: Chapter 16: Tracing nitrogen sources and cycling in catchments, in: Isotope Tracers in: Catchment Hydrology, edited by: Kendall, C. and McDonnell, J. J., Elsevier Science B.V., Am-sterdam, 519–576, 1998.
K¨orner, C., Farquhar, G. D., and Roksandic, Z.: A global survey of carbon isotope discrimination in plants from high-altitude, Oe-cologia, 74, 623–632, 1988.
Larsen, M. C., Torres-Sanchez, A. J., and Concepcion, I. M.: Slope-wash, surface runoff and fine litter transport in forest and land-slide scars in humid tropical steeplands, Luquillo experimental forest, Puerto Rico, Earth Surf. Processes, 24, 481–502, 1999. Levin, I. and Hesshaimer, V.: Radiocarbon – A unique tracer of
global carbon dynamics, Radiocarbon, 42, 69–80, 2000. Lewis, W. M., Hamilton, S. R. and Saunders, J. F.: Rivers of
Northern South America, in: Ecosystems of the World: edited by: Rivers, Cushing, C. and Cummins, K., Elsevier, Dordrecht, Netherlands, 219–256, 1995.
Lewis, W. M., Melack, J., McDowell, W., McClain, M., and Richey, J.: Nitrogen yields from undisturbed watersheds in the Americas, Biogeochem., 46, 149–162, 1999.
Liu, C. P., Yeh, H. W., and Sheu, B. H.: N isotopes and N cycle in a 35-year-old plantation of the Guandaushi subtropical for-est ecosystem, central Taiwan, Forfor-est Ecol. Manag., 235, 84–87, doi:10.1016/j.foreco.2006.07.026, 2006.
Manzoni, S. and Porporato, A.: Soil carbon and nitrogen mineral-ization: Theory and models across scales, Soil Biol. Biochem., 41, 1355–1379, doi:10.1016/j.soilbio.2009.02.031, 2009. Mariotti, A.: Atmospheric nitrogen is a reliable standard for natural
15N abundance measurements, Nature, 303, 685–687, 1983.
Mariotti, A., Pierre, D., Vedy, J. C., Bruckert, S., and Guillemot, J.: The abundance of natural nitrogen 15 in the organic matter of soils along an altitudinal gradient, Catena, 7, 293–300, 1980. Martinelli, L. A., Piccolo, M. C., Townsend, A. R., Vitousek, P. M.,
Cuevas, E., McDowell, W., Robertson, G. P., Santos, O. C., and Treseder, K.: Nitrogen stable isotopic composition of leaves and soil: Tropical versus temperate forests, Biogeochemistry, 46, 45–
65, doi:10.1007/BF01007573, 1999.
Matson, P. A., McDowell, W. H., Townsend, A. R., and Vitousek, P. M.: The globalization of N deposition: ecosystem conse-quences in tropical environments, Biogeochemistry, 46, 67–83, doi:10.1007/BF01007574, 1999.
McClain, M. E. and Naimen, R. J.: Andean Influences on the Bio-geochemistry and Ecology of the Amazon River, BioScience, 58, 325–338, 2008.
McGroddy, M. E., Baisden, W. T., and Hedin, L. O.: Stoi-chiometry of hydrological C, N, and P losses across climate and geology: An environmental matrix approach across New Zealand primary forests, Global Biogeochem. Cy., 22, GB1026, doi:10.1029/2007GB003005, 2008.
Menge, D. N. L., Pacala, S. W., and Hedin, L. O.: Emer-gence and maintenance of nutrient limitation over multiple timescales in terrestrial ecosystems, Am. Nat., 173, 164–175, doi:10.1086/595749, 2009.
Milliman, J. D. and Farnsworth, K. L.: River Discharge to the Coastal Ocean: A Global Synthesis, Cambridge University Press, Cambridge, UK, doi:10.1017/CBO9780511781247, 2011. Ohte, N.: Implications of seasonal variation in nitrate export
from forested ecosystems: a review from the hydrological per-spective of ecosystem dynamics, Ecol. Res., 27, 657–665, doi:10.1007/s11284-012-0956-2, 2012.
Oren, R., Ellsworth, D. S., Johnsen, K. H., Phillips, N., Ewers, B. E., Maier, C., Sch¨afer, K. V. R., McCarthy, H., Hendrey, G., Mc-Nulty, S. G., and Katul, G. G.: Soil fertility limits carbon se-questration by forest ecosystems in a CO2-enriched atmosphere, Nature, 411, 469–472, doi:10.1038/35078064, 2001.
Owen, J. S., Wang, M. K., Wang, C. H., King, H. B., and Sun, H. L.: Net N mineralization and nitrification rates in a forested ecosys-tem in northeastern Taiwan, Forest Ecol. Manag., 176, 519–530, 2003.
Quinton, J. N., Govers, G., Van Oost, K., and Bardgett, R. D.: The impact of agricultural soil erosion on biogeochemical cycling, Nat. Geosci., 3, 311–314, doi:10.1038/ngeo838, 2010.
Robinson, D.: Delta N-15 as an integrator of the nitrogen cy-cle, Trends Ecol. Evol., 16, 153–162, doi:10.1016/S0169-5347(00)02098-X, 2001.
Roering, J. J., Kirchner, J. W., and Dietrich, W. E.: Evidence for nonlinear, diffusive sediment transport on hillslopes and impli-cations for landscape morphology, Water Resour. Res., 35, 853– 870, 1999.
Roering, J. J., Kirchner, J. W., and Dietrich, W. E.: Hillslope evolu-tion by nonlinear, slope-dependent transport: Steady-state mor-phology and equilibrium adjustment timescales, J. Geophys. Res., 106, 16499–16513, doi:10.1029/2001JB000323, 2001. Safran, E. B., Bierman, P. R., Aalto, R., Dunne, T., Whipple, K.
X., and Caffee, M.: Erosion rates driven by channel network in-cision in the Bolivian Andes, Earth Surf. Processes, 30, 1007– 1024, doi:10.1002/esp.1259, 2005.
Saunders, T. J., McClain, M. E., and Llerena, C. A.: The biogeo-chemistry of dissolved nitrogen, phosphorus, and organic carbon along terrestrial-aquatic flowpaths of a montane headwater catch-ment in the Peruvian Amazon, Hydrol. Process., 20, 2549–2562, doi:10.1002/hyp.6215, 2006.
Shearer, G., Duffy, J., Kohl, K.H., and Commoner, B.: A steady-state model of isotopic fractionation accompanying nitrogen transformations in soil, Soil Sci. Soc. Am. J., 38, 315–322, 1974. Smith, B. N. and Epstein, S.: 2 categories of13C/12C ratios for
higher plants, Plant Physiol., 47, 380–384, 1971.
Su, H. J.: Studies on the climate and vegetation types of the natural forests in Taiwan: 1. Analysis of the variation in climatic factors, Q. J. Chin. For., 17, 1–14, 1984.
Townsend-Small, A., McClain, M. E., and Brandes, J. A.: Contri-butions of carbon and nitrogen from the Andes Mountains to the Amazon River: Evidence from an elevational gradient of soils, plants, and river material, Limnol. Oceanogr., 50, 672–685, 2005. Townsend-Small, A., McClain, M. E., Hall, B., Noguera, J. L., Llerena, C. A., and Brandes, J. A.: Suspended sediments and organic matter in mountain headwaters of the Amazon River: Results from a 1-year time series study in the cen-tral Peruvian Andes, Geochim. Cosmochim. Ac., 72, 732–740, doi:10.1016/j.gca.2007.11.020, 2008.
Trumbore, S. E.: Comparison of carbon dynamics in tropical and temperate soils using radiocarbon measurements, Global Bio-geochem. Cy., 7, 275–290, 1993.
Tsai, C. C., Chen, Z. S., Duh, C. T., and Horng, F. W.: Prediction of soil depth using a soil-landscape regression model: A case study on forest soils in southern Taiwan, Proc. Natl. Sci. Counc. ROC(B), 26, 34–39, 2001.
Vitousek, P. M. and Howarth, R. W.: Nitrogen limitation on land and in the sea – how can it occur, Biogeochemistry, 13, 87–115, 1991.
Vitousek, P. M., Cassman, K., Cleveland, C., Crews, T., Field, C. B., Grimm, N. B., Howarth, R. W., Marino, R., Martinelli, L., Rastet-ter, E. B., and Sprent, J. I.: Towards an ecological understanding of biological nitrogen fixation, Biogeochemistry, 57, 1–45, 2002. Walker, L. W. and Shiels, A. B.: Post-disturbance erosion im-pacts carbon fluxes and plant succession on recent tropical landslides, Plant Soil, 313, 205–0216, doi:10.1007/s11104-008-9692-3, 2008.
Weathers, K. C., Simkin, S. M., Lovett, G. M., and Lindberg, S. E.: Empirical modeling of atmospheric deposition in mountain-ous landscapes, Ecol. Appl., 16, 1590–1607, doi:10.1890/1051-0761(2006)016[1590:EMOADI]2.0.CO;2, 2006.
West, A. J., Lin, C. W., Lin, T. C., Hilton, R. G., Liu, S.H., Chang, C. T., Lin, K. C., Galy, A., Sparkes, R. B., and Hovius, N.: Mo-bilization and transport of coarse woody debris to the oceans triggered by an extreme tropical storm, Limnol. Oceanogr., 56, 77–85, doi:10.4319/lo.2011.56.1.0077, 2011.
Yoo, K., Amundson, R., Heimsath, A., and Dietrich, W. E.: Spa-tial patterns of soil organic carbon on hillslopes: Integrating ge-omorphic processes and the biological C cycle, Geoderma, 130, 47–65, 2006.