Submitted19 February 2016
Accepted 26 June 2016
Published9 August 2016
Corresponding author
Gregory A. Lewbart, [email protected]
Academic editor
Min Zhao
Additional Information and Declarations can be found on page 15
DOI10.7717/peerj.2262 Copyright
2016 Collins et al.
Distributed under
Creative Commons CC-BY 4.0 OPEN ACCESS
A comparison of blood gases,
biochemistry, and hematology to
ecomorphology in a health assessment
of pinfish (
Lagodon rhomboides)
Sara Collins1, Alex Dornburg2, Joseph M. Flores2, Daniel S. Dombrowski3and
Gregory A. Lewbart4
1College of Veterinary Medicine, University of Georgia, Athens, GA, United States
2Research and Collections, North Carolina Museum of Natural Sciences, Raleigh, NC, United States 3Veterinary Services Unit, North Carolina Museum of Natural Sciences, Raleigh, NC, United States
4Clinical Sciences, North Carolina State University College of Veterinary Medicine, Raleigh, NC, United States
ABSTRACT
Despite the promise of hematological parameters and blood chemistry in monitoring the health of marine fishes, baseline data is often lacking for small fishes that comprise central roles in marine food webs. This study establishes blood chemistry and hematological baseline parameters for the pinfish Lagodon rhomboides, a small marine teleost that is among the most dominant members of near-shore estuarine communities of the Atlantic Ocean and Gulf of Mexico. Given their prominence, pinfishes are an ideal candidate species to use as a model for monitoring changes across a wide range of near-shore marine communities. However, pinfishes exhibit substantial morphological differences associated with a preference for feeding in primarily sea-grass or sand dominated habitats, suggesting that differences in the foraging ecology of individuals could confound health assessments. Here we collect baseline data on the blood physiology of pinfish while assessing the relationship between blood parameters and measured aspects of feeding morphology using data collected from 37 individual fish. Our findings provide new baseline health data for this important near shore fish species and find no evidence for a strong linkage between blood physiology and either sex or measured aspects of feeding morphology. Comparing our hematological and biochemical data to published results from other marine teleost species suggests that analyses of trends in blood value variation correlated with major evolutionary transitions in ecology will shed new light on the physiological changes that underlie the successful diversification of fishes.
SubjectsAquaculture, Fisheries and Fish Science, Bioinformatics, Marine Biology, Veterinary Medicine, Hematology
Keywords Sparidae, Hematology, Geometric morphometrics, Plasma biochemistry, Feeding
ecology
INTRODUCTION
2007) and differences in the efficiency of survey methods across taxa (Willis, Miller & Babcock, 2000), have stymied the ability to monitor changes in the physiological health of difficult to observe organisms. With current or potential future changes in marine species population dynamics increasingly linked to a host of contemporary threats including acidification (Orr et al., 2005; Hoegh-Guldberg et al., 2007;Fabry et al., 2008), warming (Stachowicz et al., 2002;Schiel, Steinbeck & Foster, 2004;Near et al., 2012a), or invasion of non native species (Thatje et al., 2005;Albins & Hixon, 2013), the ability to rapidly survey physiological changes in a minimally invasive manner holds promise for marine conservation efforts. In particular, collecting data on species that form critical links in marine food webs provides the baseline infrastructure for assessing, or forecasting, changes in the wake of environmental disaster, unexplained morbidity/mortality events, or disease outbreaks (Seaward, 1994;Lohner et al., 2001;Harvell et al., 2002).
In the Western Atlantic, pinfish (Lagodon rhomboides) are among the most dominant members of near-shore estuarine communities (Reid Jr, 1954;Hansen, 1969;Stoner, 1980), and are ubiquitous across a variety of habitats from New England to Florida as well as the northern Gulf of Mexico to the Yucatan Peninsula (Orth & Heck, 1980;Stoner & Livingston, 1984;Bonilla-Gómez et al., 2011). With seasonal abundances capable of altering the composition of estuarine epifaunal seagrass communities (Stoner, 1982), these fish form the prey base for many larger fishes at higher trophic levels (Schmidt, 1986;Bethea et al., 2006). This abundance has made pinfish a popular live bait used by recreational and commercial fisherman (Muncy, 1984;Adams et al., 1998) with high market demands driving the development of these fish as a potential new aquaculture species (DiMaggio et al., 2010;Ohs et al., 2010;DiMaggio, Broach & Ohs, 2013). Given their increasing economic importance, central role in near-shore marine food webs, and high abundances, pinfish are ideal candidates for comprehensive and minimally invasive health assessments from which to monitor changes in marine communities.
Although pinfish exhibit many of the hallmarks of a model species, there is also evidence for substantial differences in morphology and feeding ecology of these fishes at fine-spatial scales (Ruehl, Shervette & Dewitt, 2011). In particular, preferential colonization and settlement in sandy versus eel-grass habitats have been suggested to be a primary axis of selection in pinfish, driving pronounced changes in jaw morphology between geographically proximate sites (Ruehl, Shervette & Dewitt, 2011). These changes in jaw morphology occur across all size classes and reflect shifts in diet between seagrass and open sand-flat communities (Luczkovich, 1988;Levin, Petrik & Malone, 1997;Ruehl, Shervette & Dewitt, 2011). Since changes in feeding ecology have been demonstrated to affect blood parameters in other species such as seals (Thompson et al., 1997), this makes accounting for habitat specificity a potentially necessary step towards developing baseline health models for this species in any site comprised of heterogeneous habitat types.
morphometric analyses to test for possible relationships between ecomorphology and blood physiology. To the best of our knowledge, our study is the first to test for potential correlations between ecomorphology and blood physiology within a species of marine fish and provides a new perspective on baseline data for this ecologically important species.
MATERIALS AND METHODS
Ethics statement
This study was conducted at the North Carolina State University Center for Marine Sciences and Technology (CMAST) in Morehead City, North Carolina and approved by the IACUC ethics and animal handling protocol. All handling and sampling procedures were consistent with standard vertebrate protocols and veterinary practices.
Pinfish capture
Pinfish were captured in Bogue Sound (34.721734◦
N, −76.759587◦W) via lightweight angling gear. We aimed to capture 40 individual fish from this population for baseline estimates. This sampling strategy balanced budget constraints with our ability to capture the variance of quantified parameters and is similar to other health assessments of wild fish (Fazio et al., 2013). Thirty-seven fish were successfully landed with fight times lasting an average of less than 15 s. Once captured, the fish were placed in a 20 L plastic bucket with freshly aerated seawater from the collection site. The fish were immediately transported to the laboratory adjacent to our sampling site, with a transport time of less than 3 min. Once in the laboratory, fish were maintained in aerated seawater from the sample site in individual 20 L buckets until they were sedated with MS-222. Pinfish were left to acclimatize for 5 min after transport and before induction.
Blood sample collection and handling
All fish were sedated with buffered MS-222 (100 mg/L) and blood samples were collected intravenously from the coccygeal hemal arch into pre-coated, heparinized U-100 insulin syringes with BD Ultra-FineTMneedles in the 1/2 mL (50 unit) size. An average of 0.23 mL was obtained from each fish (standard deviation=0.05 mL, median=0.22 mL; seeData S1). The blood was then loaded into the CG-8+iSTAT cartridges (Abaxis Corporation, Union City, California, USA) and lactate analyzer (Nova Biomedical Corporation, Waltham, Massachusetts, USA) within 5 min of sample collection. All blood values were obtained within 5 min of sample collection.
Blood gas and biochemistry parameters
The biochemistry, blood gas, and electrolyte results were obtained using an iSTAT Portable Clinical Analyzer with CG8+cartridges. The iSTAT is a portable, handheld, battery-operated electronic device with the ability to measure a wide variety of chemistry, blood gas, and basic hematology parameters with only a few drops (0.095 mL) of whole, non-coagulated blood. The following parameters were measured and recorded: pH, lactate, pO2, pCO2, HCO32, Hct, Hb, Na, K, iCa, and glucose. The iSTAT device analyzed the blood at 37◦
calculated an independent set of corrections for pH based on the water temperature (T) at the time of sampling (27◦
C):
pHTC=pHM−0.011(T−37). (1)
Corrections for calcium were additionally made using the following equation from Mandelman & Skomal (2009):
iCaTC=iCaM 1+ −0.53
pHTC−pHM
(2)
ForEqs. (1)and(2), values measured from the iSTAT are denoted by an ‘‘M’’ subscript. Those that were manually temperature corrected by using the equations below are denoted by ‘‘TC’’ subscript. Following the guidelines byFriedrichs et al. (2012), reference intervals were computed using the robust method in the referenceInterval package in R, as Shapiro– Wilks tests (Shapiro & Wilk, 1965) suggested blood values to not follow the expectations of a Gaussian distribution. This distribution-independent method of calculating a reference interval is preferred for studies of wild populations with low samples sizes (Friedrichs et al., 2012). Prior to reference interval calculation, outliers were identified and removed using the method ofHorn et al. (2001). Confidence intervals of the upper and lower bounds of the reference intervals were calculated using 5000 bootstrap replicates.
Hematology
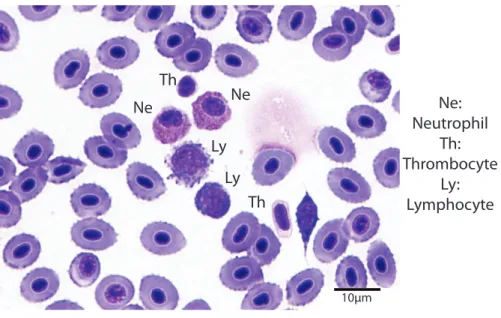
Hematocrit was determined using high-speed centrifugation of blood-filled hematocrit tubes with a Zipocrit Hematocrit Centrifuge (ThermoFisher Scientific, Philadelphia, PA). All white blood cell (WBC) count estimates were performed by the same technician, at a location on the slide where the cells were one layer thick, adjacent to one another (membranes touching), evenly distributed, and showed no signs of morphological changes (Newman, Piatt & White, 1997). White blood cell estimates were made by using a 100X objective lens with immersion oil, counting the number of white blood cells in 10 fields, calculating the average, and then multiplying the number of cells by 2,000 (Gaunt et al., 1995). Using a 100X objective lens with immersion oil, differential white blood cell counts were performed by examining 100 white blood cells on a peripheral smear stained with Wright-Giemsa stain and counting the number of lymphocytes, neutrophils, monocytes, and eosinophils (Fig. 1). The absolute cell count for each type of cell was calculated by multiplying the percentage of the type of cell by the overall WBC estimate (Newman, Piatt & White, 1997).
Specimen digitization and dissection
10µm Ne
Ne Th
Th Ly
Ly
Ne: Neutrophil
Th: Thrombocyte
Ly: Lymphocyte
Figure 1 Blood smear illustrating the different cell types (Wright-Giemsa stain, 1000X).
to accurately assign sex to each individual to test for the potential of sexual dimorphism in trait data. All specimens were subsequently deposited in the Ichthyological Collection of the North Carolina Museum of Natural Sciences (NCSM 81424).
Quantifying body shape
A.
Landmarks
Sliding Semi-Landmarks θ3
θ1
θ2
B.
Gape
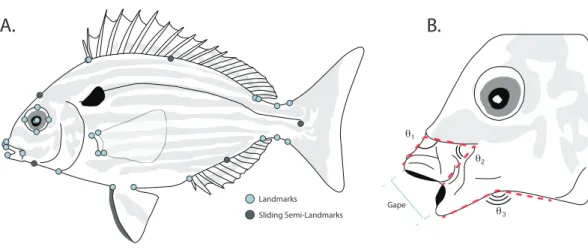
Figure 2 (A) Placement of homologous landmarks (light circles) and sliding semi-landmarks (dark circles). (B) Linear and angular jaw measurements taken from each individual.
caudal fin ray insertions, placed along the fin ray insertion margin; (4) at midpoint of the anal fin, placed along the body; and (5) at the midpoint between landmarks 21 and 22.
Linear measurements and angles of protrusion
Linear measurements were taken on each digitized specimen using the ImageJ software package (Abràmoff, Magalhães & Ram, 2004). For each digitized specimen, the images of corresponding to maximum jaw opening were used to measure standard length, maximum protrusion of the premaxilla, length of the mandible, and maximum gape size. Since pinfish ecomorphs are divided into groups that reflect changes in jaw morphology correlated with changes between bottom and water column feeding (Ruehl, Shervette & Dewitt, 2011), we additionally quantified three angles to assess the mouth position of each specimen during feeding (Fig. 2B). The downward angle of the upper jaw was measured drawing a line along the ventral margin of the head just dorsal to the maxilla, down the dorsal margin of the premaxilla, to a termination at the most anterior point of the premaxilla (Fig. 2B). Similarly, the angle of the lower jaw was measured by drawing a line along the ventral margin of each specimen from the operculum to the angular, with a connecting segment connecting to the most anterior point of the dentary along its ventral margin (Fig. 2B). Changes in the midpoint of the jaw position were quantified by drawing a line along the ventral margin of the head just dorsal to the maxilla from it’s most anterior to its most ventral point, with a connecting segment to the most ventral point of the premaxilla (Fig. 2B).
Statistical analysis
applied to coordinate data (Bastir & Rosas, 2006;Sidlauskas, 2008;Dornburg et al., 2011), a PCA is equivalent to a relative warps analysis with an alpha set to 0 (Rohlf, 1993;Birch, 1997).
For both the jaw dataset comprising linear and angle measurements, and the hematological dataset, data were log transformed and first regressed against log body size to account for the possibility of allometry. To account for the possibility of different allometric trends between males and females, regressions were conducted with the trait data separated by sex. A PCA was then conducted on the residuals of the regressions for each dataset. Morpho- and hematospaces were generated for each PCA by plotting the orthogonal eigenvectors that correspond with the major axes of shape variation, with convex hulls of the male and female data plotted to visualize the degree of overlap. For each class of data, a MANOVA was used to compare the PC axes that cumulatively summed to 95% of the variance between male and femaleLagodon rhomboides.
We built four models that compared the effect of (1) Feeding morphology; (2) Feeding morphology with size as a covariate; (3) Body shape (PC1); and (4) a null intercept-only model on each blood value trait. The fits of all models were simultaneously compared using general linear models (Nelder & Wedderburn, 1972) in conjunction with an information theoretic framework based on Akaike’s Information Criterion (Akaike, 1973) corrected for small sample size (Burnham & Anderson, 2002). Sample size corrected AICc weights (wi) and coefficients were estimated using Akaike weight based model averaging across all models. For feeding ecology, lower jaw angle was used as an alternative to qualitative assessment of how terminal versus inferior the mouth position was. All analyses were conducted in R using the libraries bbmle (Bolker, 2010) and MuMIn (Barton & Barton, 2015).
RESULTS
Hematological values
Tables 1and2display the biochemistry, blood gas, and hematology results for the 37 pinfish analyzed. We collected similar numbers of males and females (Table 1), with the values of all parameters overlapping between sexes (Fig. S1). In a few samples the iSTAT blood analyzer was unable to calculate the values for some of the parameters resulting in slightly smallern(Table 1). Also, for certain parameters, the iSTAT indicated values that exceeded the maximum detectable (Table 1). For the purpose of calculating a mean group value the maximum recordable value was used. While this yields a lower estimate of the mean than actually exists within the data, the low numbers of samples above the maximum recordable level (Table 1) likely produce only a minor skew to the estimated distribution of variation as measurable values remained well between the first and third quartiles (Table 1).
Statistical analysis of sexual dimorphism
Pinfish measured ranged in size between 93.8 and 168 mm (median=137.7 mm; 1st quartile =130.5 mm, 3rd quartile=150.6 mm) and in weight between 11 and 148 g (median=
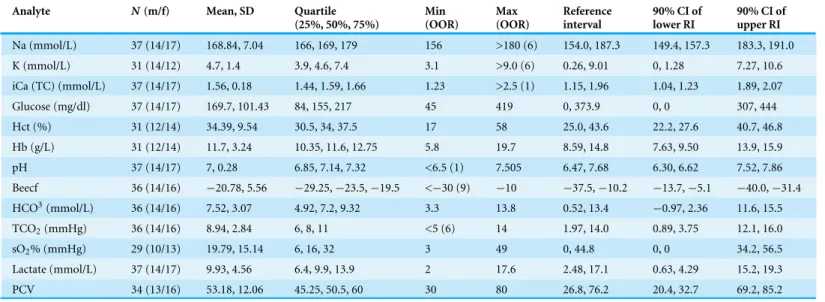
Table 1 Descriptive statistics of the blood gas and blood biochemical values collected.
Analyte N(m/f) Mean, SD Quartile (25%, 50%, 75%)
Min (OOR)
Max (OOR)
Reference interval
90% CI of lower RI
90% CI of upper RI
Na (mmol/L) 37 (14/17) 168.84, 7.04 166, 169, 179 156 >180 (6) 154.0, 187.3 149.4, 157.3 183.3, 191.0 K (mmol/L) 31 (14/12) 4.7, 1.4 3.9, 4.6, 7.4 3.1 >9.0 (6) 0.26, 9.01 0, 1.28 7.27, 10.6 iCa (TC) (mmol/L) 37 (14/17) 1.56, 0.18 1.44, 1.59, 1.66 1.23 >2.5 (1) 1.15, 1.96 1.04, 1.23 1.89, 2.07 Glucose (mg/dl) 37 (14/17) 169.7, 101.43 84, 155, 217 45 419 0, 373.9 0, 0 307, 444 Hct (%) 31 (12/14) 34.39, 9.54 30.5, 34, 37.5 17 58 25.0, 43.6 22.2, 27.6 40.7, 46.8 Hb (g/L) 31 (12/14) 11.7, 3.24 10.35, 11.6, 12.75 5.8 19.7 8.59, 14.8 7.63, 9.50 13.9, 15.9 pH 37 (14/17) 7, 0.28 6.85, 7.14, 7.32 <6.5 (1) 7.505 6.47, 7.68 6.30, 6.62 7.52, 7.86 Beecf 36 (14/16) −20.78, 5.56 −29.25,−23.5,−19.5 <−30 (9) −10 −37.5,−10.2 −13.7,−5.1 −40.0,−31.4 HCO3(mmol/L) 36 (14/16) 7.52, 3.07 4.92, 7.2, 9.32 3.3 13.8 0.52, 13.4 −0.97, 2.36 11.6, 15.5
TCO2(mmHg) 36 (14/16) 8.94, 2.84 6, 8, 11 <5 (6) 14 1.97, 14.0 0.89, 3.75 12.1, 16.0
sO2% (mmHg) 29 (10/13) 19.79, 15.14 6, 16, 32 3 49 0, 44.8 0, 0 34.2, 56.5
Lactate (mmol/L) 37 (14/17) 9.93, 4.56 6.4, 9.9, 13.9 2 17.6 2.48, 17.1 0.63, 4.29 15.2, 19.3 PCV 34 (13/16) 53.18, 12.06 45.25, 50.5, 60 30 80 26.8, 76.2 20.4, 32.7 69.2, 85.2
Notes.
N, number of samples; m, males; f, females; SD, standard deviation; Min, minimum value; Max, maximum value; OOR, number of samples outside of the recordable range of our instruments; RI, reference interval; CI, confidence interval.
Reference Intervals were truncated with a lower bound of zero to maintain biological realism in non-negative blood parameters.
Table 2 Descriptive statistics of the manually analyzed hematology parameters collected.
Cell type N(m/f) Mean (SD) Quartile (25%, 50%, 75%)
Min Max Reference interval
90% CI of lower RI
90% CI of upper RI
Total WBC/ul 30 (14/13) 25,788 (14,395.68) 16,200, 20,000, 32,400 6,800 73,200 0, 54,141 0, 1647 44,684, 68,230 Lymphocyte (%) 30 (14/13) 80.5 (15.96) 74.25, 87, 91 39 96 52.1, 123.0 39.5, 63.2 113.6, 135 Neutrophil (%) 30 (14/13) 17.1 (14.86) 7, 11, 22.5 2 54 0, 44.0 0, 0 34.0, 55.5 Monocyte (%) 17 (7/8) 3.8 (2.51) 2, 3, 5 0 11 0, 8.72 0,−5.78 6.23, 11.7
Notes.
N, number of samples; m, males; f, females; SD, standard deviation; Min, minimum value; Max, maximum value; RI, reference interval; CI, confidence interval. Reference Intervals were truncated with a lower bound of zero to maintain biological realism in non-negative blood parameters.
between jaw angle and size (Table S1), corresponding with previous work demonstrating substantial differences in jaw orientation in relation to habitat (not allometry) (Ruehl, Shervette & Dewitt, 2011).
Principle component analysis of the body shape data provided no evidence of sexual dimorphism. Principle component axes one through five respectively captured 24, 17, 7, 6, and 5 percent of the cumulative variance with the first axis of body shape change describing an elongation of the caudal peduncle coupled with an anterodorsal widening of the cranium (Fig. 3A). The second PC axis described changes in the anterior slope of the cranium coupled with an anteroposterior elongation of the body and cranium (Fig. 3A). There was no clear separation of male and female body shapes in morphospace with a MANOVA on the PC scores finding no significant effect of sex on body shape (Pillai’s trace=0.485,F=1.79, p=0.082).
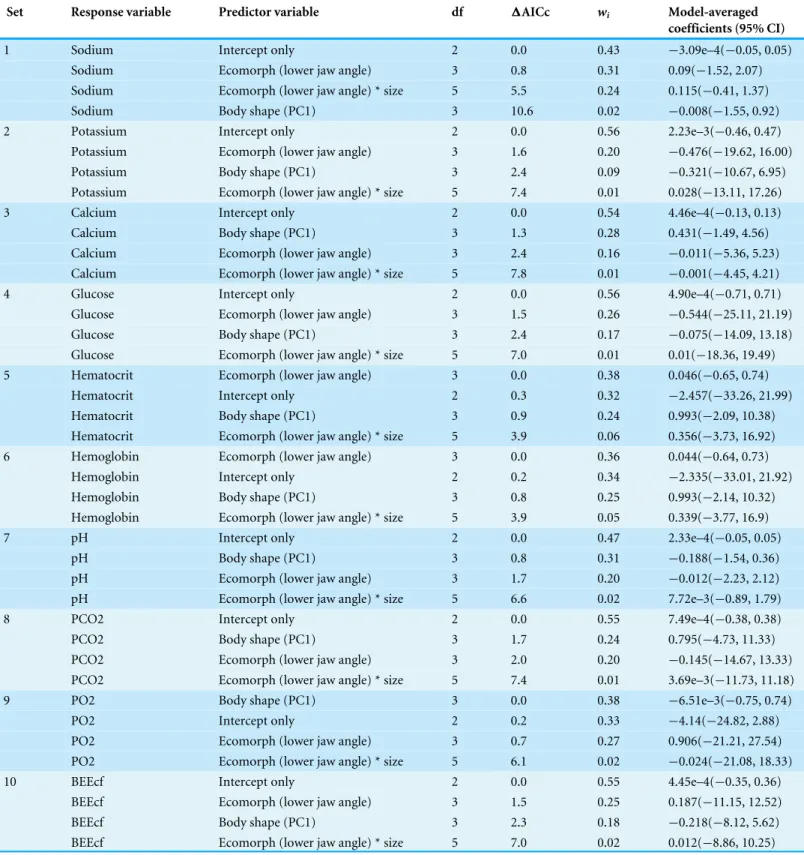
Table 3 Results of GLM fitting to test predictive power of morphological data on hematological parameters.
Set Response variable Predictor variable df 1AICc wi Model-averaged coefficients (95% CI)
1 Sodium Intercept only 2 0.0 0.43 −3.09e–4(−0.05, 0.05) Sodium Ecomorph (lower jaw angle) 3 0.8 0.31 0.09(−1.52, 2.07)
Sodium Ecomorph (lower jaw angle) * size 5 5.5 0.24 0.115(−0.41, 1.37) Sodium Body shape (PC1) 3 10.6 0.02 −0.008(−1.55, 0.92) 2 Potassium Intercept only 2 0.0 0.56 2.23e–3(−0.46, 0.47)
Potassium Ecomorph (lower jaw angle) 3 1.6 0.20 −0.476(−19.62, 16.00) Potassium Body shape (PC1) 3 2.4 0.09 −0.321(−10.67, 6.95) Potassium Ecomorph (lower jaw angle) * size 5 7.4 0.01 0.028(−13.11, 17.26)
3 Calcium Intercept only 2 0.0 0.54 4.46e–4(−0.13, 0.13)
Calcium Body shape (PC1) 3 1.3 0.28 0.431(−1.49, 4.56) Calcium Ecomorph (lower jaw angle) 3 2.4 0.16 −0.011(−5.36, 5.23) Calcium Ecomorph (lower jaw angle) * size 5 7.8 0.01 −0.001(−4.45, 4.21)
4 Glucose Intercept only 2 0.0 0.56 4.90e–4(−0.71, 0.71) Glucose Ecomorph (lower jaw angle) 3 1.5 0.26 −0.544(−25.11, 21.19) Glucose Body shape (PC1) 3 2.4 0.17 −0.075(−14.09, 13.18)
Glucose Ecomorph (lower jaw angle) * size 5 7.0 0.01 0.01(−18.36, 19.49) 5 Hematocrit Ecomorph (lower jaw angle) 3 0.0 0.38 0.046(−0.65, 0.74)
Hematocrit Intercept only 2 0.3 0.32 −2.457(−33.26, 21.99)
Hematocrit Body shape (PC1) 3 0.9 0.24 0.993(−2.09, 10.38) Hematocrit Ecomorph (lower jaw angle) * size 5 3.9 0.06 0.356(−3.73, 16.92) 6 Hemoglobin Ecomorph (lower jaw angle) 3 0.0 0.36 0.044(−0.64, 0.73)
Hemoglobin Intercept only 2 0.2 0.34 −2.335(−33.01, 21.92) Hemoglobin Body shape (PC1) 3 0.8 0.25 0.993(−2.14, 10.32) Hemoglobin Ecomorph (lower jaw angle) * size 5 3.9 0.05 0.339(−3.77, 16.9)
7 pH Intercept only 2 0.0 0.47 2.33e–4(−0.05, 0.05)
pH Body shape (PC1) 3 0.8 0.31 −0.188(−1.54, 0.36) pH Ecomorph (lower jaw angle) 3 1.7 0.20 −0.012(−2.23, 2.12)
pH Ecomorph (lower jaw angle) * size 5 6.6 0.02 7.72e–3(−0.89, 1.79)
8 PCO2 Intercept only 2 0.0 0.55 7.49e–4(−0.38, 0.38)
PCO2 Body shape (PC1) 3 1.7 0.24 0.795(−4.73, 11.33)
PCO2 Ecomorph (lower jaw angle) 3 2.0 0.20 −0.145(−14.67, 13.33) PCO2 Ecomorph (lower jaw angle) * size 5 7.4 0.01 3.69e–3(−11.73, 11.18) 9 PO2 Body shape (PC1) 3 0.0 0.38 −6.51e–3(−0.75, 0.74)
PO2 Intercept only 2 0.2 0.33 −4.14(−24.82, 2.88) PO2 Ecomorph (lower jaw angle) 3 0.7 0.27 0.906(−21.21, 27.54) PO2 Ecomorph (lower jaw angle) * size 5 6.1 0.02 −0.024(−21.08, 18.33)
10 BEEcf Intercept only 2 0.0 0.55 4.45e–4(−0.35, 0.36) BEEcf Ecomorph (lower jaw angle) 3 1.5 0.25 0.187(−11.15, 12.52) BEEcf Body shape (PC1) 3 2.3 0.18 −0.218(−8.12, 5.62)
Table 3(continued)
Set Response variable Predictor variable df 1AICc wi Model-averaged coefficients (95% CI)
11 Bicarbonate Intercept only 2 0.0 0.61 8.62e–4(−0.41, 0.41)
Bicarbonate Ecomorph (lower jaw angle) 3 2.3 0.20 −0.178(−16.35, 14.66)
Bicarbonate Body shape (PC1) 3 2.4 0.18 −0.013(−8.92, 8.78) Bicarbonate Ecomorph (lower jaw angle) * size 5 7.7 0.01 0.015(−11.3, 13.54) 12 Total CO2 Intercept only 2 0.0 0.57 9.82e–4(−0.36, 0.36)
Total CO2 Ecomorph (lower jaw angle) 3 1.8 0.23 −0.254(−13.7, 11.64) Total CO2 Body shape (PC1) 3 2.3 0.18 0.208(−6.15, 8.47) Total CO2 Ecomorph (lower jaw angle) * size 5 7.2 0.02 0.012(−9.42, 11)
13 Saturated 02% Intercept only 2 0.0 0.60 −0.025(−1.24, 1.19) Saturated 02% Ecomorph (lower jaw angle) 3 2.4 0.182 2.132(−61.75, 81.97) Saturated 02% Body shape (PC1) 3 2.4 0.181 −0.726(−24.42, 16.41)
Saturated 02% Ecomorph (lower jaw angle) * size 5 6.1 0.03 −0.492(−42.6, 8.01) 14 Lactate Body shape (PC1) 3 0.0 0.50 −2.06e–3(−0.6, 0.59)
Lactate Intercept only 2 0.8 0.34 4.801(−1.41, 20.57) Lactate Ecomorph (lower jaw angle) 3 2.5 0.14 0.439(−31.45, 37.02)
Lactate Ecomorph (lower jaw angle) * size 5 6.8 0.02 −0.132(−23.74, 7.87) 15 Packed cell volume Intercept only 2 0.0 0.59 −4.72e–4(−0.24, 0.24)
Packed cell volume Ecomorph (lower jaw angle) 3 2.0 0.22 −0.074(−8.82, 8.18)
Packed cell volume Body shape (PC1) 3 2.4 0.18 −0.066(−5.31, 4.56) Packed cell volume Ecomorph (lower jaw angle) * size 5 7.5 0.01 −6.03e–3(−7.43, 6.56)
16 WBC Intercept only 2 0.0 0.47 0.005(−0.56, 0.57)
WBC Body shape (PC1) 3 0.9 0.29 2.06(−4.61, 18.7) WBC Ecomorph (lower jaw angle) 3 1.4 0.23 −0.29(−17.9, 15.51) WBC Ecomorph (lower jaw angle) * size 5 7.3 0.01 −0.01(−16.25, 13.55)
Notes.
Df, degrees of freedom;1AIC, difference in AIC score between the model and the best-fitting model;wi, AIC weight; df, degrees of freedom; WBC, white blood cell count. a PCA of the hematological data yielded three axes that together described 85% of the cumulative variance (PC1=48%; PC2=26%; PC3=11%). A MANOVA on the PC scores mirrored the qualitative results of the morphospaces and provided no support for a significant effect of sex on jaw morphology (Pillai’s trace=3.94e–30,F=4.95e–29,p=1) or of sex on the health assessment data (Pillai’s trace=5.44e–31,F=4.35e–30,p=1). Taken together, there is little evidence for sexual dimorphism in this sample of pinfish.
The effect of ecomorphology on health assessment data
-0.02 0.00 0.02
-0.04
0.00
0.04 female
male
Principal Component 1 (24.8%)
Principal Component 2 (17.4%)
A.
C. B.
-1 0 1 2 3
-1.5
2.0
Principal Component 1 (48.1%)
Principal Component 2 (26.2%)
-0.2 0.8
-0.2
0.3
Principal Component 1 (55.7%)
Principal Component 2 ( 19.2 %)
Figure 3 Visualizations of the first two principle component axes for changes in (A) body shape quan-tified by the geometric morphometric analyses; (B) jaw morphology; and (C) hematological data. Out-lines correspond to the convex hull of the morphospace for females or males.
DISCUSSION
The results of our health assessment correspond with published work and provide new baseline information on additional blood parameters that can be used for monitoring the health status of this ecologically important species. We find no evidence for sexual dimorphism in either the morphological or hematological and biochemical datasets, con-sistent with previous studies that have found no sexual dimorphism in this species (Nelson, 2002). Integrating our health assessment with the morphological analyses we also find no evidence for a strong relationship between blood physiology and feeding morphology. Comparing our results to published values from other fish species supports hypotheses concerning patterns of hematocrit, lactate, and glucose content across marine fishes.
Towards developing baseline health statistics for wild pinfishes
a reflection of low sample size. Instead our inability to detect a relationship between sex and blood physiology in our study may be expected. Changes in hematology have been found to correspond with expected changes in the demands of hematological functions at different body masses (Burggren, Dupré & Wood, 1987) and sexual size dimorphism has been demonstrated for both Cebus apella(Masterson & Hartwig, 1998;Kay et al., 1988) andTenualosa ilisha(Jafri et al., 1999). In contrast to these taxa, pinfish are not known to exhibit any degree of sexual size dimorphism (Nelson, 2002), a finding consistent with our morphological analyses (Fig. 3) even when accounting for potential variation due to patterns of allometry (Tables S1andS2). Our findings are in line with previous blood work on this species that found no evidence for a relationship between sex and blood characteristics (Cameron, 1970). However, there are several reasons to expect that ecomorphology associated with habitat specificity could underlie hematological and biochemical differences.
Simple sand habitats are associated with more active roaming in pinfishes
(Ruehl, Shervette & Dewitt, 2011), and a previous laboratory experiment linked increased activity with increased blood concentrations in this species (Cameron, 1970). This expectation of increased locomotor activity in sand habitats raises the question of whether sand habitat fidelity would promote detectable differences in blood physiology. As low sample sizes will bias towards simpler model fits given the penalty factor in a AICc framework (Burnham & Anderson, 2002), our inability to provide evidence for a link between ecomorphology and blood physiology could be an artifact of experimental design. Although our sample sizes are on par with other studies of fishes (e.g., Fazio et al.;n=25), this is certainly plausible. However, we find sample size an unlikely explanation given the broad overlap of blood parameters and ecomorphology (Fig. S2). Alternatively, potentially confounding the expectation of habitat-specific differentiation of blood parameters is the observation that in more complex eel-grass dominated patches pinfishes focus foraging and feeding across a wider range of the water column, requiring continual fine-scale maneuvering (Ruehl, Shervette & Dewitt, 2011). In the absence of studies investigating the energetics of pinfishes in different habitat types, it is unclear how different these exercise regimes between habitats really are. Further, a not mutually exclusive hypothesis is that the mosaic nature of our collection site facilitates pinfish to opportunistically forage in both sandy and eel-grass dominated patches.
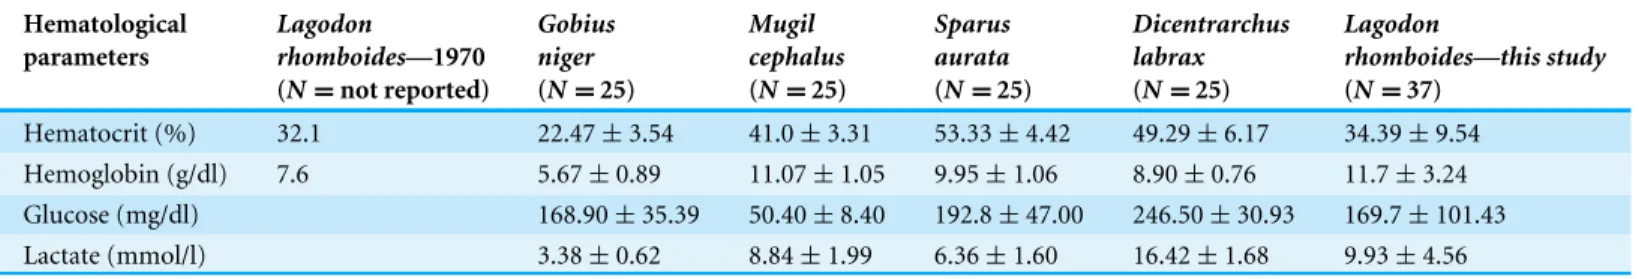
Table 4 Descriptive statistics for hematology parameters from four species of marine fish as compared to pinfish (Lagodon rhomboides). Val-ues indicate mean and standard deviations for blood parameters.Cameron (1970)utilized heparinized capillaries and a scaled reading device to mea-sure hematocrit and a cyanmethemoglobin method to meamea-sure hemoglobin.Fazio et al. (2013)utilized a HeCo vet C blood cell counter (SEAC) to quantify hematocrit and hemoglobin as well portable blood glucose (ACCU-Chek Active; Roche Diagnostics GmbH) and lactate (Accusport; Boehringer) analyzers for the additional parameters.
Hematological parameters
Lagodon
rhomboides—1970 (N=not reported)
Gobius niger
(N=25)
Mugil cephalus
(N=25)
Sparus aurata
(N=25)
Dicentrarchus labrax
(N=25)
Lagodon
rhomboides—this study
(N=37)
Hematocrit (%) 32.1 22.47±3.54 41.0±3.31 53.33±4.42 49.29±6.17 34.39±9.54
Hemoglobin (g/dl) 7.6 5.67±0.89 11.07±1.05 9.95±1.06 8.90±0.76 11.7±3.24 Glucose (mg/dl) 168.90±35.39 50.40±8.40 192.8±47.00 246.50±30.93 169.7±101.43 Lactate (mmol/l) 3.38±0.62 8.84±1.99 6.36±1.60 16.42±1.68 9.93±4.56
(Muncy, 1984). Regardless of possible mechanisms underlying the patterns of pinfish ecophysiology in our data, our findings contribute new baseline data and provide new axes of inquiry in future investigations of sources that underlie variation in blood physiology across the range of this important Atlantic fish.
Pinfish in the perspective of marine fish physiology
Ray-finned fishes (Actinopterygii) comprise over half of all living vertebrate species (Near et al., 2012b;Eschmeyer & Fricke, 2015), with over 17,000 species found in marine waters (Vega & Wiens, 2012). Although collecting baseline data across a quarter of living vertebrates is a task that will take several decades, existing work within pinfishes (Cameron, 1970) as well as several recent investigations of marine teleosts (Fazio et al., 2012;Francesco et al., 2012;Fazio et al., 2013) provide an early opportunity to compare other published blood parameters to values from our study.
Intraspecifically, our hematocrit values closely mirror previously collected data (Cameron, 1970;Table 4). Hematocrit values are closely related to blood oxygen content (Randall, 1982), suggesting similar arterial blood composition between populations. Our differential white blood cell count (WBC) also closely matches previous work by Cameron (1970), who found a wide range of variation, from 9.41 to 47.36×10³/µl. Our
pinfish WBC counts were similar in that the average total WBC count was 25.78×10³/µl,
ranging from 6.8 to 73.2×10³/µl. As the defensive cells of the body, WBC levels have
implications for immune response and the ability of the animal to fight infection, with higher levels correlated with more effective immune responses (Douglass & Jane, 2010). These wide ranges of WBC across two independent studies are enigmatic. While leucocrit is related to stress tolerances of individuals, such as physiological stress due to handling and temperature changes, WBC’s are relatively insensitive to physiological sampling procedures (Wedemeyer, Gould & Yasutake, 1983). This wide range could be attributed to immune function, heterogeneous environmental stressors, or even possibly infection or disease. More work is clearly needed to determine why pinfishes exhibit a WBC range spanning nearly an order of magnitude.
Fazio et al. (2013) also found that blood lactate concentrations were higher in more active fish, such as European sea bass (Dicentrarchus labrax) and mullet, compared to less active species (Table 4). The pinfish mean lactate value from our study was comparable to that of an active fish (Table 4), however glucose levels for this species differed substantially from both the European sea bass and mullet assessed by Fazio et al. (2013). While glucose measurements can vary greatly between analytical method and instrument, this large difference may reflect increasing carnivory impairing the ability to clear excess blood glucose levels (Cowey et al., 1977). Many carnivorous fish have been traditionally considered relatively glucose-intolerant species (Wilson, 1994;Moon, 2001), a hypothesis in line with the results ofFazio et al. (2013)who found the highest levels of glucose in the carnivorous European seabass and lowest in the herbivorous mullet. Since pinfish are omnivores (Montgomery & Targett, 1992), their glucose levels fall in the middle of this range, with values being closer to those of the omnivorousGobius niger than the herbivorousM. cephalus.
Although taxonomic sampling is currently limited in marine fish hematological and biochemical studies, a comparison of our study with the results of Fazio et al. (2013) suggests that broad ‘‘ecohematological’’ patterns may well exist across the ray finned fish Tree of Life. Since the success of fishes is linked to their ability to diversify within any aquatic habitat type (Near et al., 2013), continual case studies of individual species will facilitate future investigations of correlations between blood value variation and ecology, and ultimately provide the necessary data to place fish blood physiology into a phylogenetic perspective. Such a historic perspective will not only help characterize the severity of physiological changes following different stress conditions, such as exposure to pollutants, disease, metals, hypoxia, and other stressors (Blaxhall, 1972;Duthie & Tort, 1985), but shed light on patterns of convergence in the physiological changes that underlie the successful diversification of fishes. As we move further in the 21st century, there is a growing consensus that marine fish species are valuable indicators from which to assess changes in ocean conditions in response to a variety of factors (Schlacher et al., 2007). Continual health assessments both within and between species will be pivotal to monitoring the health of the world’s oceans and offer the opportunity to gleen new insights into physiological processes that govern the origin and maintenance of marine biodiversity.
ACKNOWLEDGEMENTS
ADDITIONAL INFORMATION AND DECLARATIONS
Funding
This work was supported in part by the Robert J. Koller Aquatic Animal Medicine endowment at the NC State College of Veterinary Medicine. The funders had no role in study design, data collection and analysis, decision to publish, or preparation of the manuscript.
Grant Disclosures
The following grant information was disclosed by the authors: NC State College of Veterinary Medicine.
Competing Interests
The authors declare there are no competing interests.
Author Contributions
• Sara Collins performed the experiments, analyzed the data, wrote the paper, prepared
figures and/or tables, reviewed drafts of the paper.
• Alex Dornburg conceived and designed the experiments, performed the experiments,
analyzed the data, contributed reagents/materials/analysis tools, wrote the paper, prepared figures and/or tables, reviewed drafts of the paper.
• Joseph M. Flores performed the experiments, reviewed drafts of the paper.
• Daniel S. Dombrowski conceived and designed the experiments, conceived the initial
idea and made the connections between the lead investigators.
• Gregory A. Lewbart conceived and designed the experiments, contributed
reagents/materials/analysis tools, reviewed drafts of the paper.
Animal Ethics
The following information was supplied relating to ethical approvals (i.e., approving body and any reference numbers):
This study was conducted at the North Carolina State University Center for Marine Sciences and Technology (CMAST) in Morehead City, North Carolina and approved by the IACUC ethics and animal handling protocol (15-005-O). All handling and sampling procedures were consistent with standard vertebrate protocols and veterinary practices.
Data Availability
The following information was supplied regarding data availability:
The raw data has been supplied as Supplemental File and at Zenodo DOI
10.5281/zenodo.58022.
Supplemental Information
REFERENCES
Abràmoff M, Magalhães PJ, Ram SJ. 2004.Image processing with image.Journal of Biophotonics International11:36–42.
Adams CM, Lazur AM, Zajicek P, Zimet D. 1998.An assessment of the market for live marine baitfish in Florida. Bureau of seafood and aquaculture, Florida Department of Agriculture and Consumer Services.Florida Sea Grant College Program97:1–33.
Adams DC, Otárola-Castillo E. 2013.Geomorph: an R package for the collection and analysis of geometric morphometric shape data.Methods in Ecology and Evolution 4:393–399DOI 10.1111/2041-210X.12035.
Adams DC, Rohlf FJ, Slice DE. 2004.Geometric morphometrics: ten years of progress following the ‘revolution’.Italian Journal of Zoology 71:5–16
DOI 10.1080/11250000409356545.
Akaike H. 1973. Information theory and an extension of the maximum likelihood prin-ciple. In:International symposium on information theory. 2nd edition. Tsahkadsor, Armenian SSR, 267–281.
Albins MA, Hixon MA. 2013.Worst case scenario: potential long-term effects of invasive predatory lionfish (Pterois volitans) on Atlantic and Caribbean coral-reef communi-ties.Environmental Biology of Fishes96:1151–1157DOI 10.1007/s10641-011-9795-1.
Anderson E, Stoskopf M, Morris Jr M, Clarke E, Harms C. 2010.Hematology, plasma biochemistry, and tissue enzyme activities of invasive red lionfish captured off North Carolina, USA.Journal of Aquatic Animal Health22:266–273
DOI 10.1577/H10-029.1.
Barton K, Barton MK. 2015.Package ‘MuMIn’. Version 1:18.Available athttps:// cran.r-project.org/ web/ packages/ MuMIn/.
Bastir M, Rosas A. 2006.Correlated variation between the lateral basicranium and the face: a geometric morphometric study in different human groups.Archives of Oral Biology51:814–824DOI 10.1016/j.archoralbio.2006.03.009.
Bethea DM, Carlson JK, Buckel JA, Satterwhite M. 2006.Ontogenetic and site-related trends in the diet of the Atlantic sharpnose shark Rhizoprionodon terraenovae from the northeast Gulf of Mexico.Bulletin of Marine Science78:287–307.
Birch JM. 1997.Comparing wing shape of bats: the merits of principal-components analysis and relative-warp analysis.Journal of Mammalogy78:1187–1198
DOI 10.2307/1383062.
Blaxhall PC. 1972.The haematological assessment of the health of freshwater fish. Journal of Fish Biology 4(4):593–604.
Bolker B. 2010.bbmle: tools for general maximum likelihood estimation. R package version 0.9.Available athttps:// cran.r-project.org/ web/ packages/ bbmle/ index.html.
Bookstein FL. 1997.Morphometric tools for landmark data: geometry and biology. Cambridge: Cambridge University Press.
Brenner DG, Lewbart M, Stebbins, Herman DW. 2002.Health survey of wild and cap-tive bog turtles (Clemmys muhlenbergii) in North Carolina and Virginia.Journal of Zoology and Wildlife Medicine33:311–316
DOI 10.1638/1042-7260(2002)033[0311:HSOWAC]2.0.CO;2.
Burggren WW, Dupré RK, Wood SC. 1987.Allometry of red cell oxygen binding and hematology in larvae of the salamander,Ambystoma tigrinum.Respiratory Physiology 70:73–84DOI 10.1016/S0034-5687(87)80033-6.
Burnham KP, Anderson DR. 2002.Model selection and multimodel inference: a practical information-theoretic approach. New York: Springer.
Burnham KP, Anderson DR. 2004.Multimodel inference: understanding AIC and BIC in model selection.Sociological Methods & Research33:261–304
DOI 10.1177/0049124104268644.
Cameron JN. 1970.The influence of environmental variables on the hematology of pinfish (Lagodon rhomboides) and striped mullet (Mugil cephalus).Comparative Biochemistry and Physiology 32:175–192DOI 10.1016/0010-406X(70)90932-1.
Cowey CB, Knox D, Walton MJ, Adron JW. 1977.The regulation of gluconeogenesis by diet and insulin in rainbow trout (Salmo gairdneri).British Journal of Nutrition 38:463–470.
Dardeau MR, McDonald CM. 2007. Pressure related incidence rates in scientific divng. In: Pollock NW, Godfrey JM, eds.Diving for science 2007. Proceedings of the American academy of underwater sciences 26th symposium. Dauphin Island: American Academy of Underwater Sciences, 111–115.
DiMaggio MA, Broach JS, Ohs CL. 2013.Evaluation of Ovaprim and human chorionic gonadotropin doses on spawning induction and egg and larval quality of pinfish. Lagodon rhomboides.Aquaculture414:9–18DOI 10.1016/j.aquaculture.2013.07.012.
DiMaggio MA, Grabe SW, DeSantis SM, Ohs CL. 2010.Induced volitional spawning and larval rearing of pinfish.North American Journal Of Aquaculture72:252–257
DOI 10.1577/A09-072.1.
Dornburg A, Sidlauskas B, Santini F, Sorenson L, Near TJ, Alfaro ME. 2011.The influ-ence of an innovative locomotor strategy on the phenotypic diversification of trigger-fish (Family: Balistidae).Evolution65:1912–1926
DOI 10.1111/j.1558-5646.2011.01275.x.
Douglass JW, Jane KW. 2010.Schalm’s veterinary hematology. Hoboken: Wiley-Blackwell, 1232 pp.
Duthie GG, Tort L. 1985.Effects of dorsal aortic cannulation on the respiration and haematology of Mediterranean living Scyliorhinus canicula L.Comparative Biochem-istry and Physiology Part A: Physiology 81(4):879–883.
Fabry VJ, Seibel BA, Feely RA, Orr JC. 2008.Impacts of ocean acidification on marine fauna and ecosystem processes.ICES Journal of Marine Science: Journal du Conseil 65:414–432DOI 10.1093/icesjms/fsn048.
Fazio F, Faggio C, Marafioti S, Torre A, Sanfilippo M, Piccione G. 2012.Comparative study of haematological profile onGobius nigerin two different habitat sites: Faro lake and Tyrrhenian sea.Cahiers de Biologie Marine53:213–219.
Fazio F, Marafioti S, Arfuso F, Piccione G, Faggio C. 2013.Comparative study of the biochemical and haematological parameters of four wild Tyrrhenian fish species. Veterinarni Medicina58:576–581.
Francesco F, Satheeshkumar P, Kumar DS, Caterina F, Giuseppe P. 2012.A com-parative study of hematological and blood chemistry of Indian and Italian grey mullet (Mugil cephalusLinneaus 1758).HOA Journal of Biology 1:1–5
DOI 10.7243/2050-0874-1-5.
Frederich B, Sorenson L, Santini F, Slater GJ, Alfaro ME. 2012.Iterative ecological radiation and convergence during the evolutionary history of damselfishes (Poma-centridae).American Naturalist181:94–113DOI 10.1086/668599.
Friedrichs KR, Harr KE, Freeman KP, Szladovits B, Walton RM, Barnhart KF, Blanco-Chavez J. 2012.ASVCP reference interval guidelines: determination of de novo reference intervals in veterinary species and other related topics.Veterinary Clinical Pathology41:441–453DOI 10.1111/vcp.12006.
Gaunt SD, Prescott-Mathews JS, King WW, Scholl DT. 1995.Clinical hematology practices at veterinary teaching hospitals and private diagnostic laboratories. Veterinary Clinical Pathology24:64–67.
Hansen DJ. 1969.Food, growth, migration, reproduction, and abundance of pinfish, Lagodon rhomboides, and Atlantic croaker,Micropogon undulatus, near Pensacola, Florida, 1963–65.Fishery Bulletin68:135–146.
Harvell CD, Mitchell CE, Ward JR, Altizer S, Dobson AP, Ostfeld RS, Samuel MD. 2002.Climate warming and disease risks for terrestrial and marine biota.Science 296(5576):2158–2162DOI 10.1126/science.1063699.
Hoegh-Guldberg O, Mumby P, Hooten A, Steneck R, Greenfield P, Gomez E, Harvell C, Sale P, Edwards A, Caldeira K. 2007.Coral reefs under rapid climate change and ocean acidification.Science318:1737–1742DOI 10.1126/science.1152509.
Horn PS, Feng L, Li Y, Pesce AJ. 2001.Effect of outliers and nonhealthy individuals on reference interval estimation.Clinical Chemistry47:2137–2145.
Jafri SIH, Narejo NT, Baloch WA, Sahato GA. 1999.Studies on land-locked population of Palla,Tenualosa ilishafrom Keenjhar lake (Sindh), Pakistan.Pakistan Journal of Zoology31:347–350.
Jawad L, Al-Mukhtar M, Ahmed H. 2004.The relationship between haematocrit and some biological parameters of the Indian shad,Tenualosa ilisha(Family Clupeidae). Animal Biodiversity Conservation27:47–52.
Levin P, Petrik R, Malone J. 1997.Interactive effects of habitat selection, food supply and predation on recruitment of an estuarine fish.Oecologia112:55–63
DOI 10.1007/s004420050283.
Lewbart GA, Hirschfeld M, Denkinger J, Vasco K, Guevara N, García J, Muñoz J, Lohmann KJ. 2014.Blood gases, biochemistry, and hematology of Galapagos green turtles (Chelonia mydas).PLoS ONE 9(5):e96487
DOI 10.1371/journal.pone.0096487.
Lohner TW, Reash RJ, Willet VE, Rose LA. 2001.Assessment of tolerant sunfish pop-ulations (Lepomissp.) inhabiting selenium-laden coal ash effluents: hematological and population level assessment.Ecotoxicology and Environmental Safety50:203–216
DOI 10.1006/eesa.2001.2097.
Luczkovich JJ. 1988.The role of prey detection in the selection of prey by pinfish Lagodon rhomboides(Linnaeus).Journal of Experimental Marine Biology and Ecology 123:15–30DOI 10.1016/0022-0981(88)90106-2.
Mandelman JW, Skomal GB. 2009.Differential sensitivity to capture stress assessed by blood acid–base status in five carcharhinid sharks.Journal of Comparative Physiology B179(3):267–277.
Masterson TJ, Hartwig WC. 1998.Degrees of sexual dimorphism inCebusand other New World monkeys.American Journal of Physical Anthropology 107(3):243–256
DOI 10.1002/(SICI)1096-8644(199811)107:3<243::AID-AJPA2>3.0.CO;2-G.
Montgomery JL, Targett TE. 1992.The nutritional role of seagrass in the diet of the omnivorous pinfishLagodon rhomboides(L.).Journal of Experimental Marine Biology and Ecology158:37–57DOI 10.1016/0022-0981(92)90307-V.
Moon TW. 2001.Glucose intolerance in teleost fish: fact or fiction?Comparative Bio-chemistry and Physiology Part B: BioBio-chemistry and Molecular Biology 129(2):243–249.
Muncy RJ. 1984.Species profiles. Life histories and environmental requirements of coastal fishes and invertebrates (Gulf of Mexico). PINFISH. DTIC Document. Fort Belvoir: Defense Technical Information Center.
Near TJ, Dornburg A, Eytan RI, Keck BP, Smith WL, Kuhn KL, Moore JA, Price SA, Burbrink FT, Friedman M. 2013.Phylogeny and tempo of diversification in the superradiation of spiny-rayed fishes.Proceedings of the National Academy of Sciences of the United States of America110:12738–12743DOI 10.1073/pnas.1304661110.
Near TJ, Dornburg A, Kuhn KL, Eastman JT, Pennington JN, Patarnello T, Zane L, Fer-nandez DA, Jones CD. 2012a.Ancient climate change, antifreeze, and the evolution-ary diversification of Antarctic fishes.Proceedings of the National Academy of Sciences of the United States of America109:3434–3439DOI 10.1073/pnas.1115169109.
Near TJ, Dornburg A, Kuhn KL, Eastman JT, Pennington JN, Patarnello T, Zane L, Fernandez DA, Jones CD. 2012b.Resolution of ray-finned fish phylogeny and timing of diversification.Proceedings of the National Academy of Sciences of the United States of America109:13698–13703DOI 10.1073/pnas.1206625109.
Nelson GA. 2002.Age, growth, mortality, and distribution of pinfish (Lagodon rhomboides) in Tampa Bay and adjacent Gulf of Mexico waters.Fishery Bulletin 100:582–592.
Newman S, Piatt J, White J. 1997.Hematological and plasma biochemical reference ranges of Alaskan seabirds: their ecological significance and clinical importance. Colonial Waterbirds20(3):492–504.
Ohs CL, Grabe SW, DeSantis SM, DiMaggio MA, Rhyne AL. 2010.Culture of pinfish at different stocking densities and salinities in recirculating aquaculture systems.North American Journal Of Aquaculture72:132–140DOI 10.1577/A09-028.1.
Orr JC, Fabry VJ, Aumont O, Bopp L, Doney SC, Feely RA, Gnanadesikan A, Gruber N, Ishida A, Joos F. 2005.Anthropogenic ocean acidification over the twenty-first century and its impact on calcifying organisms.Nature437:681–686
DOI 10.1038/nature04095.
Orth RJ, Heck KL. 1980.Structural components of eelgrass (Zostera marina) meadows in the lower Chesapeake Bay—fishes.Estuaries3:278–288DOI 10.2307/1352083.
Potthoff MT, Allen DM. 2003.Site fidelity, home range, and tidal migrations of juvenile pinfish,Lagodon rhomboides, in salt marsh creeks.Environmental Biology of Fishes 67:231–240DOI 10.1023/A:1025874712710.
Randall D. 1982.The control of respiration and circulation in fish during exercise and hypoxia.Journal of Experimental Biology100:275–288.
Reid Jr GK. 1954.An ecological study of the Gulf of Mexico fishes, in the vicinity of Cedar Key, Florida.Bulletin of Marine Science4:1–12.
Rohlf FJ. 1993. Relative warp analysis and an example of its application to mosquito wings. In: Marcus LF, Bello E, Valdecasas AG, eds.Contributions to morphometrics, vol. 8, 131.
Rohlf FJ. 2005.tpsDig, digitize landmarks and outlines. version 2.05. Stony Brook: Department of Ecology and Evolution, State University of New York at Stony Brook.
Rohlf FJ, Slice D. 1990.Extensions of the Procrustes method for the optimal superimpo-sition of landmarks.Systematic Biology39:40–59.
Rosner J, Schinini A, Rovira T, Merlo R, Bestard R, Maldonado M. 1985.Body measure-ments, hematology, and serum chemistry values of the adultCebus apellamonkey. Journal of Medical Primatology15:295–302.
Ruehl CB, Shervette V, Dewitt TJ. 2011.Replicated shape variation between simple and complex habitats in two estuarine fishes.Biological Journal of the Linnean Society 103:147–158DOI 10.1111/j.1095-8312.2011.01626.x.
Schiel DR, Steinbeck JR, Foster MS. 2004.Ten years of induced ocean warming causes comprehensive changes in marine benthic communities.Ecology85:1833–1839
DOI 10.1890/03-3107.
Schlacher TA, Dugan J, Schoeman DS, Lastra M, Jones A, Scapini F, McLachlan A, De-feo O. 2007.Sandy beaches at the brink.Diversity and Distributions13(5):556–560.
Seaward M. 1994.Measuring up to disaster: the necessity for valid baseline data.Disaster Prevention Management: An International Journal3(4):17–26
DOI 10.1108/09653569410076757.
Shapiro SS, Wilk MB. 1965.An analysis of variance test for normality (complete samples).Biometrika52:591–611DOI 10.1093/biomet/52.3-4.591.
Sidlauskas B. 2008.Continuous and arrested morphological diversification in sister clades of characiform fishes: a phylomorphospace approach.Evolution 62:3135–3156DOI 10.1111/j.1558-5646.2008.00519.x.
Stachowicz JJ, Terwin JR, Whitlatch RB, Osman RW. 2002.Linking climate change and biological invasions: ocean warming facilitates nonindigenous species invasions. Proceedings of the National Academy of Sciences of the United States of America 99:15497–15500DOI 10.1073/pnas.242437499.
Stoner A. 1980.Perception and choice of substratum by epifaunal amphipods associated with seagrasses.Marine Ecology Progress Series3:105–111 DOI 10.3354/meps003105.
Stoner AW. 1982.The influence of benthic macrophytes on the foraging behavior of pinfish,Lagodon rhomboides(Linnaeus).Journal of Experimental Marine Biology and Ecology 58:271–284DOI 10.1016/0022-0981(82)90134-4.
Stoner AW, Livingston RJ. 1984.Ontogenetic patterns in diet and feeding morphology in sympatric sparid fishes from seagrass meadows.Copeia1984:174–187.
Thatje SK, Anger JA, Calcagno GA, Lovrich H, Pörtner O, Arntz WE. 2005.Challenging the cold: crabs reconquer the Antarc.Ecology86:619–625 DOI 10.1890/04-0620.
Thompson P, Tollit D, Corpe H, Reid R, Ross H. 1997.Changes in haematological parameters in relation to prey switching in a wild population of harbour seals. Functional Ecology11:743–750.
Vega GC, Wiens JJ. 2012.Why are there so few fish in the sea? Proceedings of the Royal Society B: Biological Sciences279:2323–2329DOI 10.1098/rspb.2012.0075.
Wedemeyer G, Gould R, Yasutake W. 1983.Some potentials and limits of the leuc-ocrit test as a fish health assessment method.Journal of Fish Biology23:711–716
DOI 10.1111/j.1095-8649.1983.tb02948.x.
Willis TJ, Miller RB, Babcock RB. 2000.Detection of spatial variability in relative density of fishes: comparison of visual census, angling, and baited underwater video.Marine Ecology Progress Series198:249–260DOI 10.3354/meps198249.
Wilson RP. 1994.Utilization of dietary carbohydrate by fish.Aquaculture 124(1):67–80.