Article
The small genetic world of
Seriatopora hystrix
Stuart Kininmonth1, Madeleine van Oppen1, Sarah Castine2, Lesa Peplow1, Adrian Lutz1 1
Australian Institute of Marine Science, PMB#3, Townsville, Queensland, 4810 Australia 2
AIMS@JCU, DB17-063,James Cook University, Townsville, QLD 4811 Australia E-mail: [email protected]
Received 12 August 2011; Accepted 15 September 2011; Published online 1 March 2012 IAEES
Abstract
The exchange of genetic information among coral reefs, through the transport of larvae, is critical to the
function of Australia’s Great Barrier Reef because it influences recruitment rates and resilience to disturbance. For many species the genetic composition is not homogeneous and is determined, in part, by the character of
the complex dispersal pathways that connect the populations situated on each coral reef. One method of measuring these genetic connections is to examine the microsatellite composition of individual corals and then statistically compare populations across the region. We use these connection strengths, derived from a
population similarity measure, to create complex networks to describe and analyse the genetic exchange of the brooding coral, Seriatopora hystrix. The network, based on determining the putative parental origin of
individual coral colonies, involved sampling 2163 colonies from 47 collection sites and examining 10 microsatellites. A dispersal network was created from the genetic distance DLR values that measure the genetic similarity of each population (defined by the local sampling effort) to every other sampled population based on
the microsatellite composition. Graph theory methods show that this network exhibited infrequent long distance links and population clustering which is commonly referred to as small world topology. Comparison
with a hydrodynamic based network indicates that the genetic population network topology is similar. This approach shows the genetic structure of the S. hystrix coral follows a small world pattern which supports the
results derived from previous hydrodynamic modelling.
Keywords coral dispersal; small world topology; networks; Seriatopora hystrix.
1 Introduction
The exchange of genetic information between reefs, through coral larvae exchange, is fundamentally important for the function of the Great Barrier Reef (GBR) (Hughes et al., 1999; Ayre and Hughes, 2004). Recruitment
rates and recovery from disturbances are influenced by the migration of coral larvae that either settle locally or are transported across large distances (van Oppen and Gates, 2006). However the marine environment is not
always favourable for coral growth and coral reefs are subject to natural disturbances which alter the community composition (Wakeford et al., 2008). In addition to natural disturbances, the rates and severity of anthropogenic disturbances, such as climate change, overfishing and coastal development (Hughes et al., 2003),
Oppen and Gates, 2006; Game et al., 2008; van Oppen et al., 2011). Measuring and understanding this complex network of gene flow is critical for conservation efforts (Cowen et al., 2002).
Due to the difficulties in measuring larval exchange by direct means (Palumbi, 2003), connectivity research is heavily reliant on hydrodynamic simulations (James et al., 2002; Werner et al., 2007). While the models have become more sophisticated in recent years (Legrand et al., 2006; Luick et al., 2007) the simulations of
larval movements are limited by issues of spatial scale and how individual larvae behave (Baums et al., 2006). Critically, the interest in population connectivity is not limited to just the transport of larvae but also includes
settlement success and juvenile mortality (Possingham and Roughgarden, 1990; Mumby, 1999; Bongaerts et al., 2010; Marshall et al., 2010). Hydrodynamic models therefore only reflect part of the recruitment process.
An alternative method of measuring the dispersal between distant reefs is to examine the genetic
composition of coral populations in a number of localities in a region and then use statistical analysis of relationships to infer connectivity across that region (Hellberg, 2007; Underwood et al., 2007; van Oppen et al.,
2008). DNA markers, like microsatellites, have sufficient variability to analyse how individuals relate to the sampled populations (Pritchard et al., 2000) yet the allele proportions at most loci are not distorted by local selection pressures. This has the advantage of informing us about the ultimate recruitment success rather than
just larval movement.
Calculating the genetic distance between populations provides a mechanism to measure the likelihood of
interbreeding between migrants and established individuals. The FST metric commonly used to describe genetic differentiation implies that when two populations are not significantly different (i.e. FST =0.00) that panmixia has occurred recently or is ongoing. Another measure, denoted by DLR , is the mean genotype log-likelihood ratio across individuals from the two populations (Paetkau et al., 1997). DLR was found to differentiate fine scale population structure with high levels of confidence in empirical studies by Paetkau et al.
(1997) and Underwood (2009).
This study describes the network created using the genetic analysis of the brooding pocilloporid coral Seriatopora hystrix Dana 1846. S. hystrix is a common coral in many parts of the world (Veron, 2000) despite
being a predominantly self recruiting species. The life history of S. hystrix, in which eggs are fertilised internally and then released at an advanced developmental stage, ensures that larvae can settle within hours to
days and this limits long distance dispersal (Ayre and Dufty, 1994; Underwood et al., 2007). The majority of larvae settle within 100 metres of the natal colony but a small percentage (2-6%) are successful in moving large distances (Underwood et al., 2007). The larvae are equipped with maternal zooxanthellae and could exist
for many weeks in the water column (Underwood et al., 2007). Given the velocity of the currents within the GBR (James et al., 2002; Luick et al., 2007), settlement at distant reefs, forming a region-wide dispersal
network, is conceivable.
The analysis of this network can utilise graph theory concepts and methods (Steuer and Lopez, 2008; Fortuna et al., 2009). Graph theory is experiencing a resurgence due to its successful application in complex
systems (Green and Sadedin, 2005) including ecology (Urban and Keitt, 2001; Bascompte, 2009; Dormann , 2011; Ferrarini, 2011; Zhang, 2011a, b). The results of population differentiation analysis can be used to
construct a network of vertices and lines. A connecting line can be formed from the centroid of the polygon containing the possible natal population to the centroid of the polygon containing the population where the
migrant was found. The lines and centroids can then be used to construct a network. Kininmonth et al. (2010) have discovered that, based on hydrodynamic models, the Great Barrier Reef (central section) has a topology that can be described as “small world”. The question remains – does this same result hold true at a regional
Graphs that have a high level of clustering (where vertices are densely interconnected to form groups) and small average minimum path lengths (describing the number of links from one vertex to every other) compared with random or regular lattices are known as ‘small world’ graphs (Watts and Strogatz, 1998). Small world topology increases the connectivity of vertices, effectively making the entire network smaller, in terms of interactions, than a random or regular one. Clusters connected by longer links enable any point in the network to be located a small number of links from any other point and this forms the basis of Stanley Milgram’s six degrees of freedom (Milgram, 1967) for the network describing human social interactions (Barabasi, 2002). We derive the S. hystrix network and compare it to nine archetypal networks (Table 1). We then answer the following questions: What is the topology of the genetic distance network? What is the cluster structure within this topology?
2 Methods
In this section the construction and analysis of the network created by assigning individuals to a collection of surveyed populations of Seriatopora hystrix will be described. We begin by describing the raw data and specimen collection process.
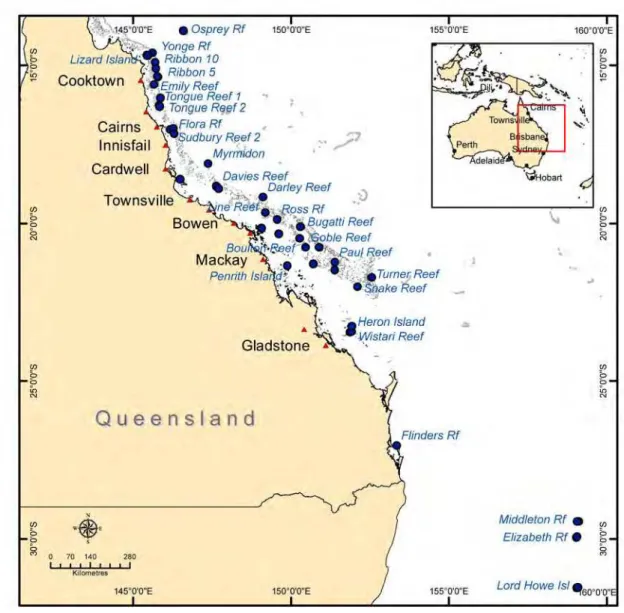
Van Oppen et al (2008) collected fragments from 1025 S. hystrix colonies from 22 sites across the Great Barrier Reef and Coral Sea between March 2003 and February 2005. This sample set was later extended, during the years 2005 to 2006, to a total of 47 sites containing 2163 colonies (Fig. 1) (M. van Oppen, unpublished data). From each of these samples the genotypes at ten microsatellites were determined. The 36 to 54 samples collected at each site were contained within a 100 metre2 area, consistent with the dispersal studies of S. hystrix (Underwood et al., 2007).
The microsatellite composition formed the basis for quantifying the relationship among sites. Following the methodology described by Underwood (2009) the genotype likelihood ratio distance (Paetkau et al., 1997), DLR , was calculated using the online calculator Doh (Brzustowski, 2002). For each combination of paired
populations a DLR value was calculated. S. hystrix is a common species known to occur across the region
(Veron, 1986) and therefore many populations were not sampled. Hence the DLR value is a measure of how
two populations are related irrespective of the number of intermediate populations that may have contributed to the connectivity.
The DLR values were transformed into graphs using tools created with the igraph package (Csardi and
Nepusz, 2006) within the R environment (http://cran.r-project.org). The probabilities provided by the genotype likelihood ratio distance (DLR) are taken to indicate the strength of connection. The line then has the attributes
of connection strength, physical distance but not the direction of flow.
We addressed the initial question, is the genetic exchange of Seriatopora hystrix within the GBR a small-world network, in the following manner. The values of average minimum path length (L), average degree (the average number of connections between vertices, <k>) and cluster coefficient (CI) were analysed for the network created by the individual exchange of S. hystrix and compared with nine kinds of graph all of the same size (47 vertices), each created using a different process (Table 1). While the nine comparison networks have defined algorithms for construction it should be noted that the parameter selection will determine the topological outcome. For this comparison every network had a size of 47 vertices and the linkages were undirected.
The question of the clustering structure is addressed by examining the cluster membership of the S. hystrix
Fig. 1 Map of the genetic survey sites (solid blue circles and labelled where feasible).
Table 1 Networks used for comparison. Vertex number is denoted by N.
Network Construction method Parameters for Null Model
Geometric First a number of points are dropped on to a unit square, then two points will be connected with an undirected edge if they are closer to each other in Euclidean distance than a given radius (Csardi and Nepusz, 2006).
N=47, radius =0.24, torus=TRUE
Forest Fire This network model resembles how a forest fire spreads by igniting (connecting) trees close by Leskovec et al. (2007). Vertices are added sequentially and edges are created with respect to the neighbouring configuration.
N=47, forward probability=0.39, backward burning ratio=0.32/0.37
Watts Strogatz
First a lattice is created with the given dimension, final size and neighbourhood size arguments. Then the edges of the lattice are rewired uniformly randomly with set probability (Watts and Strogatz, 1998).
Dimension of starting lattice =1, N=47, neighbourhood =5, rewiring probability =0.00,0.02, 0.05, 0.1
Barabasi-Albert scale free model
One vertex is added in each time step and edges are then created to link existing vertices with preferential
attachment,
P k
( )
k
(Barabasi and Albert, 1999) where k is the degree and
is a constant.N=47, preferential attachment power = 1, number
of edges to add in each time step =
47
Star This algorithm creates a star graph, in which every single vertex is connected to the centre vertex and no other (Csardi and Nepusz, 2006).
N=47
Lattice This pattern is represented by a lattice of 2 dimensions composed of a replicating set of four vertices joined in a square (Csardi and Nepusz, 2006).
Dimensions of lattice =
47
by47
Erdos Renyi Random
Initially the vertices are created then the set number of edge are allocated randomly (Erdos and Renyi 1959).
N=47, number of edges=230
Tree This model is based on a regular tree with 3 edges connecting the ‘child’ neighbours (Csardi and Nepusz ,2006).
N=47, children = 3
Complete This graph has every vertex connected to every other vertex (Csardi and Nepusz ,2006).
N=47, self loops = FALSE
3 Results
What is the topology of the genetic exchange of S. hystrix network? The genetic survey sites (Fig. 1) using the DLR values were used to create a fully connected unidirectional network containing 47 vertices and 1081 edges
(Fig. 2). The edge weight distribution is also shown in Fig. 2. The weight value is based on the genetic distance and so small DLR values indicate that the populations are genetically similar. The histogram shows
that only a small number of edges (<130) has low DLR values (<5).
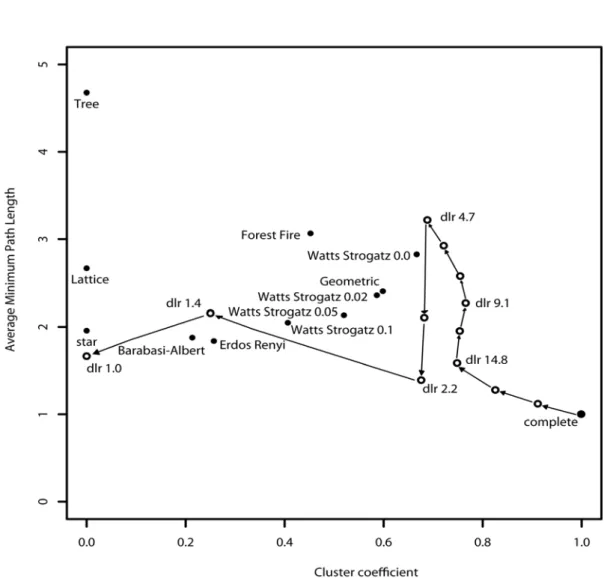
In order to investigate the dominant topology we removed the weaker edges (higher DLR values)
sequentially and recorded the cluster coefficient and the average minimum path. The value of these metrics changes as the weaker edges are removed (Fig. 3). Comparing to a selection of null models (Table 1), Fig. 3 shows the topology shifts towards the small world models constructed by the Watts-Strogatz and Geometric algorithms.
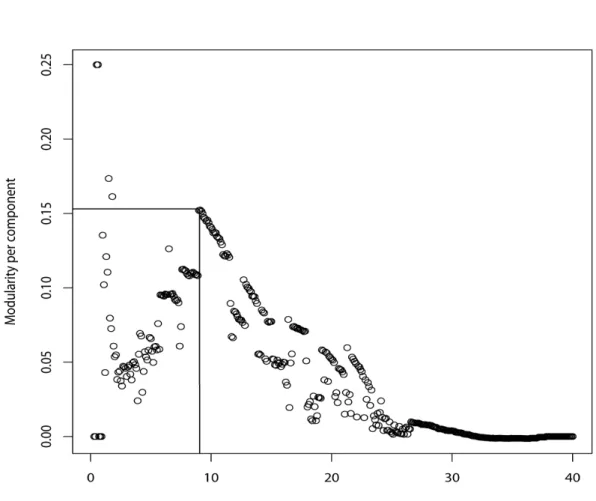
only 307 edges remained with weights less than 9.1 (Fig. 5). There was one connected component (connected section of network) and two isolated populations (Osprey Reef and Ribbon Reef 53). Removing edges below this threshold quickly fragments the network (Fig. 4). Based on this edge threshold of 9.1 (modularity = 0.45 for 3 components) the network has a cluster coefficient of 0.76, an average minimum path length of 2.2 and an average degree of 13.0.
Fig. 2 Histogram of the edge weight distribution (a) and network of the DLR linkages showing
Fig. 4 Plot of the modularity per component as the edge weight threshold is changed from 40 to 0, effectively removing the weaker edges (note: high edge weight=high DLR value=weakly associated populations). The lines indicate an optimal modularity
Fig. 5 Display of the genetic network with edges greater than 9.1 removed showing the cluster structure with 3 components (green, red, blue). Osprey Reef and Ribbon Reef 53 are not shown as they are not connected at this threshold level where DLR <
9.1.
triangular loops than the hydrodynamic network (adjusted for directional links) implying higher clustering at a local scale.
We compared the nine null models (Table 1, Fig. 3) to the S. hystrix network (at 9.1 or less edge weight). The S. hystrix network was more clustered but with a similar average minimum path length than the small world models based on the Geometric and Watts Strogatz algorithms. The S. hystrix network has a smaller average minimum path length than the Forest Fire model but larger than the Erdos Renyi and Barabasi Albert models. This highlights the relative proportion of long distance connections that serve to reduce the path length. The Tree, Lattice and Star models have no triangular clusters but the S. hystrix network has an average minimum path length half way between the Star and Lattice models. This implies that the S. hystrix network topology is not based on a simple diffusion model of propagule dispersal but also contains longer distance dispersal from currents.
The number of clusters for the S. hystrix network was found to be 3 (Fig. 5) when optimised for the modularity and based on the eigenvector algorithm. The relationship of the cluster membership to the geographic position is not clearly defined but there are broadly northern, central and southern groups. In particular for the “green” cluster some central reefs (Myrmidon, Davies and Broadhurst) are associated with the northern outer reefs such as the Ribbon reefs. The “red” coloured cluster includes reefs that extend from Heron Island to Lizard Island. The “blue” cluster is exclusively composed of southern reefs including those at the extreme latitude of 30 degrees south.
4 Discussion
We have discovered that the S. hystrix larval exchange network on the eastern coast of Australia, as determined by genetic relatedness, exhibits a small world pattern. This is consistent with our analysis of the connectivity properties of the GBR which did not relate to any specific species and inferred connectivity using hydrodynamic data only (Kininmonth et al., 2010). The implication from this finding is that, despite the highly localised recruitment strategy of S. hystrix (Underwood et al., 2009), the distant populations remain connected through rare long distance dispersal. Thus the entire S. hystrix metapopulation in the study region is more connected through a small world topology than the dominating local recruitment strategy would suggest.
The small world topology implies that the S. hystrix populations are resilient to local and mesoscale disturbances (Watts and Strogatz, 1998; Gaedke, 2008). In particular the recovery from severe disturbance for any particular site will be largely determined by the site’s location in the larval dispersal network. Underwood et al. (2009) found that limited recruitment dramatically reduced the recovery of reefs following severe disturbance. If a region is severely impacted by bleaching, like the 2001/2 event (Berkelmans et al., 2004), then migrating larvae will need to arrive via the long distance water currents rather than the nearby reefs. With an average minimum pathway length of 2.2, larvae from distant reefs in the GBR (with potentially a more robust suite of alleles (van Oppen and Gates, 2006)) could arrive in less than 3 migration events. This property of being closely connected to distant vertices through intermediate clusters is typical of small-world networks. At a larger scale, Treml et al. (2008) used an Eulerian advection–diffusion approach to measure connectivity across the Pacific reefs and found that the population clusters could be weakly connected by long distance migration. Our research supports this perspective that coral and fish can be connected as a mesoscale metapopulation.
distance events. These clusters, as defined in Fig. 5, have a higher density of connections within the cluster than between the clusters. In many respects this relationship is a direct function of the physical location of the reefs within a complex hydrodynamic matrix. The far southern reefs such as Middleton, Elizabeth and Lord Howe (Fig. 1) rely on strong currents to sweep the larvae across approximately 1000 kilometres of open ocean (Noreen et al., 2009). The linkages between the southern cluster and the two GBR clusters highlight the fragile and infrequent bonds within the metapopulation especially in comparison to the bonds between the northern and central clusters. However this cluster model challenges the latitudinal and cross-shelf orientated divisions that presently group the GBR (Kerrigan et al., 2010). Instead the dense matrix of coral reefs, that give support to the name Great Barrier Reef, provides a highly interactive environment for complex metapopulation dynamics.
Determining where to sample, in a project such as this, requires a particularly difficult balance of resources and scientific focus. Sampling many populations in a small region will provide insight into the clustering character for S. hystrix but will be ineffective in understanding the long distance dispersal events. Ayre and Dufty (1994) found in their genetic sampling of S. hystrix in the GBR that each reef forms discrete populations that are infrequently linked by migration. The lagoonal sites, with minimal access to strong currents, tend to be genetically different to those in exposed locations (Ayre and Dufty, 1994; Underwood et al., 2007; van Oppen et al., 2008). To complicate matters further, sampling at multiple depths can also reveal strong genetic structure (Bongaerts et al., 2010; van Oppen et al., 2011). At a regional scale, sampling the populations that are isolated from the main reef complex, such as Osprey Reef (Fig. 1), highlight significant genetic distinctiveness (van Oppen et al., 2008; Noreen et al., 2009). Sampling within the strongly connected clusters such as the mid-shelf reefs (i.e. Emily, Tongue and Sudbury Reefs), focuses on populations with strong multiple connections to populations in the region. Stratified sampling, informed by the dispersal network (inferred from hydrodynamic modelling), will reveal the metapopulation structure.
The characterisation of the network as a larvae exchange system depends on more than just the topology but also includes the rate of exchange between populations. The strength of connection is a significant parameter used to model metapopulation dynamics (Roughgarden et al., 1988; Armsworth, 2002). However directly gauging the strength of larval exchange through field based surveys is a particularly difficult task (Palumbi, 2003; Jones et al., 2005). Empirical data are often lacking for the survival rate of each development stage for the migrating individuals and estimation of larval transport is only a small component of the metapopulation dynamics (Armsworth, 2002).
The power of a genetics study, such as this one, is that it provides information about real historical connections as determined by the genetic information in individuals. In contrast, measuring the water currents with a variety of instruments, and then translating this to Lagrangian particle movements, requires the acceptance of many assumptions known to be false or misleading. For instance in the GBR reef connectivity study by James et al (2002) larvae were released uniformly as a function of reef edge. The GBR reefs are complex structures with structural features resulting from wave and current influences (Hopley, 1982) and species, like S. hystrix, will not be uniformly distributed (Veron, 1986).
While genetic studies, require considerable field work and expensive analytical capacity the empirical data derived can directly target the key questions relating to metapopulation dynamics (Hellberg, 2007). How strongly connected are sites at a variety of scales? What influence does migration have on recovery after disturbance? Where should conservation efforts be focused in order to enhance the resilience of the coral and fish metapopulations?
Despite the exploration of the mesoscale genetic structure of coral being in its infancy we present the following hypothesis: local scale disturbances regularly reduce the relatively homogenous self-seeded populations (in both colony number and fecundity (Hughes et al., 2000; Wakeford et al., 2008), resulting in an increase in the effective recruitment rate of migrant larvae where the rate is a function of the neighbourhood dispersal topology. Importantly, the migration rate is a function of the inclusion within the heterogeneous larval exchange network.
This analysis has implications for coral reef system management. Conservation of regional biodiversity will be enhanced by the identification and protection of the reefs that maintain the established network (Almany et al., 2009). Protection measures, like marine protected area networks, will be more effective if focus is directed to reefs that provide source larvae, act as stepping stones linking distant clusters or are isolated (Palumbi, 2003; Kininmonth et al., 2011). Increasingly the emphasis for conservation is on the establishment of long term measures to ensure the persistence of populations in the face of catastrophes (Game et al., 2008; Game et al., 2008) and anthropogenic pressures (Lubchenco et al., 2003). Only by understanding the role of each population within the framework of dispersal related resilience can conservation measures hope to be successful (Hodgson et al., 2009; Beger et al., 2010).
Acknowledgements
Particular thanks are due to Jim Underwood for the DLR calculations and the rest of the genetic’s team at the
Australian Institute of Marine Science for the provision of the S. hystrix genetic data. Special acknowledgement is due to Tamas Nepusz and Gabor Csardi for the igraph package used for network analysis.
References
Almany GR, Connolly S, Heath DD, et al. 2009. Connectivity, biodiversity conservation and the design of marine reserve networks for coral reefs. Coral Reefs, 28: 339-351
Armsworth PR. 2002. Recruitment limitation, population regulation and larval connectivity in reef fish metapopulations. Ecology, 83: 1092-1104
Ayre D, Dufty S.1994. Evidence for restricted gene flow in the viviparous coral Seriatopora hystrix on Australia's Great Barrier Reef. Evolution, 48(4): 1183-1201
Ayre D, Hughes T. 2004. Climate change, genotypic diversity and gene flow in reef-building corals. Ecology Letters, 7: 273-278
Barabasi Al. 2002. Linked: the New Science of Networks. Perseus Publishing, Cambridge, USA Barabasi Al, Albert R. 1999. Emergence of scaling in random networks. Science, 286: 509-512 Bascompte J. 2009. Disentangling the web of life. Science, 325: 416-419
Baums IB, Paris CB, Cherubin LM. 2006. A bio-oceanographic filter to larval dispersal in a reef-building coral. Limnology and Oceanography, 51(5): 1969-1981
Beger M, Simon L, Game ET, et al. 2010. Incorporating functional ecological connectivity into spatial decision making for conservation. Conservation Letters, 4(5): 359–368
Berkelmans R, De'ath G, Kininmonth SJ, et al. 2004. A comparison of the 1998 and 2002 coral bleaching events on the Great Barrier Reef: spatial correlation, patterns and predictions. Coral Reefs, 23: 74-83 Bongaerts P, Riginos C, Ridgway T, et al. 2010. Genetic divergence across habitats in the widespread coral
Seriatopora hystrix and its associated symbiodinium. PloS One, 5(5): e10971
Brzustowski J. 2002. Doh assignment test calculator. http://www2.biology.ualberta.ca/jbrzusto/Doh.php Cowen RK, Gawarkiewicz G, Pineda JS, et al. 2002. Population connectivity in marine systems. National
Science Foundation, Durango, Colorado, USA
Systems: 1695. http://igraph.sf.net
De'ath G, Lough JM, Fabricius K. 2009. Declining coral calcification on the Great Barrier Reef. Science, 323: 116-119
Dormann CF. 2011. How to be a specialist? Quantifying specialisation in pollination networks. Network Biology, 1(1): 1-20
Erdos P, Renyi A. 1959. On random graphs. Publicationes Mathematicae, 6: 290-297
Ferrarini A. 2011. Network graphs unveil landscape structure and changes. Network Biology, 1(2): 121-126 Fortuna MA, Albaladejo RG, Fernandez L, et al. 2009. Networks of spatial genetic variation across species.
Proceedings of the National Academy of Sciences of U.S.A., 106(45): 19044-19049
Gaedke U. 2008. Ecological Networks. In: Analysis of Biological Networks (Junker B, Schreiber F, eds). Wiley-Interscience, Hoboken, USA
Game E, Watts ME, Wooldridge S, et al. 2008. Planning for persistence in marine reserves: a question of catastrophic importance. Ecological Applications, 18(3): 670-680
Game ET, McDonald-Madden E, Puotinen ML, et al.2008. Should we protect the strong or the weak? Risk, resilience and the selection of marine protected areas. Conservation Biology, 22: 1619-1629
Gardner TG, Côté IM, Gill JA, et al. 2005. Hurricanes and Caribbean coral reefs: Impacts, recovery patterns, and role in long-term decline. Ecology, 86(1): 174-184
Green DG, Sadedin S. 2005. Interactions matter- complexity in landscapes and ecosystems. Ecological Complexity, 2: 117-130
Hellberg ME. 2007. Footprints on water: the genetic wake of dispersal among reefs. Coral Reefs, 26: 463- 473
Hodgson JA, Thomas CD, Wintle B, et al. 2009. Climate change, connectivity anc conservation decision making: back to basics. Journal of Applied Ecology, 46: 964-969
Hopley D. 1982. The geomorphology of the Great Barrier Reef:Quaternary development of coral reefs. John Wiley-Interscience, New York, USA
Hughes T, Baird AH, et al. 2003. Climate change, human impacts, and the resilience of coral reefs. Science, 301: 929-933
Hughes T, Baird AH, Dinsdale EA, et al. 1999. Patterns of recruitment and abundance of corals along the Great Barrier Reef. Nature, 397: 59-63
Hughes T, Baird AH, Dinsdale EA, et al. 2000. Supply-side ecology works both ways: The link between benthic adults, fecundity and larval recruits. Ecology, 81(8): 2241-2249
James M, Armsworth P, Mason L, et al. 2002. The structure of reef fish metapopulations: modelling larval dispersal and retention patterns. Proceedings of the Rotal Society of London Series B, 269: 2079-2086 Jones GP, Planes S, Thorrold SR. 2005. Coral reef fish larvae settle close to home. Current Biology, 15(14):
1314-1318
Kerrigan B, Breen D, De'ath G, et al. 2010. Classifying the Biodiversity of the Great Barrier Reef World Heritage Area. Research Publication 104. Great Barrier Marine Park Authority: 29, Townsville, USA Kininmonth S, Beger M, Bode M, et al. 2011. Dispersal connectivity and reserve selection for marine
conservation. Ecological Modelelling, 222: 1272-1282
Kininmonth S, De'ath G, Possingham HP. 2010. Graph theoretic topology of the Great but small Barrier Reef world. Theoretical Ecology, 3(2): 75
Kininmonth S, van Oppen M, Possingham H. 2010. Determining the community structure of the coral
models of the Great Barrier Reef, Australia. Estuarine, Coastal and Shelf Science, 68: 36-46
Leskovec J, Kleinberg J, Faloutsos C. 2007. Graph Evolution: Densification and Shrinking Diameters. ACM Transactions on Knowledge Discovery from Data, 1(1) (article 2)
Lubchenco J, Palumbi SR, Gaines SD, et al. 2003. Plugging the hole in the ocean: The emerging science of marine reserves. Ecological Applications, 13(1): S3-S7
Luick JL, Mason LB, Hardy T, et al. 2007. Circulation in the Great Barrier Reef Lagoon using numerical tracers and in situ data. Continental Shelf Research, 27: 757-778
Marshall DJ, Monro K, Bode M, et al. 2010. Phenotype-environment mismatches reduce connectivity in the sea. Ecology Letters, 13: 128-140
Milgram S. 1967. The small world problem. Psychology Today, 2: 61-67
Mumby P. 1999. Can Caribbean coral populations be modelled at metapopulation scales? Marine Ecology Progress Series, 180: 275-288
Newman MEJ. 2006. Modularity and community structure in networks. Proceedings of the National Academy of Sciences of U.S.A, 103(23): 8577–8582
Noreen AM, Harrison P, Van Oppen M. 2009. Genetic diversity and connectivity in a brooding reef coral at the limit of its distribution. Proceedings of the Royal Society of Lodon Series B, 276: 3927-3935
Paetkau D, Waits LP, Clarkson P, et al. 1997. An empirical evaluation of genetic distance statistics using microsatellite data from bear (Ursidae) populations. Genetics, 147: 1943-1957
Palumbi SR. 2003. Population genetics, demographic connectivity and the design of marine reserves. Ecological Applications, 13(1): 5146-5158
Possingham HP, Roughgarden J. 1990. Spatial population dynamics of a marine organism with a complex life cycle. Ecology, 71(3): 973-985
Pritchard JK, Stephens M, Donnelly P. 2000. Inference of population structure using multilocus genotype data. Genetics, 155: 945-959
Roughgarden J, Gaines SD, Possingham HP. 1988. Recruitment dynamics in complex life cycles. Science, 241(4872): 1460-1466
Steuer R, Lopez G. 2008. Global Network Properties. In: Analysis of Biological Networks (Junker B, Schreiber F, eds). Wiley-Interscience, Hoboken, USA
Treml E, Halpin PN, Urban D, et al. 2008. Modelling population connectivity by ocean currents, a graph- theoretic approach for marine conservation. Landscape Ecology, 23: 19-36
Underwood JN, Smith LD, Van Oppen MJH, et al. 2007. Multiple scales of genetic connectivity in a brooding coral on isolated reefs following catastrophic bleaching. Molecular Ecology, 16: 771-784
Underwood JN, Smith LD, Van Oppen MJH, et al. 2009. Ecologically relevant dispersal of corals on isolated reefs: implications for managing resilience. Ecological Applicatons, 19(1): 18-29
Urban D, Keitt T. 2001. Landscape connectivity: A graph-theoretic perspective. Ecology, 82(5): 1205-1218 van Oppen MJH, Gates RD. 2006. Conservation genetics and the resilience of reef-building corals. Molecular
Ecology, 15: 3863-3883
van Oppen MJH, Bongaerts P, Underwood JN, et al. 2011. The role of deep reefs in shallow reef recovery: an assessment of vertical connectivity in a brrooding coral from west and east Australia. Molecular Ecology, 20: 1647-1660
van Oppen MJH, Lutz A, De'ath G, et al. 2008. Genetic traces of recent long-distance dispersal in a predominantly self-recruiting coral. PloS One, 3(10): 1-12
Wakeford M, Done T, Johnson CR. 2008. Decadal trends in a coral community and evidence of changed disturbance regime. Coral Reefs, 27: 1-13
Watts DJ, Strogatz SH. 1998. Collective dynamics of 'small-world' networks. Nature, 393(6684): 440-442 Werner FR. Cowen and C. Paris. 2007. Coupled biological and physical models. Oceanography, 20(3): 54-69 Zhang WJ. 2011a. Constructing ecological interaction networks by correlation analysis: hints from community
sampling. Network Biology, 1(2): 81-98