TinO
2n−1Magn´eli phases studied using density functional theory
A. C. M. Padilha,1,*J. M. Osorio-Guill´en,1,2A. R. Rocha,3and G. M. Dalpian1,†
1
Centro de Ciˆencias Naturais e Humanas, Universidade Federal do ABC, Santo Andr´e, SP, Brazil
2Instituto de F´ısica, Universidad de Antioquia UdeA, Calle 70 No. 52-51, Medell´ın, Colombia 3Instituto de F´ısica Te´orica, Universidade Estadual Paulista, S˜ao Paulo, SP, Brazil
(Received 4 February 2014; revised manuscript received 24 April 2014; published 31 July 2014)
Defects in the rutile TiO2structures have been extensively studied, but the intrinsic defects of the oxygen-deficient TinO2n−1phases have not been given the same amount of consideration. Those structures, known as Magn´eli phases, are characterized by the presence of ordered planes of oxygen vacancies, also known as shear planes, and it has been shown that they form conducting channels inside TiO-based memristor devices. Memristors are excellent candidates for a new generation of memory devices in the electronics industry. In this paper we present density-functional-theory–based electronic structure calculations for TinO2n−1Magn´eli structures using PBESol+U(0U5 eV) and Heyd-Scuseria-Ernzerhof functionals, showing that intrinsic defects present in these structures are responsible for the appearance of states inside the band gap, which can act as intrinsic dopants for the enhanced conductivity of TiO2memristive devices.
DOI:10.1103/PhysRevB.90.035213 PACS number(s): 71.20.Nr,71.15.Mb
I. INTRODUCTION
Resistance switching in oxides has been known for over half a century [1–4], but attention to this phenomena has received a boost since the realization of the memristor, an idea that was originally formulated by Chua in the 1970s [5,6]. Williams
et al. showed, by manufacturing, measuring, and switching
the resistance state of such a device, basically an oxide thin film, that the memristance is a property that arises naturally at the nanoscale [7].
The working principle of the memristive-based memory device is the storage of information using the resistance state of a metal-insulator-metal structure. This in turn can be changed (write operation) and measured (read) when subjected to an electric field. The insulator layer is a nanometer-thick thin film, which can be composed of a wide variety of materials, such as binary oxides [8], perovskites [9–12], as well as many other compounds, which are known for their resistance switching properties [13,14].
The attractiveness of these devices for memory storage resides in the fact that they would be faster, denser, and less power consuming than those available today [15]. However, the mechanism for memristance is not, at present, well understood at the atomic level. Many authors point to a phase transition taking place inside the oxide matrix for TiO2-based devices, leading to the formation of Magn´eli phases (TinO2n−1,
n=4,5) conducting channels [16,17]. Those structures can be regarded as oxygen-deficient TiO2, where the concentration of oxygen vacancies (VO) is such that those defects become organized in a shear-plane structure. The formation of these extended defects is exemplified by the operation (121)12[0¯11] in the rutile structure, where the first three indices refer to a plane in the rutile structure and the last three to a displacement vector in the same structure [18,19]. An example of this structure is presented in Fig.1.
Despite the existence of many studies about defects in rutile TiO2, both experimental [20–28] and theoretical [21,25], there are few works on the intrinsically defective Magn´eli phases [29–35]. Electronic structure calculations have been used to understand mainly the Ti2O3[32] and Ti4O7[29–31]. Experimental reports [33–35] of some of these structures are not conclusive about the origin of the increase of electrical conductivity with respect to the rutile phase, nor about the switching mechanism. The question that arises is how the presence of extended-defect structures is related to the increase of electrical conductivity in this case.
Aiming to provide a general insight on the electronic struc-ture of these oxygen-deficient oxides—which are known to exist—we present a systematic study based onab initiodensity functional theory (DFT) electronic structure calculations for TinO2n−1, 2n5. We used functionals based both on generalized gradient approximation (GGA) as well as on a hybrid approach (including part of the Hartree-Fock exchange contribution). On-site Coulomb interaction (DFT+U) for electrons in Ti(d) orbitals was also introduced, since there are questions as to the validity of using hybrid functionals in Ti-based oxides [36]. We show that these oxygen-deficient structures containing extended defects present localized states inside the gap, which in turn can act as intrinsic dopants to alter the transport properties of memristive devices.
II. SIMULATION DETAILS
Simulations were performed using the Vienna ab initio software package (VASP) [37–40], within the projector
FIG. 1. (Color online) Cut of the Magn´eli structure generated through the operation (121)1
2[0¯11]. The shear planes (121) are featured in blue.
ranged from 0–5 eV. For all structures spin polarization was taken into account. Monkhorst-Pack sampling was used for ionic relaxation with the GGA functional and Ŵ-centered meshes for PDOS calculations after that, using an energy cutoff of 520 eV. For the hybrid functional calculations, only
Ŵ-centered meshes were used for both relaxation and PDOS, with a smaller cutoff (400 eV), in such a manner that the
k points would be more equally spaced in all directions. Finally the 3p3d4sand 2s2pconfigurations were considered as valence electrons for Ti and O atoms respectively.
The use of the HubbardUparameter resulted in a change of the electronic structure when the system was driven from the delocalized regime (GGA functional calculation,U=0) that neglects the orbital dependence of the Coulomb interaction, to the regime where orbital dependence is included, (U >0) leading to a better description of localized states (Ti(d) orbitals). We used values forUthat ranged from 0–5 eV, but we report only the meaningful results forU=0 and 5 eV.
When possible, unit cell symmetry was used to obtain the primitive unit cell from crystallographic data using the
PHONOPY software [46]. All crystal structure images were
generated using theVESTAsoftware [47].
III. RESULTS A. Structural properties
TableIlists the space groups for all structures studied in this work. From x-ray diffraction experiments [48,49], it is known
TABLE I. Space group in the international and Schoenfiles notations for all TinO2n−1, (2n5 for the structures used in this work) after ionic relaxation.
Space Group
International (#) Schoenflies
Ti2O3 R¯3c(167) D3d
α-Ti3O5 Cmcm(63) D2h
β-Ti3O5 C2/m(12) C2h
γ-Ti3O5 C2/c(15) C2h
Ti4O7 P¯1 (2) Ci
Ti5O9 P1 (1) C1
that Ti2O3 presents a rhombohedral corundum-like structure with space group R¯3c where the Ti atoms are enclosed by oxygen in an octahedral format. These polyhedra are the building blocks of this structure, as well as all the other structures presented here, and hereafter will be referred to as TiO6octahedra. For Ti2O3, these building blocks are displaced in face-sharing pairs.
The Ti3O5 structure obtained from crystallographic databases was not unique. The three phases,α(orthorhombic, anosovite-like, group Cmcm) [50], β (monoclinic, group
C2/m) [51,52], and γ-Ti3O5 (monoclinic, I2/c)[53] were used for the calculations. Onodaet al.pointed out a first-order phase transition at approximately 440–460 K [54] betweenα
andβ-Ti3O5. The transition fromβ to the room-temperature
γphase at≈250 K was reported by Hong and ˚Asbrink [53]. Ti4O7presents a Magn´eli structure composed, as described in the other structures, by TiO6 octahedra for all the three phases characterized by Marezioet al.[55–57]. This structure can be viewed as infinite planes of rutile,n-TiO6 octahedra thick along the (121) direction of the rutile crystal, limited by a plane of defects (oxygen vacancies), which characterizes a crystallographic shear structure [19,29]. The unit cells obtained from crystallographic databases were triclinic and presented space groupP¯1 for the three known phases:
high-(HT), intermediate- (IT), and low-temperature (LT). The only difference between those structures was a slight displacement of the atoms, whose positions became essentially equal after ionic relaxation. This also has lead to identical PDOS in all cases. Because of that, we present only the results for the relax-ation using the LT phase as a starting configurrelax-ation in TableII. Finally, Ti5O9 belongs to the same Magn´eli series (TinO2n−1), presenting a triclinic unit cell. The difference is that the rutile-like planes are one extra unit of TiO6 thicker. The initial structure used for our calculations was obtained by Andersson [18].
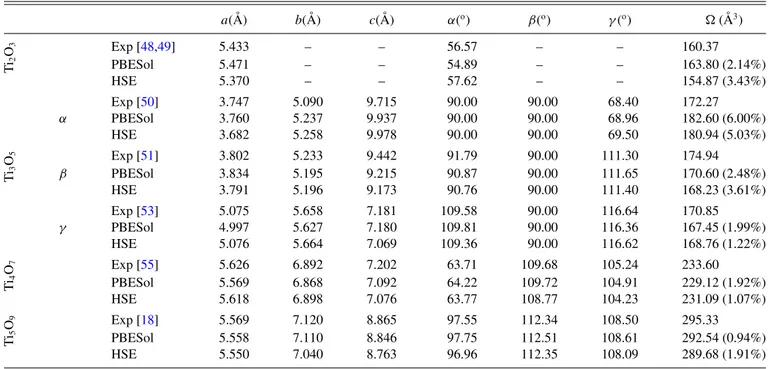
The structural parameters, after relaxation, for all oxides studied in this work are listed on Table II. The difference between experimental and calculated lattice parameters was lower than 6% for all structures and both functionals, and it was not possible to notice any systematic underestimation or overestimation of the values regarding the functional chosen for the simulations.
B. Electronic and magnetic properties
TABLE II. Experimental and theoretical values of lattice parameters for the Ti2O3,α,β, andγ-Ti3O5, Ti4O7, and Ti5O9structures. Mean absolute relative error for unit cell volume is also presented in parenthesis. Values presented are those of the primitive cells.
a( ˚A) b( ˚A) c( ˚A) α(o) β(o) γ(o) ( ˚A3)
Exp [48,49] 5.433 – – 56.57 – – 160.37
Ti
2
O3
PBESol 5.471 – – 54.89 – – 163.80 (2.14%)
HSE 5.370 – – 57.62 – – 154.87 (3.43%)
Exp [50] 3.747 5.090 9.715 90.00 90.00 68.40 172.27
α PBESol 3.760 5.237 9.937 90.00 90.00 68.96 182.60 (6.00%)
HSE 3.682 5.258 9.978 90.00 90.00 69.50 180.94 (5.03%)
Exp [51] 3.802 5.233 9.442 91.79 90.00 111.30 174.94
Ti
3
O5
β PBESol 3.834 5.195 9.215 90.87 90.00 111.65 170.60 (2.48%)
HSE 3.791 5.196 9.173 90.76 90.00 111.40 168.23 (3.61%)
Exp [53] 5.075 5.658 7.181 109.58 90.00 116.64 170.85
γ PBESol 4.997 5.627 7.180 109.81 90.00 116.36 167.45 (1.99%)
HSE 5.076 5.664 7.069 109.36 90.00 116.62 168.76 (1.22%)
Exp [55] 5.626 6.892 7.202 63.71 109.68 105.24 233.60
Ti
4
O7
PBESol 5.569 6.868 7.092 64.22 109.72 104.91 229.12 (1.92%)
HSE 5.618 6.898 7.076 63.77 108.77 104.23 231.09 (1.07%)
Exp [18] 5.569 7.120 8.865 97.55 112.34 108.50 295.33
Ti5 O9
PBESol 5.558 7.110 8.846 97.75 112.51 108.61 292.54 (0.94%)
HSE 5.550 7.040 8.763 96.96 112.35 108.09 289.68 (1.91%)
The PBESol calculations resulted in a metallic behavior. It is evident from the Ti2O3 PDOS in Fig. 2 that some states, mainly composed of Ti(d) orbitals, move away from the unoccupied levels as the parameter Uis increased, reaching the same qualitative results as in the HSE case for U =5. This effect was expected owing to the better description, compared to GGA, ofd orbitals by hybrid functionals [59] as well as the more localized character of these orbitals with respect to increasingU. These levels can be interpreted as a defectlike level inherent to the crystalline structure, which can be split from the other Ti(d) states that are unoccupied with increasingU.
Experimental Eg for this structure is 1 eV [60], which
is in excellent agrement with the results using PBESol+U,
U=5 eV, and HSE, given that the band gap is interpreted as the energy difference between the defect levels and the CBM in Fig.2.
FIG. 2. (Color online) Ti2O3PDOS obtained with PBESol func-tional (top), PBESol+U(middle panel), and HSE (bottom).
In the case of Ti3O5, some states—mainly of Ti(d) character—were split from the unoccupied levels, leading to the formation of defect levels inside the band gap when used
U=5, while for HSE calculations, some states remained very close to the Fermi energy, leading to a metalliclike character forβ- andγ-Ti3O5(Fig.3). According to Raoet al.[61] and Bartholomew and Frankl [33], this system is a semiconductor for temperatures below≈400 K, therefore the description of the room-temperature phaseγ-Ti3O5as a metal by HSE is by no means correct.
As previously discussed, total energy, PDOS (Fig.4) and magnetization were essentially equal for LT, IT and HT-Ti4O7 calculations using PBESol functional. This was expected since DFT calculations always take place at T =0 K leading the system to relax to the LT structure in all three cases. Calculations with HSE showed that the magnetic ordering is dependent on initial conditions, although it does not influence the final atomic arrangement. The presence of magnetization in these structures leads to a lower-energy configuration, a fact that was confirmed with calculations without spin polarization, which resulted in higher total energies.
Similar results were obtained for Ti5O9 (Fig.5), but one striking difference was the depth of the defectlike levels in this case: about 1.8 eV lower than the CBM with the HSE functional. It is also worth pointing out that for this system, HSE gives different descriptions for Ti4O7and Ti5O9. The first seems to be a half metal whereas the former does not.
FIG. 3. (Color online) (a) α-, (b) β-, and (c) γ-Ti3O5 PDOS obtained with PBESol functional (top), PBESol+U(middle), and HSE (bottom).
FIG. 4. (Color online) Ti4O7PDOS obtained with PBESol func-tional (top), PBESol+U(middle), and HSE (bottom).
FIG. 5. (Color online) Ti5O9PDOS obtained with PBESol func-tional (top), PBESol+U(middle), and HSE (bottom).
no conclusive experimental data on the band-gap energy and for the latter, as to our knowledge, no reports at all. The band gap of Ti4O7 is reported to be 0.041 eV from conductivity measurements [62], 0.6 eV from spectroscopy data [63], and 0.25 eV from optical transmission data [64]. In principle, both HSE and U=5 result in compatible band gaps. Although the DFT+Uis not designed to increase the band gap, it is a consequence of the localization of thed orbitals when this methodology is used.
The magnetization for all structures was higher forU =
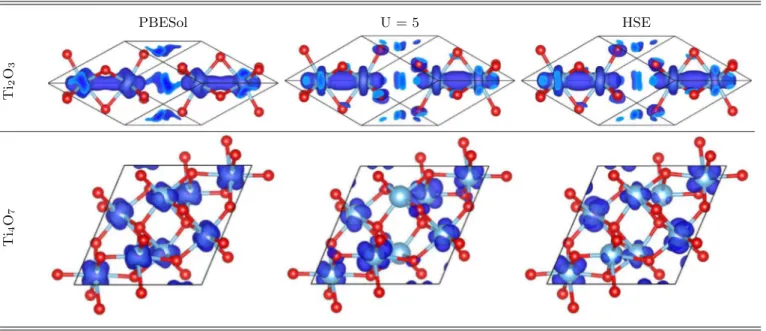
5 eV as well as HSE functional calculations compared to GGA alone, with the exception of Ti2O3. These results are shown in TableIII. As is known for the same type of defects (VO’s) in the TiO2rutile, the removal of oxygen atoms from the oxide structure leaves a pair of unbound electrons [36,65]. Each of the TinO2n−1phases presents twoVO’s per unit cell, therefore there are four electrons left behind. Magnetization density plots for TinO2n−1, 2n5 are also shown in Table III, where it is possible to identify these electrons laying on the Ti(d) orbitals through the unit cell. They are also responsible for the defect levels inside the band gap seen in all structures. The band decomposed charge density for both Ti2O3 and Ti4O7 defect levels are presented in TableIV. In those plots it is possible to notice that bothUand HSE were responsible for a better localization of these levels, which are clearly of Ti(d) character, presenting apparently the same hybridization with O(p) orbitals in both cases. This hybridization could be a problem, as pointed out in the literature, in the case of MnO polymorphs [66], where GW calculations where used as a benchmark for the correct ordering of Mn(d) levels. We could in principle follow the same path, but due to computational cost, we decided only to report those defect levels, and point out that they could be responsible for n-doping in these structures, which could be a possible explanation for their enhanced conductivity on memristors.
TABLE III. (Color online) Total magnetization per unit cell (Ti atom) in units of Bohr magnetons (μB) and respective magnetization
density(μ(r)=ρ↑(r)−ρ↓(r))plots over the unit cell for all TinO2n−1structures presented in this work obtained with PBESol,U=5, and HSE functionals.
Ti2O3
Ti3O5
Ti4O7 Ti5O9
α β γ
P
B
E
So
l
-0.06 (-0.01) 3.75 (0.62) 0.00 (0.00) 0.15 (0.02) 1.12 (0.14) 2.19 (0.22)
U
=
5
0.00 (0.00) 4.00 (0.67) 3.99 (0.66) 4.00 (0.67) 4.00 (0.50) 4.00 (0.40)
H
SE
0.00 (0.00) 4.00 (0.67) 0.94 (0.16) 4.00 (0.67) 4.00 (0.50) 2.75 (0.27)
Ti(d) electrons, which in turn leads to a better description of these orbitals. The hybrid approach relies on the fact that through the insertion of part of Hartree-Fock exchange in the exchange-correlation functional, there is a partial cancellation of the self interaction, considered as an intrinsic problem in GGA-based calculations [67]. Those different approaches seem to play a decisive role in the final electronic structure of the systems being studied, as could be seen in the different total magnetizations for these two structures, but qualitatively their description of the position of the defect levels and their
character is very similar. It is important to notice that the HSE calculations led to a metallic state forβ- andγ-Ti3O5, while for all other structures, a semiconductor PDOS was obtained (it was possible to notice the separation between occupied and unoccupied levels). This same semiconducting behavior was obtained using the HubbardUparameter. According to
Raoet al.[61] and Bartholomew and Frankl [33], the systems
studied in this work are all semiconductors for temperatures below 100 K. These results seem reasonable, given that DFT calculations always take place atT =0 K.
TABLE IV. (Color online) Band decomposed charge-density plots over the unit cell over the defect levels for Ti2O3 and Ti4O7 using PBESol, PBESol+U(U=5 eV), and HSE functionals.
E S H 5
= U l
o S E B P
T
i2
O3
T
i4
In the case of Ti2O3, the magnetization is very weak and present only on PBESol calculations. WhenUwas introduced, it becomes negligible, and the same physical interpretation can be given: a better description of the localization of Ti(d) orbitals. The same behavior ofU=5 is seen when the HSE functional is used, with the exception ofβ-Ti3O5and Ti5O9. This could be understood as observations of different local minima related to the different magnetic configurations. In fact, we performed other calculations for different magnetic orderings for all structures except Ti5O9and a difference of few meV was found between the total energy per unit cell without any restriction on the magnetic moments (shown in TableIII) and restricting the initial configuration to antiferromagnetic (AF)μ=0 configurations for Ti(d) electrons. This points out that those structures present a number of minima of the total energy with respect to magnetic ordering, but the difference is relatively small. In any case, it is clear that the localization is more pronounced in either situation.
IV. CONCLUSION
In this work we showed that DFT-based calculations are able to point out defect levels inside the band-gap region for all TinO2n−1, 2< n <5. Those defects, in the same way as defects on rutile TiO2, are mainly of Ti(d) character and exist because of the introduction of intrinsic VO’s in the structure. Those levels are either close or attached to the CBM when GGA functionals are used for calculations, but a better description of Ti(d) orbitals—through the HubbardU parameter, or a hybrid functional—can lead to the positioning of these levels away from the CBM, as shallow or even deep levels. Although we find an extended defect level, forming a narrow band, which has a local magnetic moment, the value of
the exchange couplingJis very small (at least for the different configurations tried).
The enhancement of the electronic conductivity observed for these oxides with respect to rutile could be explained, in principle, by the presence of these defects close to the CBM, which play the role of intrinsic dopants in these systems. This fact should be important in order to better understand the memristive devices. Similarities between the electronic structures around the CBM and with respect to the defect levels obtained with PBESol+U,U=5, and HSE are remarkable for the Ti2O3, Ti4O7, and Ti5O9. The Ti3O5on the other hand has a metallic character for HSE, while for PBESol+U,U =5, a band gap appeared.
A comparison between the PBESol+Uand HSE function-als was function-also presented, aiming to identify which of the two methodologies is best suited for the study of correlated oxide systems, as the TinO2n−1Magn´eli structures presented in this work. While the total magnetization results were not equal for all structures, the localization and character of the defect levels were similarly described with both methods. The fact that HSE calculations result in metallic behavior for two of the systems studied, which were all semiconductors according to PBESol+Ucalculations, while experimental evidence points out a semiconductor behavior, is an evidence that the latter methodology could be best suited for this kind of system.
ACKNOWLEDGMENTS
This work was supported by FAPESP, CNPq and CAPES (Brazil), and Vicerrector´ıa de Docencia-Universidad de An-tioquia (Colombia). The support given by Cenapad-SP in the form of computational infrastructure is also acknowledged. The authors would like to thank Professor H. Raebiger for the valuable advice.
[1] T. W. Hickmott,J. Appl. Phys.33,2669(1962). [2] K. L. Chopra,J. Appl. Phys.36,184(1965). [3] F. Argall,Sol. State Elec.11,535(1968). [4] O. W. Johnson,Appl. Phys. Lett.13,338(1968). [5] L. O. Chua,IEEE Trans. Circ. Theo. CT18,507(1971). [6] L. O. Chua and S. M. Kang,Proc. IEEE64,209(1976). [7] D. B. Strukov, G. S. Snider, D. R. Stewart, and R. S. Williams,
Nature (London)453,80(2008).
[8] K. Szot, M. Rogala, W. Speier, Z. Klusek, A. Besmehn, and R. Waser,Nanotechnology22,254001(2011).
[9] R. Muenstermann, T. Menke, R. Dittmann, and R. Waser,
Adv. Mat.22,4819(2010).
[10] K. Szot, W. Speier, G. Bihlmayer, and R. Waser,Nat. Mater.5,
312(2006).
[11] A. Beck, J. G. Bednorz, Ch. Gerber, C. Rossel, and D. Widmer,
Appl. Phys. Lett.77,139(2000).
[12] C. Rossel, G. I. Meijer, D. Br´emaud, and D. Widmer,J. Appl. Phys.90,2892(2001).
[13] R. Waser and M. Aono,Nat. Mater.6,833(2007). [14] Y. Hirose,J. Appl. Phys.47,2767(1976).
[15] D. S. Jeong, R. Thomas, R. S. Katiyar, J. F. Scott, H. Kohlstedt, A. Petraru, and C. S. Hwang,Rep. Progr. Phys. 75, 076502
(2012).
[16] D.-H. Kwon, K. M. Kim, J. H. Jang, J. M. Jeon, M. H. Lee, G. H. Kim, X.-S. Li, G.-S. Park, B. Lee, S. Han, M. Kim, and C. S. Hwang,Nat. Nanotech.5,148(2010).
[17] G. Hwan Kim, J. Ho Lee, J. Yeong Seok, S. Ji Song, J. Ho Yoon, K. Jean Yoon, M. Hwan Lee, K. Min Kim, H. Dong Lee, S. Wook Ryu, T. Joo Park, and C. S. Hwang,Appl. Phys. Lett.
98,262901(2011).
[18] S. Andersson, D. H. Templeton, S. Rundqvist, E. Varde, and G. Westin,Acta Chem. Scand.14,1161(1960).
[19] S. Harada, K. Tanaka, and H. Inui,J. Appl. Phys.108,083703
(2010).
[20] V. Henrich, G. Dresselhaus, and H. Zeiger,Phys. Rev. Lett.36,
1335(1976).
[21] M. Nolan, S. D. Elliott, J. S. Mulley, R. A. Bennett, M. Basham, and P. Mulheran,Phys. Rev. B77,235424(2008).
[22] W. G¨opel, and J. A. Anderson, D. Frankel, M. Jaehnig, K. Phillips, J. A. Sch¨afer, and G. Rocker,Surf. Sci.139,333
(1984).
[23] M. A. Henderson, W. S. Epling, C. H. F. Peden, and C. L. Perkins,J. Phys. Chem. B107,534(2003).
[24] S. Yang, L. E. Halliburton, A. Manivannan, P. H. Bunton, D. B. Baker, M. Klemm, S. Horn, and A. Fujishima,Appl. Phys. Lett.
[25] S. Wendt, P. T. Sprunger, E. Lira, G. K. H. Madsen, Z. Li, J. O. Hansen, J. Matthiesen, A. Blekinge-Rasmussen, E. Laegsgaard, B. Hammer, and F. Besenbacher,Science320,1755(2008). [26] K. Mitsuhara, H. Okumura, A. Visikovskiy, M. Takizawa, and
Y. Kido,J. Chem. Phys.136,124707(2012).
[27] C. M. Yim, C. L. Pang, and G. Thornton,Phys. Rev. Lett.104,
036806(2010).
[28] P. Kruger, J. Jupille, S. Bourgeois, B. Domenichini, A. Verdini, L. Floreano, and A. Morgante,Phys. Rev. Lett.108,126803
(2012).
[29] L. Liborio, G. Mallia, and N. Harrison,Phys. Rev. B79,245133
(2009).
[30] M. Weissmann and R. Weht,Phys. Rev. B84,144419(2011). [31] I. Leonov, A. N. Yaresko, V. N. Antonov, U. Schwingenschl¨ogl,
V. Eyert, and V. I. Anisimov,J. Phys.: Condens. Matter 18,
10955(2006).
[32] Y. Guo, S. J. Clark, and J. Robertson,J. Phys.: Condens. Matter
24,325504(2012).
[33] R. Bartholomew and D. Frankl,Phys. Rev.187,828(1969). [34] A. D. Inglis, Y. L. Page, P. Strobel, and C. M. Hurd,J. Phys. C:
Solid State Phys.16,317(1983).
[35] R. L. Clarke and S. K. Harnsberger, Am. Lab.20, 8 (1988). [36] A. Janotti, J. B. Varley, P. Rinke, N. Umezawa, G. Kresse, and
C. G. VandeWalle,Phys. Rev. B81,085212(2010). [37] G. Kresse and J. Hafner,Phys. Rev. B47,558(1993). [38] G. Kresse and J. Hafner,Phys. Rev. B49,14251(1994). [39] G. Kresse,Comp. Mat. Sci.6,15(1996).
[40] G. Kresse and J. Furthm¨uller,Phys. Rev. B54,11169(1996). [41] P. E. Bl¨ochl,Phys. Rev. B50,17953(1994).
[42] G. Kresse and D. Joubert,Phys. Rev. B59,1758(1999). [43] J. P. Perdew, A. Ruzsinszky, G. I. Csonka, O. A. Vydrov, G. E.
Scuseria, L. A. Constantin, X. Zhou, and K. Burke,Phys. Rev. Lett.100,136406(2008).
[44] S. L. Dudarev, G. A. Botton, S. Y. Savrasov, C. J. Humphreys, and A. P. Sutton,Phys. Rev. B57,1505(1998).
[45] J. Heyd, G. E. Scuseria, and M. Ernzerhof,J. Chem. Phys.118,
8207(2003).
[46] A. Togo, F. Oba, and I. Tanaka,Phys. Rev. B78,134106(2008). [47] K. Momma and F. Izumi,J. Appl. Cryst.44,1272(2011). [48] W. R. Robinson,J. Sol. St. Chem.9,255(1974). [49] S. Abrahams,Phys. Rev.130,2230(1963).
[50] A. A. Rusakov and G. S. Zhdanov, Doklady Akademii Nauk SSSR77, 411 (1951).
[51] S. ˚Asbrink and A. Magn´eli,Acta Cryst.12,575(1959). [52] I. Grey, C. Li, and I. Madsen,J. Sol. Stat. Chem.113,62(1994). [53] S.-H. Hong and S. ˚Asbrink,Acta Cryst. B38,2570(1982). [54] M. Onoda,J. Sol. State Chem.136,67(1998).
[55] Y. Le Page and M. Marezio,J. Sol. State Chem.53,13(1984). [56] M. Marezio, D. McWhan, P. Dernier, and J. Remeika,J. Sol.
State Chem.6,213(1973).
[57] M. Marezio and P. Dernier,J. Sol. State Chem.3,340(1971). [58] C. Di Valentin, G. Pacchioni, and A. Selloni,Phys. Rev. Lett.
97,166803(2006).
[59] F. Tran, P. Blaha, K. Schwarz, and P. Nov´ak,Phys. Rev. B74,
155108(2006).
[60] M. Uchida, J. Fujioka, Y. Onose, and Y. Tokura,Phys. Rev. Lett.
101,066406(2008).
[61] C. Rao, S. Ramdas, R. Loehman, and J. Honig,J. Sol. St. Chem.
3,83(1971).
[62] L. N. Mulay and W. J. Danley,J. Appl. Phys.41,877(1970). [63] M. Abbate, R. Potze, G. A. Sawatzky, C. Schlenker, H. J. Lin,
L. H. Tjeng, C. T. Chen, D. Teehan, and T. S. Turner,Phys. Rev. B51,10150(1995).
[64] D. Kaplan, C. Schlenker, and J. J. Since,Phil. Mag.36,1275
(1977).
[65] H.-Y. Lee, S. J. Clark, and J. Robertson,Phys. Rev. B86,075209
(2012).
[66] H. Peng and S. Lany,Phys. Rev. B87,174113(2013). [67] Y.-S. Kim, K. Hummer, and G. Kresse,Phys. Rev. B80,035203
![Table I lists the space groups for all structures studied in this work. From x-ray diffraction experiments [48,49], it is known TABLE I](https://thumb-eu.123doks.com/thumbv2/123dok_br/16348413.189392/2.911.74.444.961.1127/table-lists-groups-structures-studied-diffraction-experiments-table.webp)