Application of General Linear Model to the
Reduction of Defectives in Packaging Process of
Soap Industry
A. Senjuntichai, A. Pitthayakornpisuth
Abstract— The objective of this study is to improve the efficiency of the flow-wrap packaging process in soap industry through the reduction of defectives. At the 95% confidence level, with the regression analysis, the sealing temperature, temperatures of upper and lower crimper are found to be the significant factors for the flow-wrap process with respect to the number/percentage of defectives. Twenty seven experiments have been designed and performed according to three levels of each controllable factor. With the general linear model (GLM), the suggested values for the sealing temperature, temperatures of upper and lower crimpers are 185, 85 and 85 ๐C, respectively. Under the suggested process condition, the percentage of defectives is reduced from 12.47% to 5.51% and at the significant level of 5%, the percentage of defectives is between 5.05% and 5.98%.
Index Terms—Experimental design, General linear model, Regression analysis, Reduction of defectives
I. INTRODUCTION
It is widely known that a cost reduction is one of the most interesting tasks that a company in the high competitive markets should undertake. However there are many ways for the cost reduction to be started. For an industry, the practical and simple option of the cost reduction is the reduction of defectives. Defective is common undesirable problem and costs the company a lot of money. Usually, a finished product is the most expensive part needed to be checked carefully. But sometimes it is not necessary to focus on the defective of the finish product especially when a raw material can be recycled.
In case of a studying soap industry, the defective in packaging process seems not to be a significant problem since soaps from this packaging process can be repacked again. Therefore, the raw material, soap itself, is not damaged. Only the packaging material is defective. However, a preliminary survey indicated in Pareto diagram of Fig. 1 shows that loss in packaging material is the highest loss of the company. The loss caused by the packaging process is about 47.94% of the total loss and costs 3 million
Baht. There are three packaging processes for each kinds of packaging material which are flow wrap, wrapper and carton. Fig. 2 shows Pareto diagram of the percentage of the loss in each packaging process. The process of flow wrap produces the largest defectives among all kinds of packaging process. The objective of this study is therefore to reduce a number of defectives in flow wrap process by applying the statistical methods such as a regression analysis [1] and a general linear model (GLM). GLM [2], [3] is an efficient experimental design for linear relationship with unknown coefficient. It is a procedure for analyzing factors collected with the experiments. It is applied [4], [5], [6] to describe behavior or effect of independent factors as a function of an interesting variable.
Manuscript received December 8, 2009. This work was under the cooperative program between Department of Industrial Engineering, Faculty of Engineering, Chulalongkorn University and a studying company. The authors would like to thank the studying company for all information and supports that have bee useful in this project.
A. Senjuntichai is with Department of Industrial Engineering, Faculty of Engineering, Chulalongkorn University, Bangkok, 10330 Thailand (phone: 662-218-6827; fax: 662-251-3969; e-mail: [email protected]).
A. Pitthayakornpisuth, is a student in Department of Industrial Engineering, Faculty of Engineering, Chulalongkorn University, Bangkok, 10330 Thailand.
The paper is organized as follows: the second section details out the packaging process of the studying factory with the expected potential factor. Experiments are also designed according to factor analysis resulted from the regression. The experimental results are analyzed and discussed in the third section. Conclusions are finally provided in the last section.
0 500,000 1,000,000 1,500,000 2,000,000 2,500,000 3,000,000 3,500,000
Packaging Materials
Raw Materials Overfilled Work in Process 0% 20% 40% 60% 80% 100% 120%
Fig. 1 Losses and costs in company
0 200,000 400,000 600,000 800,000 1,000,000 1,200,000 1,400,000 1,600,000
Flow Wrap Wrapper Carton Others
0% 20% 40% 60% 80% 100% 120%
Fig. 2
39.31%
65.47%
86.52%
100%
Baht
47.94%
80.00%
100% 100%
Baht
Losses and costs in packaging process Proceedings of the International MultiConference of Engineers and Computer Scientists 2010 Vol III,
IMECS 2010, March 17 - 19, 2010, Hong Kong
ISBN: 978-988-18210-5-8
ISSN: 2078-0958 (Print); ISSN: 2078-0966 (Online)
II. FACTOR ANALYSIS AND DESIGN OF EXPERIMENT
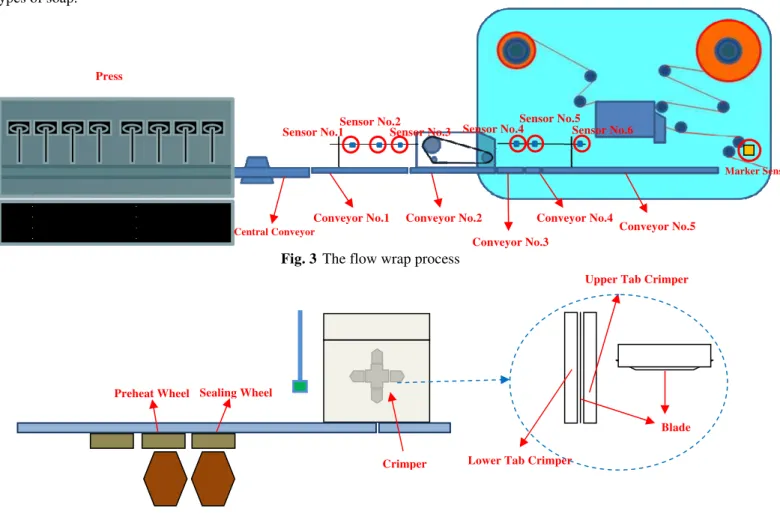
The flow wrap process consists of two machines, pressing and wrapper machines as shown in Fig. 3. A pressing machine is to press slug to form a bar of soap.
To study which factors have the significant effect on the number of defectives, the values of all factors as well as the numbers/percentages of defectives as the response have been recorded from 36 shifts of the flow wrap process. The average percentage of defectives is 12.47%.
Eight bars of soap are produced from one pressing time. The soaps are then transported to the wrapper machine through conveyor numbers 1-5. The purpose of the wrapper machine is to wrap each bar of soap by wrapper and to produce the product in the form of flow wrap package. One package of flow wrap consists of six bars of soap, one bar in one wrapper. The wrapper machine consists of the control panel, five conveyors, sealing machine and wrapper cutting.
A speed of all conveyors is automatically controlled by a sensor. Speed of conveyor numbers 1-3 depends on number of bars passing through the conveyors and counted by the sensor during a specific time. Incidentally, the conveyor speed is varied between the maximum and minimum pre-setting speeds while speeds of conveyor numbers 4 and 5 depend upon the speeds of conveyor numbers 2 and 3, respectively without maximum and minimum pre-setting speed. A wrapper cutting consists of four cutting sets. Each set has two blades called crimpers, upper and lower crimpers. The angle between the upper and lower crimper is set to be 90 degrees as shown in Fig.4.
From the preliminary study, there are fifteen factors listed in Table I expected to have effect on the percentage of defectives. Factor number 1, type of soap is only categorical factor while factor numbers 2-15 are the continuous factors. Therefore, the dummy variables, D1-D4 are defined for 5 types of soap.
The regression analysis is applied for the 36 sets of data. Result of the regression analysis from MINITAB illustrated in Table II presents the relationship between the percentage of defectives and twelve explanatory factors left in the analysis. Three factors, the minimum speed of conveyor numbers 2 and 3 as well as the speed of central conveyor are considerably constant and have been removed from the analysis as seen with the remark (*) in Table II. Consequently, the resulting linear model is
% Defect = - 3064 - 0.768 D1 + 0.084 D2 + 0.186 D3 + 0.348 D4 + 13.5 C1 Spd max + 9.3 C1 Spd min + 30.4 C2 Spd max - 0.101 C3 Spd max + 0.046 Wrapper Spd + 0.443 Temp Upper - 0.236 Temp Lower - 0.081 Preheat Temp + 0.288 Sealing Temp + 0.255 No. of Jam. (1)
The value 97.4% of R-Square and the p-value 0.000 of F-test in ANOVA show that the linear relationship displayed by Eq.1 is very strong for the prediction and estimation for the percentage of defectives. The residual plots and normality plot have been conducted. They indicate that the assumptions about error term are satisfied.
Press
Fig. 3 The flow wrap process
Sensor No.1 Sensor No.2 Sensor No.3
Sensor No.5
Sensor No.4 Sensor No.6
Conveyor No.1 Conveyor No.2
Conveyor No.5 Conveyor No.4
Conveyor No.3
Marker Sensor
Central Conveyor
Preheat Wheel Sealing Wheel
Upper Tab Crimper
Lower Tab Crimper
Blade
Crimper
Fig. 4 Wrapper cutting and crimpers
Proceedings of the International MultiConference of Engineers and Computer Scientists 2010 Vol III, IMECS 2010, March 17 - 19, 2010, Hong Kong
ISBN: 978-988-18210-5-8
ISSN: 2078-0958 (Print); ISSN: 2078-0966 (Online)
Therefore, at the significant level of 5%, the p-values of 4 factors which are smaller than 0.05 suggest that the percentage of defectives statistically depends on sealing temperature, temperatures of upper and lower crimpers and also number of wrapper jam. All three temperatures are controllable factors but the number of wrapper jam is uncontrollable. The suggestion from the regression analysis is to reduce the number of wrapper jam. The coefficient value of 0.255 for the number of jam shows that the percentage of defectives is decreased approximately by 0.255% if the number of wrapper jam is decreased by 1.
Table I Potential Factors
No. Factors Notation
1 Type of Soap Type No. 1 Type No. 2 Type No. 3 Type No. 4 Type No. 5
D1 D2 D3 D4 1 0 0 0 0 1 0 0 0 0 1 0 0 0 0 1 1 1 1 1 2 Maximum Speed of Conveyor # 1 (km/hr) C1 Spd max 3 Minimum Speed of Conveyor # 1 (km/hr) C1 Spd min 4 Maximum Speed of Conveyor # 2 (km/hr) C2 Spd max 5 Minimum Speed of Conveyor # 2 (km/hr) C2 Spd min 6 Maximum Speed of Conveyor # 3 (km/hr) C3 Spd max 7 Minimum Speed of Conveyor # 3 (km/hr) C3 Spd min 8 Speed of Central Conveyor (km/hr) Central Spd 9 Speed of Press (Bar/min) Press Spd 10 Maximum Speed of Wrapper (bars/min) Wrapper Spd 11 Temperature of UpperCrimper (๐C) Temp Upper 12 Temperature of LowerCrimper(๐C) Temp Lower 13 Temperature of Preheat Wheel (๐C) Preheat Temp 14 Temperature of Sealing Wheel (๐C) Sealing Temp
15 No. of Wrapper Jam No. of Jam
Table II Regression Analysis Output
To find the suggested value of each significant factor for the minimum defectives, the experiments have been designed according to three independent and controllable factors, sealing temperature, temperatures of the upper and lower crimpers. From the preliminary observation of 36 samples, the description and value of each factor are as follows;
• Sealing Temperature
Temperature in degree C for the sealing wheel is varied between 178°C and 190°C.
• Temperature of Upper Crimper
Temperature in degree C for the upper crimper is varied between 80°C and 90°C.
• Temperature of Lower Crimper
Temperature in degree C for the lower crimper is varied between 80°C and 90°C.
The objective of the experiment is to find the suggested values of these three factors with respect to minimum percentage of defectives. Therefore, the experiment consists of twenty seven experimental runs according to 3 levels of sealing temperature (180, 185 and 190 °C), 3 levels of temperature of upper crimper (80, 85 and 90 °C) and 3 levels of temperature of lower crimper (80, 85 and 90 °C).
Table III GLM output of the experiment
Analysis of linear regression equation:
Predictor Coef SE Coef T P Constant -3064 1630 -1.88 0.074 D1 -0.7682 0.9074 -0.85 0.407 D2 0.0842 0.5780 0.15 0.886 D3 0.1859 0.5896 0.32 0.756 D4 0.3484 0.6980 0.50 0.623 C1 Spd max 13.479 7.926 1.70 0.104
III. ANALYSIS AND DISCUSSION
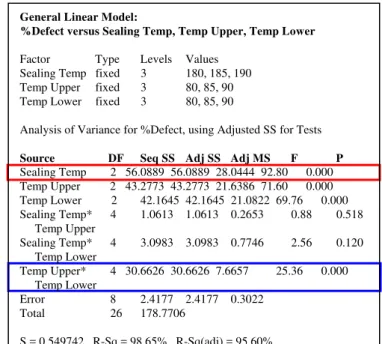
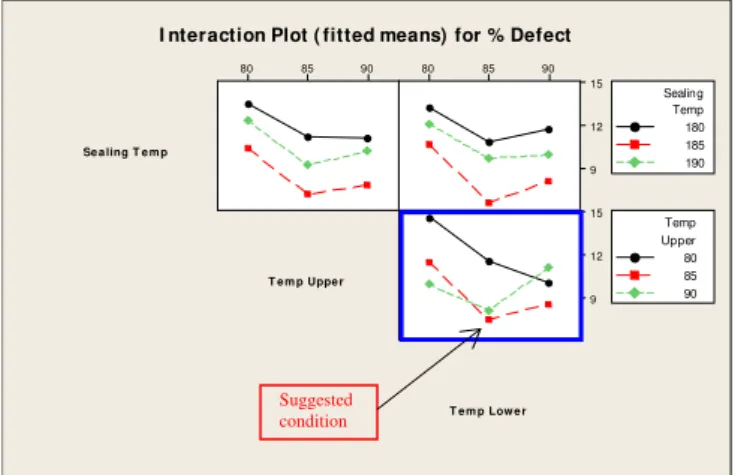
From the results of the experiment, the GLM method is performed to study the effect of each factor called main effect and also interaction effect of two factors on the percentage of defectives. Table III presents the output of GLM analysis by MINITAB. The p-value of 0.000 which is less than the significance level 0.05 shows that there is the interaction betweenthe temperatures of upper and lower crimpers. Fig. 5 presents the interaction plot between the temperatures of upper and lower of crimpers. The graphical illustration shows the highest percentage of defectives (about 15%) resulted from temperature at 80 ºC of both upper and lower crimpers while temperature at 85 ºC of both upper and lower crimpers C1 Spd min 9.31 10.84 0.86 0.400
C2 Spd max 30.40 21.99 1.38 0.181 C3 Spd max -0.1014 0.3833 -0.26 0.794 Wrapper Spd 0.0455 0.1061 0.43 0.673
Temp Upper 0.44335 0.05097 8.70 0.000 Temp Lower -0.23581 0.04775 -4.94 0.000
Preheat Temp -0.0814 0.1120 -0.73 0.475
Sealing Temp 0.28818 0.07616 3.78 0.001 No. of Jam 0.25471 0.06035 4.22 0.000
S = 0.980399 R-Sq = 97.4% R-Sq(adj) = 95.7%
Analysis of Variance
Source DF SS MS F P Regression 14 755.172 53.941 56.12 0.000 Residual Error 21 20.185 0.961
Total 35 775.356
*C2 Spd Min, C3 Spd Min and Central Spd are (essentially) constant and have been removed from the equation.
General Linear Model:
%Defect versus Sealing Temp, Temp Upper, Temp Lower
Factor Type Levels Values Sealing Temp fixed 3 180, 185, 190 Temp Upper fixed 3 80, 85, 90 Temp Lower fixed 3 80, 85, 90
Analysis of Variance for %Defect, using Adjusted SS for Tests
Source DF Seq SS Adj SS Adj MS F P Sealing Temp 2 56.0889 56.0889 28.0444 92.80 0.000 Temp Upper 2 43.2773 43.2773 21.6386 71.60 0.000 Temp Lower 2 42.1645 42.1645 21.0822 69.76 0.000 Sealing Temp* 4 1.0613 1.0613 0.2653 0.88 0.518 Temp Upper
Sealing Temp* 4 3.0983 3.0983 0.7746 2.56 0.120 Temp Lower
Temp Upper* 4 30.6626 30.6626 7.6657 25.36 0.000 Temp Lower
Error 8 2.4177 2.4177 0.3022 Total 26 178.7706
S = 0.549742 R-Sq = 98.65% R-Sq(adj) = 95.60%
Proceedings of the International MultiConference of Engineers and Computer Scientists 2010 Vol III, IMECS 2010, March 17 - 19, 2010, Hong Kong
ISBN: 978-988-18210-5-8
ISSN: 2078-0958 (Print); ISSN: 2078-0966 (Online)
produces the lowest percentage of defectives which is approximately 5%.
Fig. 6 also displays the main effects of individual factor on the percentage of defectives. According to the p-value 0.000 of sealing temperature, the graphical plot shows that sealing temperature at 185 ºC produces the lowest average percentage of defectives which is about 8.5 %.
Se a ling T e m p
T e m p Uppe r
T e m p Low e r 90
85
80 80 85 90
15
12
9
15
12
9
Sealing
190 Temp 180 185
Temp
90 Upper 80 85 I nteraction Plot ( fitted means) for % Defect
Fig. 5 The interaction plot of the experiment
M
e
a
n
o
f
%
D
e
fe
c
t
190 185
180 12
11
10
9
8
90 85
80
90 85
80 12
11
10
9
8
Sealing Temp Temp Upper
Temp Low er
Main Effects Plot ( fitted means) for % Defect
Fig. 6 The main effect plot of the experiment
Therefore, the suggested temperatures for sealing, upper and lower crimpers for the packaging process of flow wrap soap are as follows
Sealing temperature : 185 ºC
Temperature of upper crimper : 85 ºC Temperature of lower crimper : 85 ºC
Under this suggested process condition, the percentage of defectives from the experiment is resulted in 4.76%.
Table IV Numbers and percentages of defectives
Number Numbers of defectives Percentages of defectives
1 57 6.00
2 56 5.89
3 46 4.84
4 55 5.79
5 59 6.21
6 53 5.58
7 46 4.84
8 47 4.95
Total 419 5.51
To confirm the effectiveness of this suggested process condition, the samples of 950 flow warp products have been taken from the production line for 8 times.Table IV shows the numbers and percentages of defectives under the
described suggested process condition. The average percentage of defectives from 7,600 samples (950 samples per time * 8 times) is 5.51%. The 95% confidence intervals for the defectives are 5.05% - 5.98%.
IV. CONCLUSION
The number of defectives from flow warp process has been the highest number in the studying plant. With the 36 preliminary observations and analysis of regression, the percentage of defectives depends statistical significantly on sealing temperature, temperatures of upper and lower crimpers and number of machine jam. Since the last factor is uncontrollable factor, the experiments have been designed according to three levels of the first three factors. The number of machine jam should be reduced as many as it can be. Every time that the machine will be jammed, the defectives will be increased by approximately 0.255%.
Twenty experimental runs were conducted. At 95% confidence, it is evidently by GLM that there is interaction effect between the temperatures of upper and lower crimpers on the percentage of defectives. The sealing temperature is also independently effect on the percentage of defectives. It is graphically shown that all there temperatures should not be set at low or high values. The optimal value among three levels is the middle value of each temperature. By the graphical plots, the suggested conditions for the flow warp process are 185 ºC for the sealing temperature and 85 ºC for the temperatures of both upper and lower crimpers. Under this suggested conditions, the average defective is decreased by 55.8% from 12.47% to 5.51%. The defectives are varied between 5.05% - 5.98% with the 95% confidence level.
Under the GLM method, the values of factor are varied by three levels of the discrete values. Therefore the suggested conditions/value for each factor may be locally optimal. More experiments and analyses are preferred for the further study in order to determine values of factors that minimize the number of defectives.
Suggested condition
REFERENCES
[1] J.L. Devore, Probability and Statistics for Engineers and the Sciences. 7th ed. USA: Thomson Books/Cole, 2008, ch. 13.
[2] D.C. Montgomery, Design and Analysis of Experiment. 4th ed. USA: John Wiley & Sons, 1997.
[3] H.A. Dror, and D.M. Steinberg, “Robust Experimental Design for Multivariate Generalized Linear Models,” Technometrics, Vol. 48, No. 4, Nov. 2008, pp. 520-529
[4] Z. Cepeda, and E. Cepeda C., “Application of Generalized Linear Model to Data Analysis in Drinking Water Treatment.” Revista
Columbiana de Estadistica, Vol. 28, No. 2, Dec. 2005, pp. 233-242.
[5] B. Honari, J. Donovan, T. Joyce, and S. Wilson, “Application of generalized linear models for optimizing production stress testing.”
Annual Reliability and Maintainability Symposium, January 28-31,
2008, Las Vegas, NV, USA.
[6] A. Senjuntichai, S. Tangjitsitcharoen, and N. Rojanarowan, “Investigation of Ultrasonic Washing System on Reduction of Oil Contamination on Machining Parts” International Symposium of
Scheduling 2009, Nagoya, Japan, July 4-6, 2009, pp. 111-116.
Proceedings of the International MultiConference of Engineers and Computer Scientists 2010 Vol III, IMECS 2010, March 17 - 19, 2010, Hong Kong
ISBN: 978-988-18210-5-8
ISSN: 2078-0958 (Print); ISSN: 2078-0966 (Online)