Annales
Geophysicae
He
+
dominance in the plasmasphere during geomagnetically
disturbed periods: 1. Observational results
M. H. Denton1, G. J. Bailey2, C. R. Wilford2, A. S. Rodger3, and S. Venkatraman4
1Radio and Space Physics Group, University of Wales, Aberystwyth, UK (formerly of Space and Atmosphere Research Group, University of Sheffield, UK)
2Space and Atmosphere Research Group, University of Sheffield, UK 3Physical Sciences Division, British Antarctic Survey, Cambridge, UK 4Center for Space Sciences, University of Texas at Dallas, USA
Received: 24 August 2001 – Revised: 22 October 2001 – Accepted: 2 November 2001
Abstract. Observations made by the DMSP F10 satellite
during the recovery phase from geomagnetic disturbances in June 1991 show regions of He+dominance around 830 km altitude at 09:00 MLT. These regions are co-located with a trough in ionisation observed around 55◦in the winter hemi-sphere. Plasma temperature and concentration observations made during the severe geomagnetic storm of 24 March 1991 are used as a case study to determine the effects of geomag-netic disturbances along the orbit of the F10 satellite. Pre-vious explanations for He+dominance in this trough region relate to the part of the respective flux tubes that is in dark-ness. Such conditions are not relevant for this study, since the whole of the respective flux tubes are sunlit. A new mecha-nism is proposed to explain the He+dominance in the trough
region. This mechanism is based on plasma transport and chemical reaction effects in the F-region and topside iono-sphere, and on the time scales for such chemical reactions. Flux tubes previously depleted by geomagnetic storm effects refill during the recovery phase from the ionosphere as a re-sult of pressure differences along the flux tubes. Following a geomagnetic disturbance, the He+ion recovers quickly via the rapid photoionisation of neutral helium, in the F-region and the topside. The recovery of the O+and H+ions is less rapid. This is proposed as a result of the respective charge exchange reactions with neutral atomic hydrogen and oxy-gen. Preliminary model calculations support the proposed mechanism.
Key words. Magnetospheric physics (storms and
sub-storms, plasmasphere)
1 Introduction
Study of singly ionised helium within the plasmasphere be-gan over forty years ago (Nicolet, 1961; Hanson, 1962; Bor-deau et al., 1962; Taylor et al., 1963). Since then, observa-Correspondence to: M. H. Denton
tional and theoretical work has quantified the expected dis-tribution and behaviour of He+ in the plasmasphere (e.g. Taylor et al., 1970; Paresce et al., 1974; Murphy et al., 1979; Naghmoosh and Murphy, 1983; Chandler and Chap-pell, 1986; Newberry et al., 1989; Moffett et al., 1989; Bailey and Sellek, 1990; Heelis et al., 1990; Richards et al., 1991; Bailey and Sellek, 1992; Gonzalez and Sulzer, 1996), and the high-latitude region (e.g. Hoffman et al., 1974; Raitt et al., 1978; Heelis et al., 1981; Quegan et al., 1984). Theoretical progress was made by Quegan et al. (1981) who extended the transport equations first derived by Schunk (1975) by provid-ing the mathematical formulation which allowed He+to be included as a major ion in a fully-ionised, four-component plasma (electrons and the O+, H+ and He+ ions). Model
results by Quegan et al. (1984) showed that regions of He+ dominance can occur in the high-latitude topside ionosphere, and that the behaviour of He+in this region is largely deter-mined by plasma convection.
Little previous discussion has been made of the role of He+ during geomagnetically disturbed periods. Horwitz et al. (1984) presented results from the DE-1 satellite data for the storm of 12–13 November 1981. After the time of maxi-mum disturbance, He+is observed to rival H+as the domi-nant ion close to an L-shell of 3.5 and at an altitude between 1.5 and 2.8 RE. The concentrations of the other ion species measured by the satellite (O+, He++and O++) fall in the region of the mid-latitude trough (see Horwitz et al., 1984, Fig. 2, Panel B) leaving the H+ and He+ions dominant. A more complete description of the thermal plasma concentra-tion and structure within the plasmapause region using DE-1 and DE-2 data is given by Horwitz et al. (1986).
have been carried out by Moffett and Quegan (1983) and Rodger et al. (1992).
The work presented here is an investigation of features ob-served in the DMSP F10 data set during geomagnetically dis-turbed periods. The 24 March 1991 storm is used as a case study for the temperature and concentration changes that oc-cur during a storm. Following this, data from the disturbed periods in June 1991 are presented and the observed dom-inance of the He+ ion at 830 km altitude during the storm time recovery phase is discussed. A mechanism, based on chemical and plasma transport effects, is proposed to explain the dominance of the He+ion at this altitude.
2 The Defense Meteorological Satellite Program
Data used in the current study are from the F10 satellite of the current DMSP series. Its orbit is sun-synchronous and approximately in the 09:00/21:00 MLT orbital plane at an al-titude close to 830 km. The orbital period is around 101 min, giving just over 14 orbits a day, each separated in longitude by around 25◦(Venkatraman and Heelis, 1999).
Each satellite in the DMSP series carries instrumentation to measure several geophysical parameters along the satel-lite’s orbit. The “Special Sensor – Ions, Electrons and Scin-tillation” (SSIES) package on board the DMSP satellites con-sists of four instruments: Langmuir Probe (LP), Retarding Potential Analyser (RPA), Ion Drift Meter (DM) and Scintil-lation Meter (SM). The operation of the SSIES instrumenta-tion and DMSP data reducinstrumenta-tion are covered in detail by Heelis et al. (1978) and Greenspan (1994). In this current study, the electron temperature data are obtained from the LP instru-ment. Measurements of the ion temperature and concentra-tion, and the individual O+, H+and He+concentrations are obtained from the RPA instrument. The individual ion con-centrations can be determined when their respective concen-trations exceed 5% of the total ion concentration (Venkatra-man and Heelis, 1999).
3 The 24 March 1991 storm: a case study
3.1 Introduction
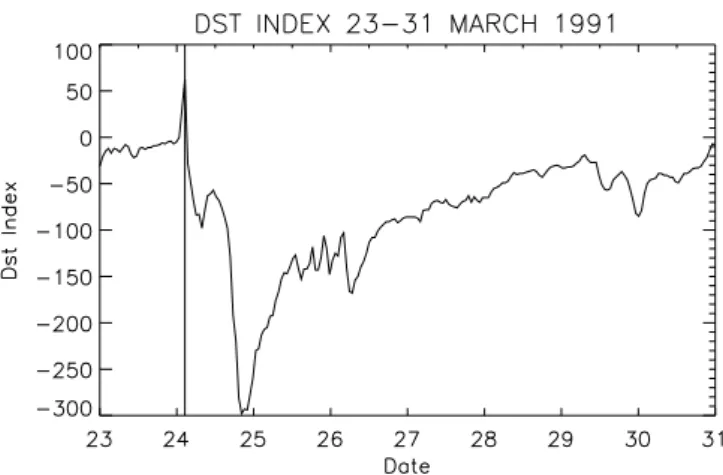
The severe magnetic storm which began on 24 March 1991 was observed by the DMSP F10 satellite from storm com-mencement around 03:00 UT through the recovery phase which lasted in excess of seven days. The progress of the storm can be seen by examining the Dst plot for the duration of the storm which is shown in Fig. 1. The maximum Dst excursion occurs late on 24 March. Rapid recovery occurs
Fig. 1. The Dst index from 23 to 31 March 1991. The dashed line
indicates the time of maximum Dst, and is defined as the start of the storm.
for a period of around one day, followed by a much slower recovery over the following week. During the day preceding the storm, Dst was slightly negative and broadly constant. At storm commencement, the increase in solar wind pressure caused Dst to increase sharply to an index of approximately +60 nT. During the storm main phase, Dst dropped to a mini-mum of around−300 nT, approximately 21 h after the initial storm commencement. The recovery period, which lasted more than seven days, was interspersed with further bursts of activity, causing more fluctuations in the Dst index. Con-tinued disturbances in the Dst index were observed follow-ing the recovery period, which continued up to and after 30 March.
3.2 Data analysis and results
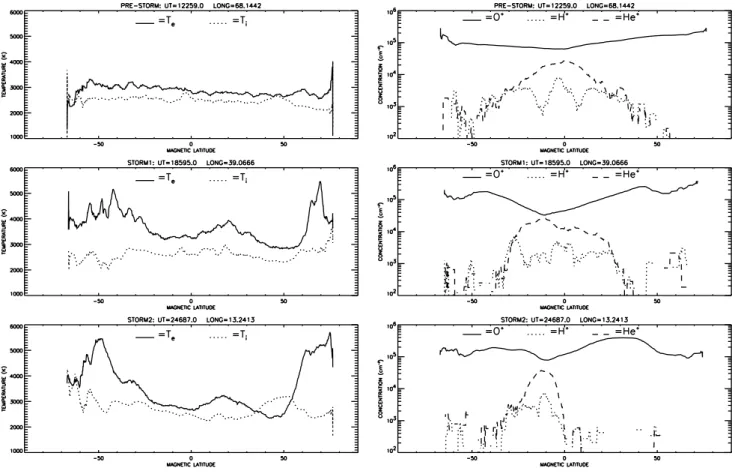
The RPA and LP instruments on board the F10 satellite were in constant operation during the storm period. Changes in the electron and ion temperatures and the ion concentrations are evident from the storm onset, and the data from three con-secutive orbits during the storm period are shown in Fig. 2 (denoted PRE-STORM, STORM 1 and STORM 2, respec-tively).
Before storm commencement (PRE-STORM), the elec-tron and ion temperatures were fairly constant with respect to magnetic latitude, with values close to 3000 K and 2500 K, respectively. The O+ion was the dominant ion, with a
Fig. 2. Observations of the ion and electron temperatures, and the O+, H+and He+ion concentrations, made close to 09:00 MLT by the RPA and LP instruments on board the DMSP F10 satellite, on three orbits surrounding the storm commencement of 24 March 1991. It should be noted that during parts of the orbits the concentration of H+and He+fell below the level of detectability. The spacecraft longitude (in degrees) and UT (in seconds) are given for the equatorward crossing of each orbit.
PRE-STORM and STORM 1 data sets, the STORM 1 data corresponds to that orbit which began approximately 30 min after the storm commencement, defined as the first increase in Dst which occurred close to 2:00 UT on 24 March.
The major difference between the PRE-STORM and STORM 1 temperature profiles is the sharp rise in electron temperature, Te, that occurs in the mid- to high-latitude re-gions. This is caused by the sudden increase in local heat-ing due to enhanced high-latitude particle precipitation. The US-Air Force Research Laboratory Auroral Boundary Index (ABI), calculated from the SSJ-4 instrument on the DMSP satellites, gives the equatorward boundary of precipitation for this orbit at close to 55◦ magnetic latitude (figure not shown). This is consistent with the peaks in electron tem-perature of 5700 K which occurred at around±55◦magnetic latitude. The low-latitude electron temperature also rose to around 4000 K at latitudes close to the magnetic equator.
During the STORM 2 orbit, the peak in Te reaches al-most 6000 K. In contrast, the ion temperature, Ti, only rises slightly in the mid-latitude region, to a peak just above 3000 K. However, during further orbits on the same day, Ti reaches a peak of almost 5000 K (figure not shown). This is the result of heat transfer between the electron and ion gases, and especially between the ion and neutral gases. Joule
heat-ing increases the temperature of the neutrals in the high-latitude region. Enhanced equatorward thermospheric winds may then drive such neutrals to lower latitudes, where ion-neutral coupling boosts the low-latitude ion temperature (e.g. Fuller-Rowell et al., 1994, 1996). In addition, since the ion thermal conductivity is much less than the electron thermal conductivity, the energy input to the ion gas that occurs in the D-, E- and F-regions of the ionosphere takes longer to be transferred to the topside than the corresponding energy input to the electron gas.
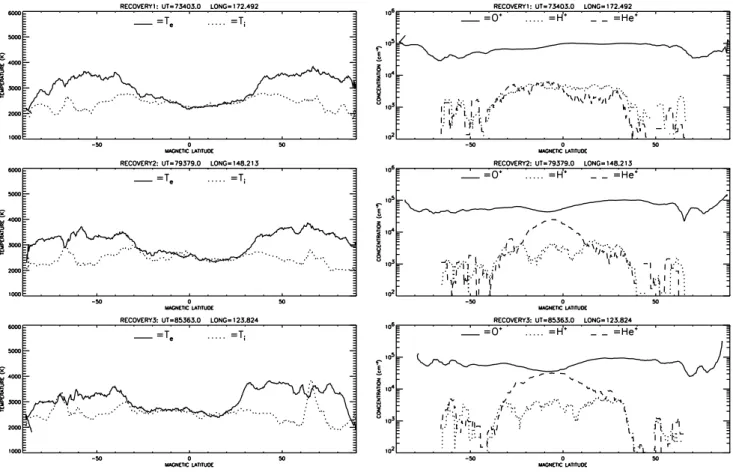
Fig. 3. As Fig. 2, except that the orbits are taken from 27 March, a day during the recovery period.
During the storm, the trough in O+concentration close to the equator initially deepens (STORM1) and the He+ion con-centration approaches that of O+at around 3×104cm−3. As the storm progresses (STORM2), this situation changes and the O+concentration close to the magnetic equator increases to around 1×105cm−3. Peaks in the O+ concentration oc-cur in the mid- to high-latitude region, again due to particle precipitation.
Figure 3 shows DMSP data from three consecutive orbits that took place during the recovery period of the storm (27 March). By this time, the high-latitude heating has dimin-ished considerably and the peak electron temperature has dropped to below 4000 K at magnetic latitudes close to±50◦. This is a result of the poleward “relaxation” of the magne-tospheric convective electric field. The plasmasphere has expanded and the auroral heating regions have moved pole-ward. The ion temperature remains fairly constant with re-spect to magnetic latitude at around 2500 K, but evidence of localised heating remains present in the high-latitude region. The total ion concentration during these orbits is fairly con-stant equatorward of around±50◦. On the RECOVERY 3 orbit, the He+ion concentration again approaches that of the O+ ion at around 4×104 cm−3. This behaviour is clearly the result of a depletion (or trough) in the O+concentration, coupled with an enhancement in the light ion concentration. Such depletions allow the He+ concentration to approach
that of O+ at numerous periods, both during the storm and throughout the recovery period. A mechanism for this obser-vation will be discussed later.
4 Data analysis – storm time effects during June 1991
4.1 Introduction
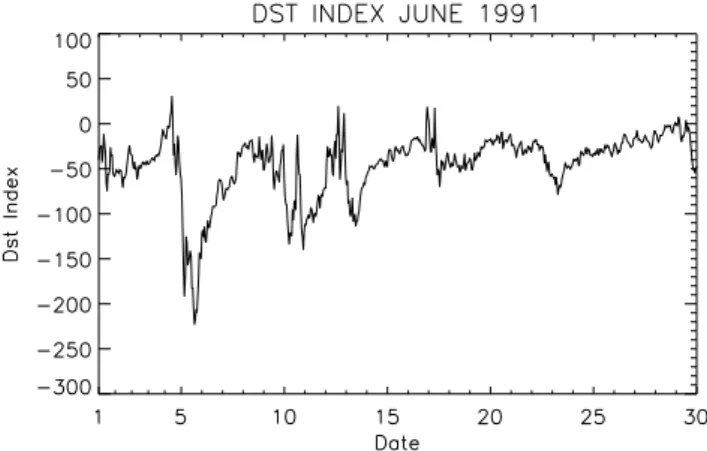
The geomagnetic activity for June 1991, as determined by the Dst index, is shown in Fig. 4. As can be seen from the variation of this index, the entire month was disturbed. Three X-class solar flares occurred in early June and sudden storm commencements were observed on 4, 8, 9, and 10 of the month (Pavlov et al., 1999). The period between 4–11 June has been considered as a single storm interval and has been the subject of previous experimental and theoretical in-vestigations. (Pavlov et al., 1999).
4.2 DMSP Observations of He+ dominance around the 830 km altitude – data analysis and results
Fig. 4. The Dst index for the month of June 1991. Almost the
en-tire month of June is either geomagnetically disturbed, or recover-ing from geomagnetically disturbed conditions. A particularly large disturbance occurred on 4 June.
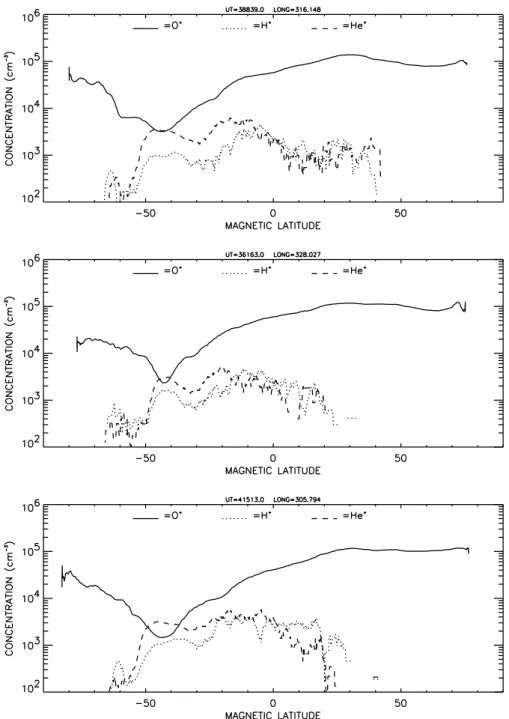
the Dst index). These features are found to occur at all lon-gitudes, and during periods when the entire flux tube is sun-lit, in comparison with the results presented by Hoffman et al. (1974), which showed regions of He+dominance for
par-tially lit flux tubes. Figure 5 shows examples of orbits dur-ing June 1991 where He+is the dominant ion, or is close to being the dominant ion. Due to the summer-to-winter hemi-sphere directed neutral wind, the F-region is elevated in the summer hemisphere and depressed in the winter hemisphere and, at 830 km altitude, this has the effect of increasing the O+concentration in the Northern Hemisphere and reducing its concentration in the Southern Hemisphere. Thermal ex-pansion also causes a relative increase in ion concentration in the summer hemisphere. It is clear from Fig. 5 that the regions where He+dominance occur are co-located with the trough in the O+concentration. Such regions are seen in the winter (southern) hemisphere during June 1991 and are ob-served between approximately 20◦and 55◦magnetic latitude throughout this month.
The increased depletion of O+ that occurs during dis-turbed periods is due to erosion of the plasmasphere. At a constant altitude of 830 km, the relative O+ concentration falls in the winter hemisphere, as the F-region is depressed by the neutral wind. However, further depletion of O+occurs as flux tubes that were previously co-rotating, and “filled” with ions of ionospheric origin, become affected by the magne-tospheric convective electric field during storm times. Such flux tubes may cease co-rotating and follow convection paths where conditions will significantly reduce tube concentra-tion, e.g. the tubes may move into darkness or partial dark-ness for long periods of time.
4.3 Discussion
Observations made during the geomagnetically disturbed month of June 1991 show regions close to the 830 km alti-tude at 09:00 LT, where ionised helium is at a higher con-centration than either ionised oxygen or ionised hydrogen.
This feature is only observed in the winter (southern) hemi-sphere between approximately 20◦and 55◦magnetic latitude and occurs during periods when recovery from geomagnetic storm conditions is thought to be occurring.
Hoffman et al. (1974) presented results using the ISIS-2 satellite data taken close to the 1400 km altitude. He+ was found to be the dominant ion in the winter hemisphere trough region at around 55◦ latitude for a evening satellite pass at 17:13–18:10 LT (see Fig. 4 of Hoffman et al., 1974). This was explained to be the result of part of the ionosphere at this latitude residing in darkness, thus suppressing ion production. However, the ISIS-2 satellite was in a sunlit region and thus, ionised helium continued to be produced above F-region altitudes via photoionisation. The Hoffman et al. (1974) results are, at first glance, very similar to the DMSP F10 observations. However, during the DMSP orbits, the F-region of the ionosphere and the satellite orbital path are both constantly sunlit and thus, production of O+ via photoionisation in the ionosphere occurs. Thus, the mech-anism which produced the He+ dominance noted by Hoff-man et al. (1974) and the mechanism responsible for the He+ dominance in the DMSP observations must be different.
Previous studies have examined the causes of He+ domi-nance in the topside ionosphere. Quegan et al. (1981) were the first to provide the mathematical formulation which al-lowed He+to be included in a fully-ionised four-component plasma. Model results by Quegan et al. (1984) showed that regions of He+dominance can occur in the high-latitude top-side ionosphere and the behaviour of He+ in this region is largely determined by plasma convection. The authors postu-lated four conditions that lead to regions of He+dominance. Although these conditions were deduced for the high-latitude topside region, they are reproduced below, since they are use-ful for comparison with the regions and conditions examined in the current study.
(i) Both O+and H+must be depleted. This implies a lack of exposure of the F-region to sunlight and any other cause of ionisation.
(ii) There must be sunlight on the topside ionosphere re-gion of the upper atmosphere, acting either to maintain He+ concentrations or to cause a rapid enhancement in He+.
(iii) Transit through a region satisfying condition (ii) must not be too fast, so that He+ has enough time to increase, while O+and H+are still at low abundances or decaying.
(iv) The decay region for O+ and H+ and the region of He+ dominance need not be in the same place. Depleted plasma convecting into a region satisfying condition (ii) can produce a region of He+dominance.
These conditions will henceforth be referred to as the “He+dominance conditions”.
4.3.1 A mechanism for He+dominance within the plasma-sphere
Fig. 5. Examples of periods when the
He+ ion is dominant, or comparable with the O+ ion in the trough region. These plots show data from the pe-riod when the plasmasphere is either disturbed, or recovering from disturbed conditions (4, 22, and 29 June, respec-tively). Such examples are typical of He+ dominance in the trough region which occurs during the recovery pe-riod throughout the month of June.
and the DMSP satellite altitudes, are constantly sunlit. Re-filling of storm-depleted flux tubes proceeds via ion upflow from the ionosphere. In addition, the concentration of the O+and H+ions is largely controlled by the charge exchange reaction between them
O++H↔O+H+. (1)
During the main phase of a geomagnetic storm, the plasmapause moves equatorwards and the “size” of the plas-masphere is reduced. This is caused by the flux tubes becom-ing involved in magnetospheric convection, resultbecom-ing in ion outflow to the outer magnetosphere, known as “erosion of the plasmasphere”. During the recovery phase, the
equator-ward boundary of convection moves poleequator-ward, and the pre-viously depleted flux tubes refill from the ionosphere. The electron concentration drop across the plasmapause bound-ary may approach a factor of 100 (e.g. Carpenter, 1963; Car-penter and Park, 1973).
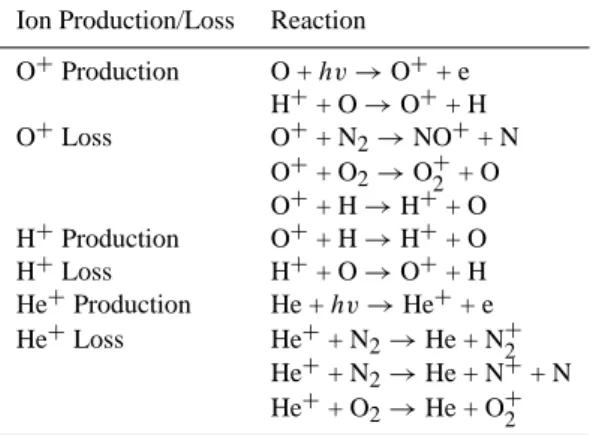
Table 1. The main production and loss reactions which determine
the concentration of O+, H+and He+in the topside ionosphere
Ion Production/Loss Reaction
O+Production O +hv→O++ e H++ O→O++ H O+Loss O++ N2→NO++ N
O++ O2→O+2 + O O++ H→H++ O H+Production O++ H→H++ O H+Loss H++ O→O++ H He+Production He +hv→He++ e He+Loss He++ N2→He + N+2
He++ N2→He + N++ N He++ O2→He + O+2
of increased chemical complexity. During the daytime, the chemical loss of He+is negligible. Production of O+ ions, which populate the topside ionosphere, proceeds primarily through photoionisation of neutral oxygen, at F-region alti-tudes. However, the only significant source (and sink) for H+in the ionosphere is the charge exchange reaction with neutral and ionised oxygen (Eq. 1). Direct photoionisation of neutral hydrogen is negligible, but during refilling of the flux tubes, the equilibrium reaction between O+and H+for the topside,
n(H+)n(O)=9/8n(H)n(O+), (2) (Hanson and Ortenburger, 1961) is maintained. In effect, this reaction means that the photoionisation of neutral oxygen is the ultimate source for both O+ and H+. It is proposed that the consequence of the above equilibrium condition is to “suppress” the recovery of O+and H+and permit regions of He+dominance to arise.
4.3.2 Preliminary model results
Model results using the Sheffield University Plasmasphere Ionosphere Model (SUPIM) are now used to examine whether or not regions of He+ dominance occur follow-ing a “model” storm. SUPIM has been developed over 30 years by members of the Space and Atmosphere Research Group at the University of Sheffield. The model solves cou-pled time-dependent equations of continuity, momentum and energy balance along closed flux tubes, from a base alti-tude of around 130 km in the Northern and Southern Hemi-spheres. These equations describe the physical and chemical processes that occur along the flux tube, and are solved for the O+, H+, He+, N+2, O+2 and NO+ions and the electrons. Inputs to the model include the neutral atmosphere composi-tion and horizontal wind, the solar EUV flux and the vertical plasma drift. Outputs include the plasma temperatures, con-centrations and field-aligned fluxes. A full description of the model and its evolution have been given by Bailey and Sellek (1990), Bailey and Balan (1996) and Bailey et al. (1997).
The model results presented here are based on the refilling of flux tubes following a “model” geomagnetic storm. This first study merely concentrates on the changes in flux tube concentration during a storm. As such, the concentrations of the major ions during the modelled storm are reduced to 1% of their pre-storm value. This fall in concentration is typical of the reduction in electron concentration across the plasma-pause boundary (e.g. Carpenter, 1963; Carpenter and Park, 1973), but the value is obviously much greater than any drop in the concentration that occurs at the plasmapause bound-ary at the altitude of the DMSP orbits (see Figs. 2 and 3). However, the current modelling study is meant to demon-strate that depletion and refilling of a flux tube can produce the conditions where He+dominance can occur; the study is not intended as a direct comparison with the DMSP data.
Following the initial depletion, the flux tube is left to re-cover via photoionisation of the neutral components, chemi-cal and transport effects. Calculations were performed for a flux tube with apex altitude of 8000 km for the model day (21 June 1991). The F10.7 and Ap inputs to the model were 220 and 99, respectively. A simple axial-centred dipole approx-imation to the Earth’s magnetic field was employed (Bailey and Balan, 1996). The reduction in ion concentration was imposed at 12:00 LT.
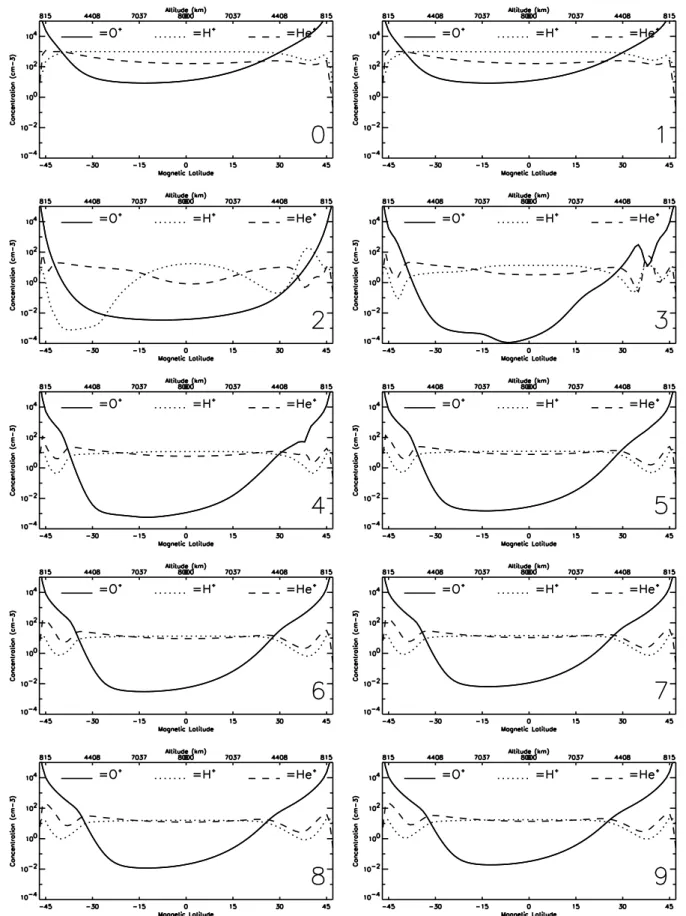
Figure 6 shows the modelled concentrations of the O+, H+ and He+ ions at 15 min intervals from 11:30 LT until 13:45 LT for a single flux tube, from a base altitude in the Northern and Southern Hemisphere of 130 km up to the apex altitude of 8000 km at the equator (L=2.26 – invariant lati-tude 48.26◦). The magnetic latitude of the flux tube corre-sponding to the F10 satellite altitude of 830 km is approxi-mately±44◦. The storm onset is taken to occur at 12:00 LT. Regions of He+dominance occur throughout all profiles fol-lowing the storm onset and are particularly evident during the first 30 min after the storm commencement. The O+and H+ ion concentrations recover much more slowly than the He+ ion concentration. The model calculations show that such re-gions of He+dominance are expected both at and above the 830 km altitude of the DMSP F10 orbit.
The modelled regions of He+dominance are greater in lat-itudinal extent in the winter hemisphere than in the summer hemisphere. In addition, the regions of He+ dominance in the model simulation occur slightly above the satellite alti-tude, and extend further in altitude into the topside. It should be noted that the He+concentration in the SUPIM model will be strongly affected by the concentration of neutral helium, and by the neutral wind. Values for these parameters are taken from the MSIS 86 (Hedin, 1987) and HWM 90 (Hedin et al., 1991) models, respectively. During disturbed peri-ods, both the concentration of the neutral constituents and the neutral air wind are expected to change rapidly (Rishbeth et al., 1987; Fuller-Rowell et al., 1996), and the values pro-vided by empirical models, such as MSIS 86 and HWM 90, may be inaccurate. In addition, during the current modelling study, the neutral atmosphere and wind taken from these em-pirical models were not time-dependent.
dominance between the DMSP observations and the model results, the simulation shows that He+is expected to be the dominant ion in regions of the topside during the immedi-ate recovery from a geomagnetic storm. The results appear to indicate that the DMSP observations are the “bottom-side edge” of a region of He+dominance that extends upwards of the 830 km altitude.
Despite the simplicity of these first model calculations, it has been shown that regions of He+ dominance are to be expected during refilling of flux tubes. These results form part of an ongoing study to produce an enhanced simulation of a geomagnetic storm using the SUPIM model. Results from this study will be reported in a future paper.
5 Discussion
The work presented in this paper has been prompted by fea-tures observed in the DMSP F10 database during geomagnet-ically disturbed periods. The major storm that occurred on 24 March 1991 has formed the basis of a case study of storm ef-fects on plasma temperature and concentration at around the 830 km altitude at 09:00 LT. Features in the data observed during June 1991 led to the investigation of regions of He+ dominance, particularly at times of recovery from geomag-netic storms.
For the DMSP data taken during the recovery period, three of the four He+ dominance conditions, originally proposed by Quegan et al. (1984), were fulfilled, while the remaining condition, condition (iv), was not applicable to the current study since the depletion and recovery of all three ions was presumed to occur in the same location.
(i) Both O+and H+must be depleted. This condition is ful-filled since the O+and H+(and the He+) concentrations are depleted due to the geomagnetic activity. Previously depleted flux tubes have returned to co-rotation and are refilling from the ionosphere.
(ii) The topside ionosphere must be sunlit. This condition is fulfilled since the relevant part of the F10 orbit, and the un-derlying ionosphere are sunlit throughout the period of study. (iii) He+must have enough time to increase in concentration, while O+and H+remain at low abundances, or are decaying. The recovery of He+occurs very rapidly due to direct pho-toionisation of neutral helium. The recovery of the O+ and H+ions is suppressed due to the charge exchange reaction between them.
6 Conclusions
This study represents further investigation of the role of He+ in the topside during geomagnetically disturbed periods, and complements previous work on He+ for the high-latitude ionosphere (Quegan et al., 1984) and periods when flux tubes are only partially sunlit (Hoffman et al., 1974).
The main conclusions of the current study are:
1. Regions of He+ dominance occur in the altitude region close to 830 km. These regions are co-located with the trough
in O+ concentration within the plasmasphere and are
ob-served to occur during the expansion and recovery phases of storms.
2. A mechanism is proposed whereby the refilling of He+ within previously depleted flux tubes proceeds, via photoion-isation, faster than the refilling of O+and H+. The charge exchange reaction between O+ and H+ suppresses the re-covery of these ions. This mechanism is supported by model calculations.
3. Further modelling studies are required to confirm this pro-posed mechanism for He+dominance. Such studies are cur-rently in progress.
Acknowledgements. Thanks are due to the DMSP project team and
to the World Data Centre C1 at RAL for providing the Dst and F10.7 data. Thanks are also due to the USAF Research Labora-tory, Hanscom AFB, for the Auroral Boundary Index. This work was supported by the Particle Physics and Astronomy Research Council (PPARC) under grant PPA/G/O/1999/00568 and research studentships to M. H. Denton and C. R. Wilford. M. H. Denton also wishes to thank the Winston Churchill Memorial Trust for the award of a Travelling Fellowship which funded an extended trip to the Center for Space Sciences at the University of Texas at Dallas.
Topical Editor G. Chanteur thanks A. Pavlov and another referee for their help in evaluating this paper.
References
Bailey, G. J. and Sellek, R.: A mathematical model of the Earth’s plasmasphere and its application in a study of He+at L=3, Ann. Geophysicae, 8, 171–190, 1990.
Bailey, G. J. and Sellek, R.: Field-aligned flows of H+and He+ in the mid-latitude topside ionosphere at solar maximum, Planet. Space Sci., 40, 751–762, 1992.
Bailey, G. J. and Balan, N.: A low-latitude ionosphere-plasmasphere model, STEP Handbook, Utah State University, Logan, 173–206, 1996.
Bailey, G. J., Balan, N., and Su, Y. Z.: The Sheffield University plasmasphere ionosphere model – a review, J. Atmos. Sol. Terr. Phys., 59, 1541–1552, 1997.
Bordeau, R. E., Whipple, E. C., Donley, J. L., and Bauer, S. J.: Experimental evidence for the presence of helium ions based on Explorer VIII satellite data, J. Geophys. Res., 67, 167–275, 1962. Carpenter, D. L.: Whistler evidence of a “knee” in the magneto-spheric ionisation density profile, J. Geophys. Res., 68, 1675– 1682, 1963.
Carpenter, D. L. and Park, C. G.: On what ionospheric workers should know about the plasmapause–plasmasphere, Rev. Geo-phys. Space Phys., 11, 133–154, 1973.
Chandler, M. O. and Chappell, C. R.: Observations of the flow of H+and He+along magnetic field lines in the plasmasphere, J. Geophys. Res., 91, 8847–8860, 1986.
Fuller-Rowell, T. J., Codrescu, M. V., Rishbeth, H., Moffett, R. J., and Quegan, S.: On the seasonal response of the thermosphere and ionosphere to geomagnetic storms, J. Geophys. Res., 101, 2343–2353, 1996.
Force Base, Massachusetts, 1994.
Hanson, W. B. and Ortenburger, I. B.: The coupling between the ionosphere and the normal F-region, J. Geophys. Res., 66, 1425– 1435, 1961.
Hanson, W. B.: Upper atmosphere helium ions, J. Geophys. Res., 67, 183–188, 1962.
Hedin, A. E.: MSIS-86 thermospheric model, J. Geophys. Res., 92, 4649–4662, 1987.
Hedin, A. E., Biondi, M. A., Burnside, R. G., Hernandez, G., John-son, R. M., Kileen, T. L., Mazaudier, C., Meriwether, J. W., Salan, J. E., Sica, R. J., Smith, R. W., Spencer, N. W., Wickwar, V. B., and Virdi, T. S.: Revised global model of thermospheric winds using satellite and ground-based observations, J. Geophys. Res., 96, 7657–7688, 1991.
Heelis, R. A., Bailey, G. J., and Hanson, W. B.: Ion temperature troughs and interhemispheric transport observed in the equatorial ionosphere, J. Geophys. Res., 83, 3683–3689, 1978.
Heelis, R. A., Murphy, J. A., and Hanson, W. B.: A feature of the behaviour of He+in the nightside high-latitude ionosphere dur-ing equinox, J. Geophys. Res., 86, 59–64, 1981.
Heelis, R. A., Hanson, W. B., and Bailey, G. J.: Distributions of He+at middle and equatorial latitudes during solar maximum, J. Geophys. Res., 95, 10 313–10 320, 1990.
Hoffman, J. H., Dodson, W. H., Lippincott, C. R., and Hammack, H. D.: Initial ion composition results from the Isis 2 satellite, J. Geophys. Res., 79, 4246–4251, 1974.
Horwitz, J. L., Comfort, R. H., and Chappell, R. H.: Thermal ion composition measurements of the formation of the new outer plasmasphere and double plasmapause during storm recovery phase, Geophys. Res. Lett., 11, 701–704, 1984.
Horwitz, J. L., Brace, L. H., Comfort, R. H., and Chappell, C. R.: Dual spacecraft measurements of plasmasphere-ionosphere cou-pling, J. Geophys. Res., 91, 11 203–11 216, 1986.
Moffett, R. J. and Quegan, S.: The mid-latitude trough in the elec-tron concentration of the ionospheric F-layer: a review of obser-vations and modelling, J. Atmos. Terr. Phys., 45, 315–343, 1983. Moffett, R. J., Bailey, G. J., Quegan, S., Rippeth, Y., Samson, A. M., and Sellek, R.: Modelling the ionospheric and plasmaspheric plasma, Phil. Trans. R. Soc. Lond. A 328, 255–270, 1989. Murphy, J. A., Bailey, G. J., and Moffett, R. J.: Helium ions in the
mid-latitude plasmasphere, Planet. Space Sci., 27, 1441–1449, 1979.
Naghmoosh, A. A. and Murphy, J. A.: A comparative study of H+ and He+at sunspot minimum and sunspot maximum, J. Atmos. Terr. Phys., 45, 673–682, 1983.
Newberry, I. T., Comfort, R. H., Richards, P. G., and Chappell, C. R.: Thermal He+ in the plasmasphere: comparison of ob-servations with numerical calculations, J. Geophys. Res., 94, 15 265–15 276, 1989.
Nicolet, M.: Helium, an important constituent in the lower
exo-He in the plasmasphere from observations of resonantly scat-tered He II 304- ˚A radiation, J. Geophys. Res., 79, 174–178, 1974.
Pavlov, A. V., Buonsanto, M. J., Schlesier, A. C., and Richards, P. G.: Comparison of models and data at Millstone Hill during the 5–11 June 1991 storm, J. Atmos. Sol. Terr. Phys., 61, 263– 279, 1999.
Quegan, S., Bailey, G. J., and Moffett, R. J.: Diffusion coefficients for three major ions in the topside ionosphere, Planet. Space Sci., 29, 851–867, 1981.
Quegan, S., Bailey, G. J., and Moffett, R. J.: Regions of He+ domi-nance in the high-latitude topside ionosphere, Planet. Space Sci., 32, 791–802, 1984.
Raitt, W. J., Schunk, R. W., and Banks, P. M.: Helium ion outflow from the terrestrial ionosphere, Planet. Space Sci., 26, 255–268, 1978.
Richards, P. G., Torr, D. G., and Miller, K. L.: O+, H+and He+ densities from the 200–1600 km altitude ionosphere at Arecibo: A comparison of theory and measurement, Modeling Magneto-spheric Plasma Processes, Geophysical Monograph 62, AGU, 1991.
Rishbeth H., Fuller-Rowell, T. J., and Rees, D.: Diffusive equi-librium and vertical motion in the thermosphere during a severe magnetic storm: a computational study, Planet. Space Sci., 35, 1157–1165, 1987.
Rodger, A. S., Moffett, R. J., and Quegan, S.: The role of ion drift in the formation of ionisation troughs in the mid- and high-latitude ionosphere – a review, J. Atmos. Terr. Phys., 54, 1–30, 1992. Roux, A., Cornilleau-Wehrlin, N., and Rauch, J. L.: Acceleration
of thermal electrons by ICW’s propagating in a multicomponent magnetospheric plasma, J. Geophys. Res., 89, 2267–2273, 1984. Schunk, R. W.: Transport equations for aeronomy, Planet. Space
Sci., 23, 437–485, 1975.
Taylor, H. A., Brace, L. H., Brinton, H. C., and Smith, C. R.: Direct measurements of helium and hydrogen ion concentration and to-tal ion density to an altitude of 940 km, J. Geophys. Res., 68, 5339–5347, 1963.
Taylor, H. A., Mayr, H. G., and Brinton, H. C.: Observations of hydrogen and helium ions during a period of rising solar activity, Space Res., X, 663–678, 1970.
Venkatraman, S. and Heelis, R. A.: Effects of solar activity vari-ations on adiabatic heating and cooling effects in the nighttime equatorial topside ionosphere, J. Geophys. Res., 104, 17 117– 17 126, 1999.