Single Cell FRET Analysis for the
Identification of Optimal FRET-Pairs in
Bacillus subtilis
Using a Prototype MEM-FLIM
System
Ruud G. J. Detert Oude Weme1, Ákos T. Kovács1¤, Sander J. G. de Jong2,
Jan-Willem Veening1, Jeroen Siebring1, Oscar P. Kuipers1 *
1Molecular Genetics Group, Groningen Biomolecular Sciences and Biotechnology Institute, Centre for Synthetic Biology, University of Groningen, 9747 AG Groningen, The Netherlands,2Lambert Instruments B. V., Oosteinde 16, 9301 ZP Roden, The Netherlands
¤ Current address: Terrestrial Biofilms Group, Institute of Microbiology, Friedrich Schiller University Jena, Jena, Germany
Abstract
Protein-protein interactions can be studiedin vitro, e.g. with bacterial or yeast two-hybrid systems or surface plasmon resonance. In contrast toin vitrotechniques,in vivostudies of protein-protein interactions allow examination of spatial and temporal behavior of such inter-actions in their native environment. One approach to study protein-protein interinter-actionsin vivois via Förster Resonance Energy Transfer (FRET). Here, FRET efficiency of selected FRET-pairs was studied at the single cell level using sensitized emission and Frequency Domain-Fluorescence Lifetime Imaging Microscopy (FD-FLIM). For FRET-FLIM, a proto-type Modulated Electron-Multiplied FLIM system was used, which is, to the best of our knowledge, the first account of Frequency Domain FLIM to analyze FRET in single bacterial cells. To perform FRET-FLIM, we first determined and benchmarked the best fluorescent protein-pair for FRET inBacillus subtilisusing a novel BglBrick-compatible integration vec-tor. We show that GFP-tagRFP is an excellent donor-acceptor pair forB.subtilis in vivo FRET studies. As a proof of concept, selected donor and acceptor fluorescent proteins were fused using a linker that contained a tobacco etch virus (TEV)-protease recognition se-quence. Induction of TEV-protease results in loss of FRET efficiency and increase in fluo-rescence lifetime. The loss of FRET efficiency after TEV induction can be followed in time in single cells via time-lapse microscopy. This work will facilitate future studies ofin vivo dy-namics of protein complexes in singleB.subtiliscells.
OPEN ACCESS
Citation:Detert Oude Weme RGJ, Kovács ÁT, de Jong SJG, Veening J-W, Siebring J, Kuipers OP (2015) Single Cell FRET Analysis for the Identification of Optimal FRET-Pairs inBacillus subtilisUsing a Prototype MEM-FLIM System. PLoS ONE 10(4): e0123239. doi:10.1371/journal.pone.0123239
Academic Editor:Sabato D'Auria, CNR, ITALY
Received:January 7, 2015
Accepted:March 1, 2015
Published:April 17, 2015
Copyright:© 2015 Detert Oude Weme et al. This is an open access article distributed under the terms of theCreative Commons Attribution License, which permits unrestricted use, distribution, and reproduction in any medium, provided the original author and source are credited.
Data Availability Statement:All relevant data are within the paper and in Genbank database under accession number KM009065.
Introduction
Bacteria have long been regarded as vesicles filled with proteins without any internal organiza-tion. However, the cytosol of bacterial cells is densely crowded [1], so a high level of organiza-tion is expected to ensure proper funcorganiza-tioning of cellular processes. Recently, there has been growing interest in elucidating potential spatial organization inside bacterial cells. A large body of work in bacteria has now revealed spatial organization for DNA-protein interactions, pro-tein localization, and propro-tein-propro-tein interactions [2–5]. Protein-protein interactions during cell division, regulatory interactions, and metabolic processes are increasingly studied.
Previously, techniques for studying protein-protein interactions were either indirect (e.g.
yeast- or bacterial two hybrid) orin vitromethods (e.g. Surface Plasmon Resonance). These
techniques are practical for screening potential interaction partners or to study binding affini-ties. In order to gain insight into thein vivodynamics of these interactions, thein vivomethod needs to produce time-resolved information. Förster Resonance Energy Transfer (FRET) al-lows time-resolved inspection of protein-protein interactions. Single cell FRET analysis alal-lows for the investigation of individual differences of protein-protein interactions, rather than studying an average FRET efficiency of a population.
Fluorescence microscopy only allows identification of protein co-localization due to its lim-ited resolution. FRET is the non-radiative energy transfer from an exclim-ited donor fluorophore to an acceptor fluorophore that can only occur when donor and acceptor are in very close vi-cinity of each other (<10 nm). FRET is therefore a useful tool for proving interactions via
exci-tation of the donor fluorophore and measuring emission of the acceptor molecule [6–8].
FRET was first described by Förster [9–11] and found widespread use in molecular biology
[12,13] ever since the introduction of various fluorescent proteins (FPs)[14]. FRET has been successfully applied to demonstrate interactions between proteins, e.g. to study the assembly of the divisome inEscherichia coli[15], and the composition of theBacillus subtiliscompetence machinery [16]. For a successful FRET experiment there are three requirements. First, the
donor and acceptor fluorophores are within 1–10 nm from each other. Second, the donor
emis-sion spectrum overlaps with the acceptor excitation spectrum, and third, the fluorophores have similar orientation of the dipoles [11]. While the spectral overlap is necessary, it is also a disad-vantage, because the acceptor can be excited by the light used to excite the donor instead of get-ting excited by non-radiative energy transfer. Also the donor emission can pass the acceptor emission filter. The potential of donor and acceptor bleedthrough demands corrections via
im-aging of samples with only a donor or acceptor fluorophore [6]. Another way to overcome the
bleedthrough problems caused by spectral overlap is measuring the fluorescence lifetime of the donor fluorophore in presence or absence of an acceptor. A population of excited fluorophores displays a characteristic decay of spontaneous emission.
In this study the FRET efficiency was determined in two ways: the first method is via the de-tection of sensitized emission [6]: the measurement of the acceptor emission that originates from the resonance energy transfer from the excited donor. The second method is by measur-ing fluorescence lifetime, which is defined as the time needed for the fluorescence intensity to decrease to 1/e (approx. 37%) of the initial intensity immediately after excitation [17] and is
commonly in the nanosecond range. Anything that quenches fluorescence–offers (more)
non-radiative decay options, such as FRET does–will decrease the fluorescence lifetime [18].
Frequency Domain Fluorescence Lifetime Imaging Microscopy (FD-FLIM) [11,17–19]
al-lows wide-field fluorescence lifetime determination via phase modulation [17]. For FD-FLIM
the excitation light is modulated, consequently resulting in a modulated emission signal. The lifetime of the fluorophore studied causes a delay in the phase of the modulated emission com-pared to the phase of the modulated excitation. By modulating the sensitivity of the detector at
not have any additional role in the study design, data collection and analysis, decision to publish, or preparation of the manuscript. The specific roles of these authors are articulated in the‘author contributions’section.
Competing Interests:S.J. is an employee of Lambert Instruments B.V., whose company has commercial interest in selling the MEM-FLIM system. There are no further patents, products in
the same frequency as the excitation signal, the phase delay between emission and excitation can be measured and a fluorescence lifetime can be calculated in every pixel of the image. FD-FLIM allows fast wide-field fluorescence lifetime acquisitions and is highly suitable for time-lapse microscopy and thus time resolved FRET analysis. See Zhaoet al. [20] and the
text-book of Lakowicz [17] for a detailed explanation of FD-FLIM.
Here, we investigated which FRET couple is best suited for dynamic protein-protein interac-tion studies in single cells of the Gram-positive model bacteriumB.subtilis[21]. Several genes coding for fluorescent proteins with potential good FRET properties were cloned pairwise,
in-tegrated at theamyElocus, expressed, and tested for FRET properties. The FPs were covalently
linked with a linker containing a TEV protease recognition sequence. An inducible TEV protease gene was co-cloned with the FRET-pair allowing conditional high/low FRET efficien-cy situations. FRET efficienefficien-cy was determined via sensitized emission and via a prototype MEM-FLIM system. The currently available FD-FLIM systems make use of an image intensifi-er, of which the photocathode is modulated at high frequencies (MHz). The image intensifier is typically the limiting factor for the spatial resolution, and is susceptible to damage by high light intensities. Therefore, FLIM recording is difficult to automate and is vulnerable. The prototype MEM-FLIM system used here modulates the CCD-sensor of the detector directly at the pixel level [20] resulting in a wide-field FLIM system that can easily be integrated in automated mi-croscopy set-ups for time-lapse mimi-croscopy to study dynamics of protein-protein interactions. Furthermore, and more importantly, the increased spatial resolution is sufficient for single bac-terial cell FRET-FLIM. To our knowledge this is the first study that incorporates single bacbac-terial cell FD-FLIM analysis on a wide-field microscope.
Materials and Methods
Bacterial strains, plasmids, oligonucleotides, and growth conditions
The strains, plasmids, and oligonucleotides used in this study are listed inTable 1,Table 2, andTable 3respectively.Escherichia coliMC1061 was used for cloning. All strains were
culti-vated on LB (Lysogeny Broth) medium at 37°C, supplemented with 100μg/ml ampicillin or
100μg/ml spectinomycin when appropriate. For the time-lapse experiment a chemically
de-fined medium was used.
Recombinant DNA techniques
DNA purification, restriction and ligation were done as described before [22]. Fast Digest
Restriction enzymes, Phusion DNA polymerase and T4 DNA ligase were obtained from Fer-mentas (St. Leon-Rot, Germany). Synthetic DNA was ordered from Mr. Gene (Regensburg, Germany).
Plasmid construction
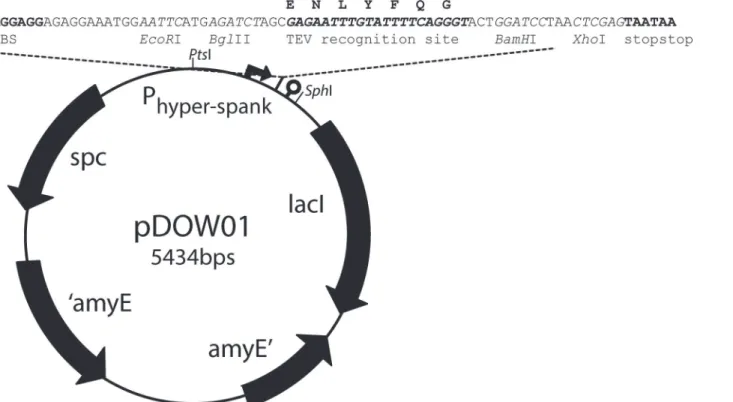
In this study, a newB.subtilisintegration vector, pDOW01, was constructed by modifying
pDR111 (kind gift of David Rudner). Both vectors integrate chromosomally in theamyElocus.
The BglBrick assembly standard [23] was introduced into pDR111 resulting in pDOW01 to
fa-cilitate easy cloning of biological parts.
Further, a TEV protease recognition site (ENLYFQG) coding sequence was inserted as a linker in the middle of the BglBrick cloning site. The BglBrick cloning site, withEcoRI,BglII,
BamHI andXhoI restriction sites, always remains present during cloning to realize up- or downstream insertion of a new part into an existing construct. The BglBrick cloning strategy
To create pDOW01 from pDR111 the following changes were made: the ORI forE.coliwas replaced with the ORI forE.colifrom pUC18 to remove theBglII andXhoI restriction sites, the AmpRwas removed, the BglBrick [23] restriction sites are introduced for cloning, and a TEV-protease recognition site was introduced in the middle of the BglBrick cloning site.
The homologous regions of theamyEgene and the spectinomycin marker from pDR111
(from 115–4707) and theE.coliorigin of replication (1888–2583) from the pUC18 vector were
PCR amplified including theNcoI andSpeI restriction sites in the primer sequences to combine
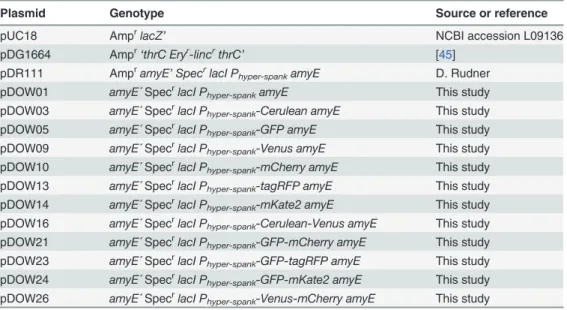
Table 2. The plasmids used in this study.
Plasmid Genotype Source or reference
pUC18 AmprlacZ
’ NCBI accession L09136
pDG1664 Ampr
‘thrC Eryr-lincrthrC’ [45]
pDR111 AmpramyE
’SpecrlacI Phyper-spankamyE D. Rudner pDOW01 amyE´SpecrlacI Phyper-spankamyE This study pDOW03 amyE´SpecrlacI P
hyper-spank-Cerulean amyE This study pDOW05 amyE´SpecrlacI P
hyper-spank-GFP amyE This study pDOW09 amyE´SpecrlacI Phyper-spank-Venus amyE This study
pDOW10 amyE´SpecrlacI Phyper-spank-mCherry amyE This study pDOW13 amyE´SpecrlacI P
hyper-spank-tagRFP amyE This study pDOW14 amyE´SpecrlacI P
hyper-spank-mKate2 amyE This study pDOW16 amyE´SpecrlacI Phyper-spank-Cerulean-Venus amyE This study
pDOW21 amyE´SpecrlacI Phyper-spank-GFP-mCherry amyE This study pDOW23 amyE´SpecrlacI P
hyper-spank-GFP-tagRFP amyE This study pDOW24 amyE´SpecrlacI P
hyper-spank-GFP-mKate2 amyE This study pDOW26 amyE´SpecrlacI Phyper-spank-Venus-mCherry amyE This study
doi:10.1371/journal.pone.0123239.t002
Table 1. The strains used in this study.
Strain Genotype Source or reference
E.coli
MC1061 F–araD139Δ(ara-leu)7696 galE15 galK16Δ(lac)X74 hsdR2(r
K–mK+)
mcrA mcrB1 rpsL(Strr)
Laboratory stock B.
subtilis
BSG1004 B.subtilisΔscpA and thrC::TEV-protease [32]
168 trpC2 Bacillus Genetic Stock
the fragments into a pDR-pUC-hybrid (seeTable 3for the primers). Subsequently, Quikchange
PCR (Agilent) was used to remove theBamHI site at position 745, with primers
pDR111_quik-change_FW and pDR111_quikchange_REV. The part between 2100–2528 bp in the original
pDR111 vector was redesignedin silicoand ordered from Mr. Gene (Regensburg, Germany),
with the following changes. TheXhoI,BglII andEcoRI sites were removed by point mutation.
TheSalI site was removed and in the upstream direction a RBS with a seven bp spacer to the
start codon was inserted. The start codon was followed by the BglBrick prefix, the TEV-prote-ase recognition site, the BglBrick suffix, two stop codons, and a strong terminator sequence.
The IPTG-inducible Phyper-spankpromoter from pDR111 remained unchanged. The synthetic
DNA was inserted into the pDR-pUC-hybrid by replacing the original 422 bp between the
SphI- andPstI-sites with the 529 bp synthetic DNA via restriction and ligation. This final
clon-ing step resulted in our basic clonclon-ing vector, pDOW01 (Fig 1). The newly constructed plasmid
was fully re-sequenced and the plasmid sequence has been submitted to the Genbank database under accession number KM009065.
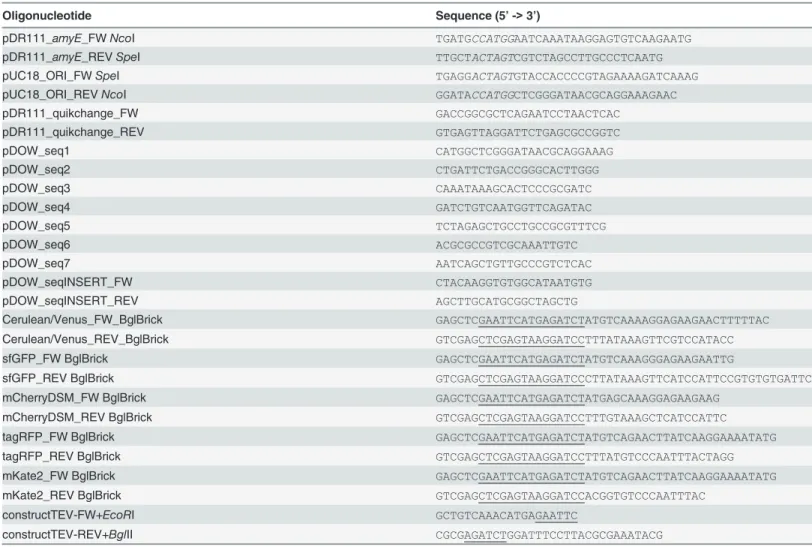
Table 3. The oligonucleotides used in this study.
Oligonucleotide Sequence (5’->3’)
pDR111_amyE_FWNcoI TGATGCCATGGAATCAAATAAGGAGTGTCAAGAATG
pDR111_amyE_REVSpeI TTGCTACTAGTCGTCTAGCCTTGCCCTCAATG
pUC18_ORI_FWSpeI TGAGGACTAGTGTACCACCCCGTAGAAAAGATCAAAG
pUC18_ORI_REVNcoI GGATACCATGGCTCGGGATAACGCAGGAAAGAAC
pDR111_quikchange_FW GACCGGCGCTCAGAATCCTAACTCAC
pDR111_quikchange_REV GTGAGTTAGGATTCTGAGCGCCGGTC
pDOW_seq1 CATGGCTCGGGATAACGCAGGAAAG
pDOW_seq2 CTGATTCTGACCGGGCACTTGGG
pDOW_seq3 CAAATAAAGCACTCCCGCGATC
pDOW_seq4 GATCTGTCAATGGTTCAGATAC
pDOW_seq5 TCTAGAGCTGCCTGCCGCGTTTCG
pDOW_seq6 ACGCGCCGTCGCAAATTGTC
pDOW_seq7 AATCAGCTGTTGCCCGTCTCAC
pDOW_seqINSERT_FW CTACAAGGTGTGGCATAATGTG
pDOW_seqINSERT_REV AGCTTGCATGCGGCTAGCTG
Cerulean/Venus_FW_BglBrick GAGCTCGAATTCATGAGATCTATGTCAAAAGGAGAAGAACTTTTTAC
Cerulean/Venus_REV_BglBrick GTCGAGCTCGAGTAAGGATCCTTTATAAAGTTCGTCCATACC
sfGFP_FW BglBrick GAGCTCGAATTCATGAGATCTATGTCAAAGGGAGAAGAATTG
sfGFP_REV BglBrick GTCGAGCTCGAGTAAGGATCCCTTATAAAGTTCATCCATTCCGTGTGTGATTC
mCherryDSM_FW BglBrick GAGCTCGAATTCATGAGATCTATGAGCAAAGGAGAAGAAG
mCherryDSM_REV BglBrick GTCGAGCTCGAGTAAGGATCCTTTGTAAAGCTCATCCATTC
tagRFP_FW BglBrick GAGCTCGAATTCATGAGATCTATGTCAGAACTTATCAAGGAAAATATG
tagRFP_REV BglBrick GTCGAGCTCGAGTAAGGATCCTTTATGTCCCAATTTACTAGG
mKate2_FW BglBrick GAGCTCGAATTCATGAGATCTATGTCAGAACTTATCAAGGAAAATATG
mKate2_REV BglBrick GTCGAGCTCGAGTAAGGATCCACGGTGTCCCAATTTAC
constructTEV-FW+EcoRI GCTGTCAAACATGAGAATTC
constructTEV-REV+BglII CGCGAGATCTGGATTTCCTTACGCGAAATACG
Plasmid construction
–
fluorophore insertion
The fluorescent proteins used in this study are: Cerulean (a cyan FP [25]), Venus (a yellow FP [26]), sfGFP(Sp) [27], mCherry (a red FP [28], which is codon optimized by DSM as described
before [27]), mKate2 (a far-red FP, Evrogen) and tagRFP (a red-orange FP, Evrogen). Codon
optimization was done for sfGFP, mCherry, mKate2 and tagRFP as described before [27].
pDOW01 was used as basic vector to construct the following FRET pairs and their donor and acceptor only counterparts: Cerulean-Venus, GFP-mCherry, GFP-mKate2, GFP-tagRFP,
and Venus-mCherry. Cerulean and Venus are improved versions of CFP and YFP [25,26]. The
pairs were selected for use as a FRET pair based on the spectral properties [29] (see also:http:// www.microscopyu.com/).
All genes encoding for fluorescent proteins were amplified by PCR with the BglBrick prefix (EcoRI,BglII) in the forward primer and the BglBrick suffix (BamHI,XhoI) in the reverse
prim-er for insprim-ertion into pDOW01 (seeTable 3). Sequencing was used to verify the construct
sequences.
Two fluorophores were linked to each other with a linker peptide containing a TEV-prote-ase recognition site. The TEV-proteTEV-prote-ase recognition site is ENLYFQ-G [30,31], with the
cleav-age site between the glutamine and glycine amino acids. TheB.subtilis DOW01strain used
here contains an inducible TEV-protease (Table 1). The TEV-protease gene under control of
the xylose inducible Pxyl promoter was amplified from BSG104 (primers constructTEV_FW &
constructTEV_REV), inserted in pDG1664 and integrated in thethrClocus of theB.subtilis
genome [32].
After cloning of the fluorophores into pDOW01, the resulting constructs were transformed and integrated in theamyElocus ofB.subtilis. To facilitate transformation,B.subtiliswas
made naturally competent as described before [33]. Single copy, double recombination of the
constructs was verified by the lack of (alpha)-amylase activity on LB starch plates.
Western Blotting
An overnight culture ofB.subtiliswas diluted in fresh medium to an approximate OD600of
0.03 and grown for 2h at 37°C, while shaking at 225 rpm. After induction with 0.1 mM IPTG, the cultures were split into two equal volumes, and 1% (w/v) xylose was added to one part to induce the TEV-protease. Cells were grown for 2 more hours at 37°C and 2 ml of cell culture
was centrifuged (1 min, 10.000 rpm) and resuspended in 200μl 50 mM Tris-Cl pH 7.4. Cell
lysis was achieved by adding a small spatula tip of glass beads (<106 microns, Sigma) to the mix, followed by two times one minute mini-bead beating (Mini-Beadbeater-16, Biospec prod-ucts). After centrifugation (2 min, 10.000 rpm) the supernatant was carefully transferred to
clean tubes and stored at -20°C. 30μl supernatant supplemented with SDS-loading buffer was
boiled at 80°C for 10 minutes and loaded on a 12% SDS-PAGE gel. After completion of electro-phoresis the gel was transferred to a PVDF Western Blotting membrane (Roche. One hour at
80 mA), followed by blocking with 5% (w/v) skim milk (Oxoid) in PBST (58 mM Na2HPO4,
17 mM NaH2PO4, 68 mM NaCl, 0.1% (v/v) Tween20, pH 7.3) overnight at 4°C. The
PVDF-membrane was washed three times 15 minutes in PBST and incubated with PBST with 5% skim milk and a 1:10.000 dilution of anti-GFP (rabbit serum, Invitrogen Molecular Probes) for two hours at room temperature. The membrane was washed three times 15 minutes in PBST and incubated with PBST supplemented with 1:5.000 goat-anti-rabbit Ig-Horseradish Peroxi-dase (Amersham Biosciences) for 1.5 hour at room temperature. Subsequently, the membrane was washed three times, gently dried with tissue papers and incubated for two minutes with 2 ml of ECL detection reagent (GE Healthcare). Signal visualization was done with a Molecular Imager ChemiDoc XRS+ (BioRad).
Fluorescence microscopy
Microscope specification. Microscope imaging for sensitized emission experiments was done using a Personal DeltaVision microscope system (Applied Precision, Issaquah, USA), with Softworx 3.6.0 software. The microscope was equipped with an Olympus IX71 inverted microscope body, a 100x phase contrast objective (Olympus PlanApo 1.40 NA), a CoolSNAP HQ2 camera (Princeton Instruments), a 300W Xenon light source, and filters for imaging of CFP (ex. 430/24 nm; em. 472/30nm), GFP (ex. 470/40 nm; em. 525/50 nm), and mCherry (ex. 572/35 nm; em. 632/60 nm) from Chroma. For Cerulean and Venus the CFP/YFP/mCherry
polychroic mirror was used (Chroma, 460–500, 525–575, 590–680 nm range) and for GFP,
mCherry, mKate2, and tagRFP the GFP/mCherry polychroic mirror was used (Chroma, 400–
470, 490–570, 580–630 and 640–730 nm range). Images were captured using 0.2s light expo-sure with 32% light transmission for every combination of filters. The FRET channel was set in the software by using the CFP or GFP excitation filter and the GFP or mCherry emission filter.
Strain preparation and protein overexpression
LB medium was inoculated from -80°CB.subtilisstocks and grown overnight at 37°C. The
next morning the cultures were diluted 1 to 50 to an approximate OD600of 0.03 in fresh LB
of incubation, cells were transferred to a microscope slide containing 1% (w/v) agarose to im-mobilize the cells and fluorescence intensity was measured with the wifield microscope de-scribed above for FRET detection via sensitized emission. The same sample preparation method was applied for the FLIM experiments described below.
Sensitized emission
–
Strain preparation for time-lapse
Time-lapse microscopy was done as described previously [34]. Briefly, LB medium was inoculated
from -80°C stocks and grown for 8 hours at 37°C and 225 rpm. Subsequently, the culture was di-luted 100 times in chemically defined medium (CDM; supplemented Spizizen’s salt [35], per liter: 2 g (NH4)2SO4, 14 g K2HPO4, 6 g KH2PO4, 1 g Na3citrate.2H2O, 0.27 g MgSO4.7H2O, 20 mg
casa-mino acids (Formedium), 20 mg L-tryptophan and 5 g D-fructose) and grown overnight at 37°C,
225 rpm. The next morning the culture was diluted to an OD600of 0.08 in fresh CDM, grown for
5–7 hours at 37°C and 225 rpm to an OD600of approximately 0.7. Now (0.35/OD)250 = 125μl
of cells were diluted in 500μl fresh medium and 2μl was transferred to a slide with 1.5% low-melt-ing point agarose (Sigma) in CDM and 0.1 mM IPTG. When the TEV-protease gene should be ex-pressed 1% (w/v) xylose was added to the slide medium as well. To make sure that the
fluorophores were present right from the start of the time-lapse experiment, IPTG (final concen-tration 0.1 mM) was added to the liquid culture one hour before transfer to the agarose slide. And in case the TEV-protease should be expressed also 1% (w/v) xylose was added to the liquid medi-um. The agarose slide was divided in three columns, separated by air cavities; one forB.subtilis
DOW5(GFP only), one forB.subtilis DOW13(tagRFP only), and one forB.subtilis DOW23
(GFP-tagRFP).
Time-lapse was done for 16 hours with a 15 minute interval. Of every strain the same four pictures were taken: phase contrast (GFP transmission light), FRET (GFP excitation, mCherry emission), donor (GFP excitation and emission), and acceptor (mCherry excitation and emis-sion). In all cases the light exposure time was 0.2s and the light transmission was 32%. The mi-croscope setup was the same as above except for the light source, which was now solid state TruLight Illumination (Applied Precision, Issaquah, USA). The microscope had a software-controlled stage to visit selected points routinely during a time-lapse experiment and the Delta-Vision UltimateFocus was used to keep cells in focus.
Sensitized emission
–
Data analysis
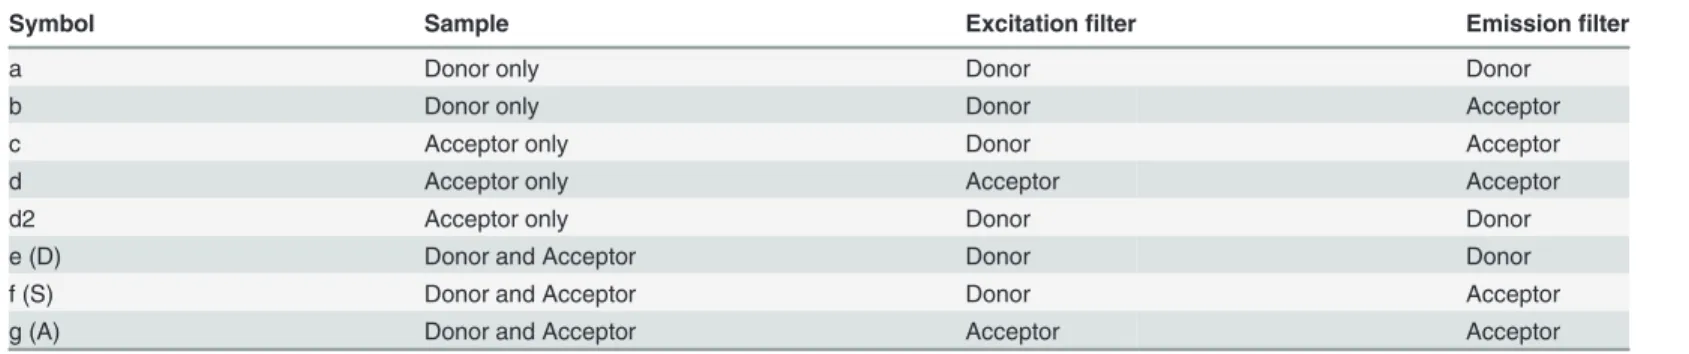
Three biologically independent samples were used to obtain a total of eight images, necessary to do the FRET detection via sensitized emission and its corrections [6]:B.subtiliscells with
only the donor, only the acceptor and with the donor and acceptor (Table 4). These samples
with only one of the fluorophores are necessary to calculate the correction factor for the donor in the acceptor channel and vice versa, and to correct for bleedthrough (i.e. non-specific excita-tion and emission events in the partner fluorophore filter channels).
Here, FRET was performed with fluorescent proteins that were linked to each other by a TEV-protease cleavage site. Induction of the TEV-protease will cleave the fluorophores apart and is expected to result in a lower FRET efficiency.
symbols inTable 4.
α¼d2.
d Eq 1
γ¼c d Eq 2
δ¼ds.
c Eq 3
β¼b.
a Eq 4
αcorrects for the acceptorfluorescence in the donor channel,γis the correction for the ac-ceptor excitation efficiency by donor excitation light,δcorrects for the sensitized emission
back into the donor channel andβis the correction for the donorfluorescence in the acceptor
channel [6]. These factors were used to correct for bleedthrough of thefluorophores.
The FRET was calculated withEq 5[6] from the sensitized emission of the acceptor
fluoro-phore in image S (Table 4). Subtraction ofβD from S removes the donor contribution to the ac-ceptor channel, subtraction of (γ-αβ)A is necessary to correct for direct acceptor excitation, and the image is scaled by dividing by 1-βδ.
FRETsensitized emission¼S βD ðγ αβÞA
1 βδ Eq 5
To calculate the FRET efficiency, the sensitized emission fromEq 5is divided by the accep-torfluorescence intensity, A (Eq 6[6]). The obtained FRET efficiency, Ea, is independent of
fluorescence intensities, which can vary over time due to protein expression levels.
FRETefficiency; Ea¼FRETsensitized emission=A Eq 6
Frequency Domain Fluorescence Lifetime Imaging Microscopy
The frequency domain MEM-FLIM system used (Lambert Instruments B.V.)[20], consists of a
multi-LED light source containing 3W LEDs with peak intensities at 446 nm (for Cerulean) and 469 nm (for GFP), a signal generator and a prototype directly modulatable CCD camera.
Table 4. The eight images required for sensitized emission FRET.
Symbol Sample Excitationfilter Emissionfilter
a Donor only Donor Donor
b Donor only Donor Acceptor
c Acceptor only Donor Acceptor
d Acceptor only Acceptor Acceptor
d2 Acceptor only Donor Donor
e (D) Donor and Acceptor Donor Donor
f (S) Donor and Acceptor Donor Acceptor
g (A) Donor and Acceptor Acceptor Acceptor
Table was redrawn based on a table from the W.M. Keck Center for Cellular Imaging [46]. The wavelengths for thefilters are specified in thefluorescence microscopy section.
The MEM-FLIM system was mounted on a Nikon Eclipse Ti inverted microscope with a 100x oil phase contrast objective (1.40 NA). The filter combinations used for imaging Cerulean were ex. 436/20 nm; em. 480/40nm and for GFP em. 480/30 nm; ex. 535/40 (Nikon). Erythro-sine B (Sigma-Aldrich 87613), a fluorescein derivative, with a lifetime of 0.086 ns was used as a
reference. Erythrosine B was dissolved in H2O and used with a concentration that matched the
brightness of the samples. The MEM-FLIM system was operated using LI-FLIM software ver-sion 1.2.24 (Lambert Instruments B.V.).
Phase contrast images were taken using transmission light and 0.1s exposure time. FLIM data was collected using 0.7s exposure time and modulated LED light for excitation. Fluores-cence lifetime data was collected using a modulation frequency of 40 MHz. For obtaining single cell fluorescence lifetime data the additional 1.5x magnification on the Nikon Microscope was used and the exposure time for collecting fluorescence images was extended to 1.5s. The LI-FLIM software was used for calculating the fluorescence lifetimes from phase shift data, see Zhaoet al. [20] for details.
Acceptor photobleaching
Acceptor photobleaching was performed as described previously [36]. Briefly, for all strains the following pictures were made: three pictures before bleaching with the following filter settings: phase contrast, donor excitation and emission, and acceptor excitation and emission, now the acceptor was bleached for one minute at 100% light transmission using the mCherry filters, and then three pictures after bleaching were made with the following filter settings: phase con-trast, donor excitation and emission, and acceptor excitation and emission. ImageJ was used to determine the fluorescence intensities of the donor before and after bleaching the acceptor.
Pic-tures were taken from the donor-only strain (DOW05), and from the strain with donor and
ac-ceptor (DOW23) with and without induction of thetevprotease encoding gene.
The FRET efficiency can be calculated withEq 7[36].
FRETefficiency; E¼ ðIDA IDAÞ=IDA Eq 7
IDAis the donorfluorescence intensity in presence of the acceptor and IDAis the donor
fluorescence intensity after photobleaching the acceptor.
Results
Single cell observations of FRET detected via sensitized emission
The aim of this work was to identify the best FRET-pair and to perform FRET at the single cell level inB.subtilisusing fluorescence microscopy. Therefore, the suitability of various
fluores-cent proteins (FPs) for FRET purposes inB.subtiliswas tested by expressing them pairwise
and covalently linked. The FPs tested here were Cerulean (a cyan FP [25]), Venus (a yellow FP
[26]), and sfGFP(Sp) [27] as donor and tagRFP (a red-orange FP, Evrogen), mCherry (a red FP
[28]), and mKate2 (a far-red FP, Evrogen) as acceptor. The respective genes were cloned in the
amyElocus ofB.subtilisunder control of the IPTG-inducible Phyper-spankpromoter, by using
the newly constructedamyEintegration vector pDOW (Fig 1), which allows for efficient
BglBrick [23] assembly (Fig 2A).
protease should induce uncoupling of the FRET pair, which results in loss of sensitized emis-sion of the acceptor. Western blotting with GFP specific antibodies was performed to visualize
the presence and size of the GFP containing proteins. As shown inFig 2C, lane 3, the
GFP-tagRFP synthetic dimer was readily produced. Upon induction of thetevgene, the heterodimer
was efficiently cleaved into the monomers GFP and tagRFP (lane 4). Expression of thetevgene
was a bit leaky, resulting in the presence of monomeric GFP without induction oftev
expres-sion (lane three). The band around 37 kDa in lane three is assumed to be a degradation product
Fig 2. (A) TheamyEintegration vector pDOW23 with FRET-pair GFP-tagRFP.(B) Schematic representation of two fluorescent proteins and the linker containing the TEV-protease recognition site (ENLYFQG). (C) A Western Blot to show the cleaving of coupled fluorophores by the TEV-protease. GFP protein was visualized by chemiluminescence with GFP-antibodies. The lanes contain cell free extract from the following strains: lane 1,DOW05 (thrC::Pxyl-tev amyE::gfp), lane 2,DOW13(thrC::Pxyl-tev amyE::tagRFP), lane 3,DOW23(thrC::Pxyl-tev amyE::gfp-tagRFP) from a culture without induction of thetev protease gene and lane 4,DOW23(thrC::Pxyl-tev amyE::gfp-tagRFP) in which thetevprotease gene was induced with 1% (w/v) xylose. Predicted sizes for GFP and tagRFP monomer are 27 kDa, and the complex 55 kDa.
doi:10.1371/journal.pone.0123239.g002
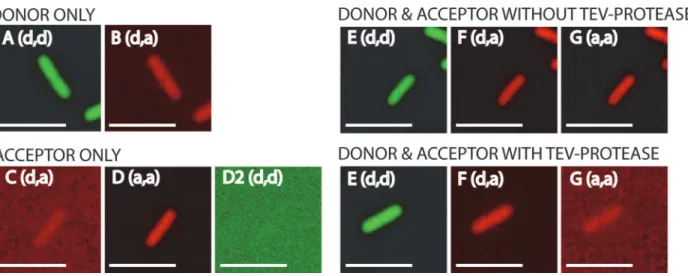
Fig 3. Fluorescence intensities of single cells for the FRET-pair GFP-tagRFP.Microscope excitation and emission filter settings are shown between brackets (d = donor, a = acceptor). For donor the filters (excitation, emission) were: GFP, GFP; for acceptor: mCherry, mCherry; and for FRET the filters were: GFP, mCherry. In all cases a GFP/mCherry polychroic mirror was used (400–470, 490–570, 580–630 and 640–730 nm range). A and B are cells where
only donor fluorophore is present (GFP). C, D and D2 are cells where only acceptor fluorophore is present (tagRFP). E, F and G (upper panel) are cells where donor-acceptor fluorophore tagRFP) are coupled and TEV-protease is not induced. E, F and G (lower panel) are cells where donor-acceptor (GFP-tagRFP) are uncoupled by induction of TEV-protease. The same signal scaling is used for all images. Note that the signals are false colored (GFP: green, tagRFP: red). Scale bar is 5μm.
of the dimer. Overall, these results show that induction of thetev-protease gene results in an ef-ficient separation of the FP pair (Fig 2C, lane 4).
The process of data acquisition and analysis to calculate the FRET efficiency is shown with single cell images of the FRET pair GFP-tagRFP (Fig 3andTable 4). First, cells with only
donor and only acceptor were imaged under the microscope in three channels (Fig 3A–3D2).
Next, cells with donor and acceptor (the FRET pair) were imaged in the same three channels
both with and without induction of TEV-protease (Fig 3E–3G). Note the significant decrease
in acceptor fluorescence (Fig 3F) in the presence of TEV-protease. The contributions of donor
emission in the acceptor channel (Fig 3B) and the excitation of the acceptor by donor excita-tion (Fig 3C) were very small, but nevertheless these contributions need to be taken into ac-count, because this light in the FRET channel is not due to sensitized emission of the acceptor. After measuring the fluorescence intensities from all cells (Fig 3) the FRET efficiency measured via sensitized emission was calculated withEq 6.
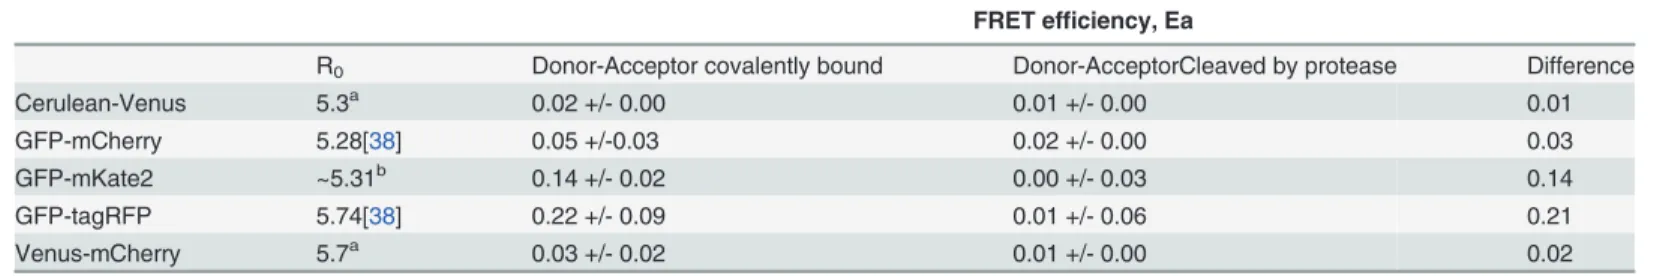
FRET efficiencies of the different fluorophore pairs detected with sensitized emission are shown inTable 5. The following criteria were used to select the most suitable FRET pair from the various combinations of FPs: first, the signal to noise levels of the separate fluorescent pro-teins should be high (Table 6), so localization and dynamics of individual proteins fused to a given fluorescent protein can be studied. Second, the difference in FRET efficiency between the covalently bound and cleaved fluorophores should be high. The highest signal to noise levels for the individual fluorophores were observed in the case of GFP, mKate2 and tagRFP (Table 6). Therefore, GFP was selected as FRET donor in subsequent protein-protein interac-tion experiments. The best acceptors were tagRFP and mKate2. The quantum yields were 0.48 versus 0.40 [29,37] and the relative brightness was 142 versus 74 for tagRFP and mKate2, respectively (as percentage of EGFP) [29]. Both fluorophores are monomeric [29], but the higher quantum yield of tagRFP will make protein interaction studies with the tagRFP easier for FRET analysis via sensitized emission since more of the donor resonance energy transfer to the acceptor will result in emission from the acceptor [38].
Based on the criteria of high signal to noise fluorescence and a large difference in FRET effi-ciency between the bound and cleaved fluorophores, GFP-tagRFP was chosen as the best FRET pair inB.subtilis(Table 5). Both the fluorescence intensities and the FRET efficiency of the Ce-rulean-Venus, the GFP-mCherry, and the Venus-mCherry combinations were much lower
Table 5. The FRET efficiency Ea of the different FRET pairs, measured via Sensitized Emission.
FRET efficiency, Ea
R0 Donor-Acceptor covalently bound Donor-AcceptorCleaved by protease Difference
Cerulean-Venus 5.3a 0.02 +/- 0.00 0.01 +/- 0.00 0.01
GFP-mCherry 5.28[38] 0.05 +/-0.03 0.02 +/- 0.00 0.03
GFP-mKate2 ~5.31b 0.14 +/- 0.02 0.00 +/- 0.03 0.14
GFP-tagRFP 5.74[38] 0.22 +/- 0.09 0.01 +/- 0.06 0.21
Venus-mCherry 5.7a 0.03 +/- 0.02 0.01 +/- 0.00 0.02
ahttp://www.microscopyu.com/tutorials/java/
fluorescence/fpfret/index.html
bCalculated based on the GFP, mKate2, and tagRFP spectra fromwww.evrogen.com. For formulas see reference [39,44]. The spectral overlap of
GFP-tagRFP and GFP-mKate2 are very similar (Evrogen spectra), but the extinction coefficientεAof mKate2 is smaller than theεAof tagRFP (62,500 vs.
100,000 M-1cm-1). Multiplying the spectral overlap J(λ) of GFP-tagRFP with 0.625 resulted in a calculated R
0of 5.31 for GFP-mKate2.
than of the GFP-mKate2 or GFP-tagRFP combinations; therefore these pairs were excluded from further analysis.
FRET detection via sensitized emission can be confirmed by acceptor
photobleaching
To support the above-presented FRET detection method via sensitized emission, an acceptor photobleaching experiment on the GFP-tagRFP fluorophore pair was performed. FRET
effi-ciency can be determined via acceptor photobleaching [36]. When FRET occurs, the acceptor
molecule quenches the donor fluorescence (resulting in decreased donor fluorescence), but when the acceptor is destroyed by photobleaching it cannot quench the donor anymore, so in-creased donor fluorescence can be detected.
To specifically photobleach tagRFP, we placed live cells under the microscope and excited with 572/35 nm with 100% of the output of solid state TruLight Illumination for one minute. This resulted in a decrease of 35% of the tagRFP fluorescence.
Indeed, using the GFP-tagRFP pair, the donor (GFP) emission was lower when FRET occurs than when GFP and tagRFP are uncoupled by TEV-cleavage. The pre-bleach fluorescence inten-sities of GFP were: 362 AU without TEV protease vs. 437 AU when TEV was produced.
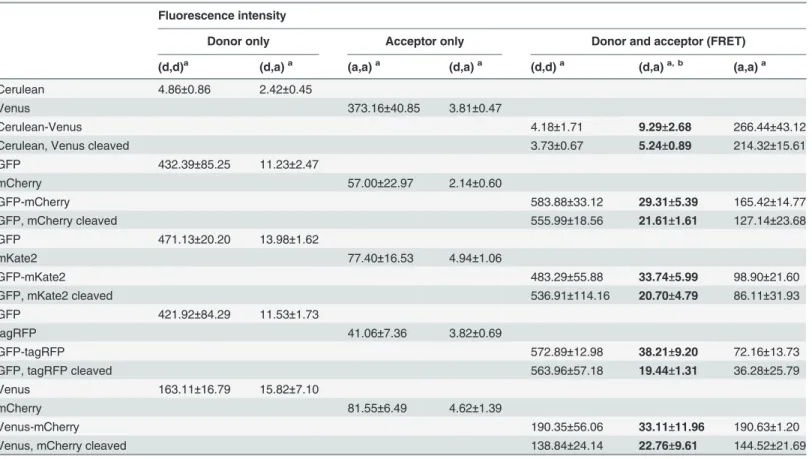
Table 6. Fluorescence intensities ofB.subtiliscells with the various fluorescent proteins.
Fluorescence intensity
Donor only Acceptor only Donor and acceptor (FRET)
(d,d)a (d,a)a (a,a)a (d,a)a (d,d)a (d,a)a, b (a,a)a
Cerulean 4.86±0.86 2.42±0.45
Venus 373.16±40.85 3.81±0.47
Cerulean-Venus 4.18±1.71 9.29±2.68 266.44±43.12
Cerulean, Venus cleaved 3.73±0.67 5.24±0.89 214.32±15.61
GFP 432.39±85.25 11.23±2.47
mCherry 57.00±22.97 2.14±0.60
GFP-mCherry 583.88±33.12 29.31±5.39 165.42±14.77
GFP, mCherry cleaved 555.99±18.56 21.61±1.61 127.14±23.68
GFP 471.13±20.20 13.98±1.62
mKate2 77.40±16.53 4.94±1.06
GFP-mKate2 483.29±55.88 33.74±5.99 98.90±21.60
GFP, mKate2 cleaved 536.91±114.16 20.70±4.79 86.11±31.93
GFP 421.92±84.29 11.53±1.73
tagRFP 41.06±7.36 3.82±0.69
GFP-tagRFP 572.89±12.98 38.21±9.20 72.16±13.73
GFP, tagRFP cleaved 563.96±57.18 19.44±1.31 36.28±25.79
Venus 163.11±16.79 15.82±7.10
mCherry 81.55±6.49 4.62±1.39
Venus-mCherry 190.35±56.06 33.11±11.96 190.63±1.20
Venus, mCherry cleaved 138.84±24.14 22.76±9.61 144.52±21.69
The column with the FRET channel, the most important part of the data, is highlighted. Fluorescence intensities were measured with three different microscopefilter settings for excitation and emissionfilters: donor,donor; donor,acceptor; and acceptor,acceptor (as indicated by the letters between bracketsa. d = donor, a = acceptor).bSensitized emission is determined from this sample and thesefilter settings. The values here are a triplicate of the
Moreover, after acceptor photo bleaching, an increase in donor fluorescence was observed when the GFP-tagRFP was coupled: the fluorescence intensities of GFP were 410 AU (13% increase) when GFP-tagRFP was coupled vs. 429 AU (1.8% decrease) when GFP-tagRFP was uncoupled. Acceptor photobleaching increases the GFP fluorescence with 13% when the fluorophores were linked to each other. When the fluorophores were uncoupled by the TEV-protease, the donor fluorescence was approximately the same before and after photobleaching (437 vs. 429), which is a good control for this method.
The FRET efficiency E (seeEq 7) isðIDA IDAÞ=IDA= (410–362)/410 = 0.12 for
GFP-tagRFP in this acceptor photobleaching experiment.
In total, we showed that the GFP-tagRFP pair can be efficiently used as a FRET pair for pro-tein interactions in liveB.subtiliscells.
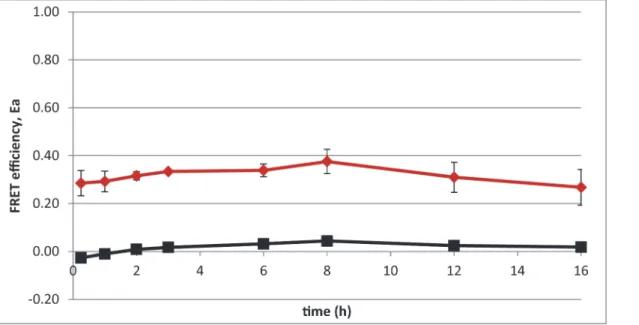
FRET efficiency dynamics in time-lapse experiments
This study focusses on finding appropriate FRET-pairs for studying temporal behavior of pro-tein-protein interactions. The GFP-tagRFP FRET pair was used in a time-lapse experiment to determine if the FRET efficiency is stable over time. Both covalently bound and TEV-protease
treated GFP-tagRFP produce a constant FRET efficiency (Fig 4). FRET-efficiency altering
pro-cesses like unequal protein degradation was hereby excluded. Any FRET-efficiency dynamics found in future protein interaction experiments can be attributed to the given protein-protein interactions.
FRET-FLIM
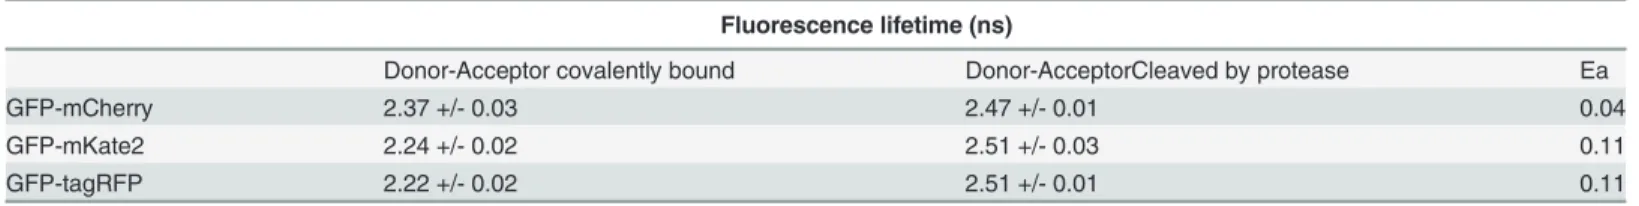
The fluorescence lifetime of GFP on its own was 2.56 ns (Table 7). When GFP was coupled to
an acceptor, the fluorescence lifetime was reduced, i.e. 2.22 ns for GFP-tagRFP, and when the GFP and the acceptor were uncoupled by expression of TEV-protease the GFP fluorescence lifetime increased again (Table 7). However, the fluorescence lifetime of GFP in the uncoupled
Fig 4. The FRET efficiency, Ea, was determined over time with a fluorescence microscopy time-lapse experiment.The covalently bound GFP-tagRFP, e.g. no TEV-protease, results in a high FRET efficiency (red line) and when the GFP-tagRFP is uncoupled by inducing the TEV-protease encoding gene, it results in a low FRET efficiency (black line). Error bars show the standard deviation of three replicate experiments. At least 50 single cells were analyzed at each time point.
FRET pair did not increase back to the situation of GFP only, which might indicate that the cleavage of the fluorophores was not 100%.
The FRET efficiency can be calculated from the fluorescence lifetimes withEq 8[39].
FRET EfficiencyE¼1 tDA
t
D
Eq 8
whereτDAis thefluorescence lifetime of the donor in presence of an acceptor andτDis the
fluorescence lifetime in the absence of an acceptor. The highest FRET efficiencies were 11%
and were obtained for GFP-mKate2 and GFP-tagRFP, the FRET efficiency for GFP-mCherry
was only 4%. The Ceruleanfluorescence lifetime could not be determined, because of technical
limitations (non-appropriatefilters on the MEM-FLIM mounted microscope).
Cells containing GFP-tagRFP were used to study the usability of the prototype MEM-FLIM system for FRET-FLIM measurements at the single bacterial cell level (Fig 5). In the top part of
Fig 5cells with coupled fluorophores, cells with uncoupled fluorophores or a mix of cells with coupled and uncoupled fluorophores were false-colored with a look-up-table from the LI-FLIM software. Using a Matlab script for automated cell sorting, these cells were categorized into two groups based on fluorescence lifetime values; cells with short lifetime were false-colored cyan and with long lifetime were false-colored magenta; threshold value was set to 2.3 ns (Fig 5A2–
5C2). This script was also used to make a fluorescence lifetime based histogram (Fig 5D). The
histogram confirms that the cells fromFig 5C2contained cells with short and long fluorescence
lifetime. This showed that the MEM-FLIM prototype allows single bacterial cell FLIM and can resolve inter-individual fluorescence lifetimes.
Discussion
Intermolecular FRET analysis allowsin vivoexamination of protein-protein interactions. It has
been successfully applied for studying the sensor kinases CitA and DcuS inE.coli[40] and the Fts division proteins inE.coli[15]. The proteins from the competence machinery inB.subtilis
have been studied via acceptor photobleaching [16] and the chemotaxis pathway inE.colihas
been studied extensively with acceptor photobleaching as well [41], but acceptor
photobleach-ing does not allow examination of the dynamics.
Here we studied which FRET-pair would be a suitable candidate forin vivoFRET analysis
inB.subtilis. FRET detected via sensitized emission showed that, out of the pairs tested, the GFP-tagRFP pair is the best candidate for FRET purposes inB.subtilis, based on the relative
brightness and the quantum yield of tagRFP (see alsoresultssection). Earlier work showed the
suitability of GFP-tagRFP and GFP-mCherry FRET-pairs in HeLa cells [38,42]. However, the
observed FRET efficiency inB.subtilisis low for GFP-mCherry using both sensitized emission
and FLIM (Tables5and7), despite the fact that the spectral overlap between GFP and
Table 7. The FRET efficiency Ea of the different FRET pairs, measured with FLIM.
Fluorescence lifetime (ns)
Donor-Acceptor covalently bound Donor-AcceptorCleaved by protease Ea
GFP-mCherry 2.37 +/- 0.03 2.47 +/- 0.01 0.04
GFP-mKate2 2.24 +/- 0.02 2.51 +/- 0.03 0.11
GFP-tagRFP 2.22 +/- 0.02 2.51 +/- 0.01 0.11
Thefluorescence lifetime of GFP_only is 2.56 ns. Thefluorescence lifetimes shown here are calculated with the LI-FLIM software from the average of all pixels infive regions of interestfilled with a monolayer of cells.
mCherry is high as well as the fluorescence intensities. In case of sensitized emission the low FRET efficiency for the GFP-mCherry combination could also be the result of the calculation method used in our study (Eq 6). Division by A–the acceptor fluorescence intensity–results in lower FRET efficiency for GFP-mCherry, because A is much higher for GFP-mCherry than
for GFP-tagRFP or GFP-mKate2 (Table 6). However, FLIM measurement data is independent
of intensities and the FRET-FLIM data confirms the data from the sensitized emission
experi-ments (Tables5and7). In both cases GFP-mKate2 and GFP-tagRFP are the best two
FRET pairs.
GFP-mCherry is often used as a FRET pair in interaction studies with high FRET efficien-cies. In this study it might be that the properties of the linker prevent proper orientations of both fluorophores resulting in poor FRET efficiencies for this FRET-couple. FRET efficiency is dependent on three criteria for obtaining FRET. Of those criteria only the spectral overlap is in-dependent of the construct used. The fluorophore distance and relative orientation of the donor and acceptor molecules depend on the linker sequence. Therefore, the FRET efficiencies reported here reflect the situation with the TEV-protease cleavable linker. FRET-efficiencies in earlier work range from 4 to 46% [15,16,40,43].
Individually, the fluorescent proteins are efficiently produced (Table 6) and, when linked to-gether, the GFP-tagRFP pair has the highest FRET efficiency. The benefit of red-shifted FRET-pairs is in accordance with earlier work [38,44], and one possible explanation is the larger För-ster radius [44].
Fig 5. Single cells FLIM measurements.(A1)B.subtiliscells are shown where the GFP-tagRFP fluorophores are linked. (B1)B.subtiliscells are presented where the GFP and tagRFP fluorophores are cleaved apart. (C1)B.subtiliscells where GFP-tagRFP fluorophores are linked are mixed in a 1:1 ratio withB. subtiliscells where the GFP-tagRFP fluorophores are cleaved apart; resulting in a mix of cells with either short GFP fluorescence lifetime due to quenching by tagRFP or long GFP fluorescence lifetime. Visualization of cells in A1, B1, C1 was done with a Look-Up-Table from LI-FLIM. A2, B2 and C2 present the same cells, but now a Matlab script was used to categorize the cells into two categories: cells with short GFP lifetimes are shown in cyan and cells with long GFP lifetimes are shown in magenta. (D) fluorescence lifetime based histogram of the cells described in A2-C2, black, cyan, magenta and dotted lines present GFP_only, linked fluorophores, cleaved fluorophores and a mix of the two populations, respectively. Scale bar is 5μm.
The FRET-FLIM set-up used here allows measurements of FRET-efficiency on a single bacte-rial cell level (Fig 5). This shows the potential of this system for the study of heterogeneity in pro-tein-protein interactions. At this point, the prototype CCD-sensor has limited sensitivity, only allowing single bacterial cell FLIM with highly expressed FRET pairs and is therefore not yet widely applicable for studies in bacteria. However, when fusion proteins are put under control of strong promoters, relevant data might be obtainable, even for normally low-expressed proteins. Alternatively, improved systems could be incorporated in existing microscopy set-ups allowing fast FRET readouts during e.g. time lapse microscopy or microfluidic experiments for the study of protein-protein interaction dynamics.
Author Contributions
Conceived and designed the experiments: RGJDOW ATK JWV JS OPK. Performed the experi-ments: RGJDOW. Analyzed the data: RGJDOW. Contributed reagents/materials/analysis tools: JWV OPK. Wrote the paper: RGJDOW ATK SdJ JWV JS OPK.
References
1. Mika JT, van den Bogaart G, Veenhoff L, Krasnikov V, Poolman B. (2010) Molecular sieving properties of the cytoplasm of escherichia coli and consequences of osmotic stress. Mol Microbiol 77: 200–207.
doi:10.1111/j.1365-2958.2010.07201.xPMID:20487282
2. Wade JT, Struhl K, Busby SJ, Grainger DC. (2007) Genomic analysis of protein-DNA interactions in bacteria: Insights into transcription and chromosome organization. Mol Microbiol 65: 21–26. PMID:
17581117
3. Shapiro L, McAdams HH, Losick R. (2009) Why and how bacteria localize proteins. Science 326: 1225–1228. doi:10.1126/science.1175685PMID:19965466
4. Rudner DZ, Losick R. (2010) Protein subcellular localization in bacteria. Cold Spring Harb Perspect Biol 2: a000307. doi:10.1101/cshperspect.a000307PMID:20452938
5. Marchadier E, Carballido-Lopez R, Brinster S, Fabret C, Mervelet P, Bessières P, et al. (2011) An ex-panded protein-protein interaction network in bacillus subtilis reveals a group of hubs: Exploration by an integrative approach. Proteomics 11: 2981–2991. doi:10.1002/pmic.201000791PMID:21630458 6. van Rheenen J, Langeslag M, Jalink K. (2004) Correcting confocal acquisition to optimize imaging of
fluorescence resonance energy transfer by sensitized emission. Biophys J 86: 2517–2529. PMID:
15041688
7. Gordon GW, Berry G, Liang XH, Levine B, Herman B. (1998) Quantitative fluorescence resonance en-ergy transfer measurements using fluorescence microscopy. Biophys J 74: 2702–2713. PMID:
9591694
8. Nagy P, Vamosi G, Bodnar A, Lockett SJ, Szollosi J. (1998) Intensity-based energy transfer measure-ments in digital imaging microscopy. Eur Biophys J 27: 377–389. PMID:9691467
9. Förster T. (1948) Intermolecular energy migration and fluorescence. Annalen der Physik 2: 55–75. 10. Stryer L. (1978) Fluorescence energy transfer as a spectroscopic ruler. Annu Rev Biochem 47: 819–
846. PMID:354506
11. Lakowicz JR. (2006) Principles of fluorescence spectroscopy. New York: Springer.
12. Remington SJ. (2011) Green fluorescent protein: A perspective. Protein Sci 20: 1509–1519. doi:10.
1002/pro.684PMID:21714025
13. Crivat G, Taraska JW. (2012) Imaging proteins inside cells with fluorescent tags. Trends Biotechnol 30: 8–16. doi:10.1016/j.tibtech.2011.08.002PMID:21924508
14. Shaner NC, Steinbach PA, Tsien RY. (2005) A guide to choosing fluorescent proteins. Nat Methods 2: 905–909. PMID:16299475
15. Alexeeva S, Gadella TW Jr, Verheul J, Verhoeven GS, den Blaauwen T. (2010) Direct interactions of early and late assembling division proteins in escherichia coli cells resolved by FRET. Mol Microbiol 77: 384–398. doi:10.1111/j.1365-2958.2010.07211.xPMID:20497333
16. Kramer N, Hahn J, Dubnau D. (2007) Multiple interactions among the competence proteins of bacillus subtilis. Mol Microbiol 65: 454–464. PMID:17630974
18. Munster vEB, Gadella TWJ. (2005) Fluorescence lifetime imaging microscopy (FLIM), chapter 5. In: Scheper T, editor. Advances in Biochemical Engineering/Biotechnology. pp. 143–175.
19. Van Munster EB, Gadella TW Jr. (2004) phiFLIM: A new method to avoid aliasing in frequency-domain fluorescence lifetime imaging microscopy. J Microsc 213: 29–38. PMID:14678510
20. Zhao Q, Schelen B, Schouten R, van den Oever R, Leenen R, van Kuijk H, et al. (2012) Modulated elec-tron-multiplied fluorescence lifetime imaging microscope: All-solid-state camera for fluorescence life-time imaging. J Biomed Opt 17: 126020. PMID:23323290
21. Kunst F, Ogasawara N, Moszer I, Albertini AM, Alloni G, Azevedo V, et al. (1997) The complete genome sequence of the gram-positive bacterium bacillus subtilis. Nature 390: 249–256. PMID:9384377 22. Sambrook J, Fritsch EF, and Maniatis T. (1989) Molecular cloning: A laboratory manual. New York:
Cold Spring Harbor Laboratory Press.
23. Anderson JC, Dueber JE, Leguia M, Wu GC, Goler JA, Arkin AP, et al. (2010) BglBricks: A flexible stan-dard for biological part assembly. J Biol Eng 4: 1. doi:10.1186/1754-1611-4-1PMID:20205762
24. Knight T. (2003) Idempotent vector design for standard assembly of biobricks. Available:http://web.mit. edu/synbio/release/docs/biobricks.pdf. Accessed: nov 2010.
25. Rizzo MA, Springer GH, Granada B, Piston DW. (2004) An improved cyan fluorescent protein variant useful for FRET. Nat Biotechnol 22: 445–449. PMID:14990965
26. Nagai T, Ibata K, Park ES, Kubota M, Mikoshiba K, Miyawaki A. (2002) A variant of yellow fluorescent protein with fast and efficient maturation for cell-biological applications. Nat Biotechnol 20: 87–90.
PMID:11753368
27. Overkamp W, Beilharz K, Detert Oude Weme R, Solopova A, Karsens H, Kovács AT, et al. (2013) Benchmarking various GFP variants in bacillus subtilis, streptococcus pneumoniae and lactococcus lactis for live cell imaging. Appl Environ Microbiol 79: 6481–6490. doi:10.1128/AEM.02033-13PMID:
23956387
28. Shaner NC, Campbell RE, Steinbach PA, Giepmans BN, Palmer AE, Tsien RY. (2004) Improved mono-meric red, orange and yellow fluorescent proteins derived from discosoma sp. red fluorescent protein. Nat Biotechnol 22: 1567–1572. PMID:15558047
29. Day RN, Davidson MW. (2009) The fluorescent protein palette: Tools for cellular imaging. Chem Soc Rev 38: 2887–2921. doi:10.1039/b901966aPMID:19771335
30. Dougherty WG, Parks TD, Cary SM, Bazan JF, Fletterick RJ. (1989) Characterization of the catalytic residues of the tobacco etch virus 49-kDa proteinase. Virology 172: 302–310. PMID:2475971 31. Poyales DA, Goldstein A, Ward G, Hughes AJ Jr. (1994) TEV-protease, recombinant: A site-specific
protease for efficient cleavage of affinity tags from expressed proteins. Focus 16: 1–5.
32. Gruber S, Veening JW, Bach J, Blettinger M, Bramkamp M, Errington J. (2014) Interlinked sister chro-mosomes arise in the absence of condensin during fast replication in B. subtilis. Curr Biol.
33. Harwood CR, Cutting SM. (1990) Growth, maintenance and general techniques.inharwood C.R. und cutting S. M.,molecular biological methods for bacillus, chapter 1 and appendix 1. john wiley & sons, inc. chichester, UK.
34. de Jong IG, Beilharz K, Kuipers OP, Veening JW. (2011) Live cell imaging of bacillus subtilis and strep-tococcus pneumoniae using automated time-lapse microscopy. J Vis Exp 53: 3145. doi:10.3791/3145 PMID:21841760
35. Anagnostopoulos C, Spizizen J. (1961) Requirements for transformation in bacillus subtilis. J Bacteriol 81: 741–746. PMID:16561900
36. Kenworthy AK. (2001) Imaging protein-protein interactions using fluorescence resonance energy trans-fer microscopy. Methods 24: 289–296. PMID:11403577
37. Merzlyak EM, Goedhart J, Shcherbo D, Bulina ME, Shcheglov AS, Fradkov AF, et al. (2007) Bright mo-nomeric red fluorescent protein with an extended fluorescence lifetime. Nat Methods 4: 555–557.
PMID:17572680
38. Shcherbo D, Souslova EA, Goedhart J, Chepurnykh TV, Gaintzeva A, Shemiakina II, et al. (2009) Prac-tical and reliable FRET/FLIM pair of fluorescent proteins. BMC Biotechnol 9: 24-6750-9-24.
39. Lakowicz JR. (2006) Energy transfer. In: Anonymous Principles of fluorescence spectroscopy. New York: Springer. pp. 443.
40. Scheu PD, Witan J, Rauschmeier M, Graf S, Liao YF, Ebert-Jung A, et al. (2012) CitA/CitB two-compo-nent system regulating citrate fermentation in escherichia coli and its relation to the DcuS/DcuR system in vivo. J Bacteriol 194: 636–645. doi:10.1128/JB.06345-11PMID:22101843
42. Padilla-Parra S, Auduge N, Lalucque H, Mevel JC, Coppey-Moisan M, Tramier M. (2009) Quantitative comparison of different fluorescent protein couples for fast FRET-FLIM acquisition. Biophys J 97: 2368–2376. doi:10.1016/j.bpj.2009.07.044PMID:19843469
43. van der Krogt GN, Ogink J, Ponsioen B, Jalink K. (2008) A comparison of donor-acceptor pairs for ge-netically encoded FRET sensors: Application to the epac cAMP sensor as an example. PLoS One 3: e1916. doi:10.1371/journal.pone.0001916PMID:18382687
44. Goedhart J, Vermeer JE, Adjobo-Hermans MJ, van Weeren L, Gadella TW Jr. (2007) Sensitive detec-tion of p65 homodimers using red-shifted and fluorescent protein-based FRET couples. PLoS One 2: e1011. PMID:17925859
45. Guerout-Fleury AM, Frandsen N, Stragier P. (1996) Plasmids for ectopic integration in bacillus subtilis. Gene 180: 57–61. PMID:8973347