Energy Transfer Probe Measurements for Quantitative
Modeling
Marc R. Birtwistle1,2*, Alexander von Kriegsheim1, Katarzyna Kida1, Juliane P. Schwarz3, Kurt I. Anderson3, Walter Kolch1
1Systems Biology Ireland, University College Dublin, Belfield, Republic of Ireland,2Cancer Research Center, Georgia Health Sciences University, Augusta, Georgia, United States of America,3Beatson Institute for Cancer Research, Bearsden, Glasgow, United Kingdom
Abstract
Numerous unimolecular, genetically-encoded Fo¨rster Resonance Energy Transfer (FRET) probes for monitoring biochemical activities in live cells have been developed over the past decade. As these probes allow for collection of high frequency, spatially resolved data on signaling events in live cells and tissues, they are an attractive technology for obtaining data to develop quantitative, mathematical models of spatiotemporal signaling dynamics. However, to be useful for such purposes the observed FRET from such probes should be related to a biological quantity of interest through a defined mathematical relationship, which is straightforward when this relationship is linear, and can be difficult otherwise. First, we show that only in rare circumstances is the observed FRET linearly proportional to a biochemical activity. Therefore in most cases FRET measurements should only be compared either to explicitly modeled probes or to concentrations of products of the biochemical activity, but not to activities themselves. Importantly, we find that FRET measured by standard intensity-based, ratiometric methods is inherently non-linear with respect to the fraction of probes undergoing FRET. Alternatively, we find that quantifying FRET either via (1) fluorescence lifetime imaging (FLIM) or (2) ratiometric methods where the donor emission intensity is divided by the directly-excited acceptor emission intensity (denotedRalt) is linear with respect to the
fraction of probes undergoing FRET. This linearity property allows one to calculate the fraction of active probes based on the FRET measurement. Thus, our results suggest that either FLIM or ratiometric methods based onRaltare the preferred
techniques for obtaining quantitative data from FRET probe experiments for mathematical modeling purposes.
Citation:Birtwistle MR, von Kriegsheim A, Kida K, Schwarz JP, Anderson KI, et al. (2011) Linear Approaches to Intramolecular Fo¨rster Resonance Energy Transfer Probe Measurements for Quantitative Modeling. PLoS ONE 6(11): e27823. doi:10.1371/journal.pone.0027823
Editor:Leo T.O. Lee, University of Hong Kong, Hong Kong
ReceivedJune 12, 2011;AcceptedOctober 26, 2011;PublishedNovember 16, 2011
This is an open-access article, free of all copyright, and may be freely reproduced, distributed, transmitted, modified, built upon, or otherwise used by anyone for any lawful purpose. The work is made available under the Creative Commons CC0 public domain dedication.
Funding:This work was supported by Science Foundation Ireland under Grant No. 06/CE/B1129. MRB acknowledges a Marie Curie International Incoming Fellowship (236758) and an European Molecular Biology Organization long-term fellowship (ALTF 815-2010). The funders had no role in study design, data collection and analysis, decision to publish, or preparation of the manuscript.
Competing Interests:The authors have declared that no competing interests exist. * E-mail: [email protected]
Introduction
Over the past 10 years, the number of genetically encoded, Fo¨rster resonance energy transfer (FRET)-based sensors for monitoring various biochemical activities in live cells and real time has skyrocketed [1,2,3,4,5,6,7,8]. Most of these probes are unimolecular and have a general structure where a sensing unit, which is conformationally responsive to a biochemical activity of interest, is sandwiched between ‘‘blue-shifted’’ and ‘‘red-shifted’’ fluorescent proteins (FPs) capable of FRET. Thus, changes in biochemical activities of interest change the distance between the FPs, leading to detectable changes in FRET. For quantitative modeling of biochemical processes, these probes offer huge advantages over other currently available technologies (which include for example western blotting, immunofluorescence, and flow cytometery): (i) quantities of interest can be assayed in living cells and tissues [9] and in real time; (ii) high frequency sampling is possible; (iii) three-dimensional spatial data can be obtained; and (iv) single-cell as opposed to population average responses are measured. Although these characteristics make the use of FRET probes attractive for quantitative modeling, it is largely unknown
how such data might precisely be used for such purposes. Therefore, in this work we first explore to what model variables FRET data should be compared. Moreover, to be useful for quantitative modeling, general good modeling practice dictates that the measured FRET should be linearly proportional to a modeled biochemical quantity. This is of particular importance when calibration curves are difficult if not impossible to obtain, which is the case for most of these sensors with the exception of those for small molecules such as Ca2++
and cAMP. There are two main methods for measuring FRET: ratiometric and lifetime imaging. We, therefore, also investigate how linear and quantita-tive FRET data obtained by these two methods are.
Materials and Methods
Cloning
amplification from the nuclear version of EKAR (Addgene, Cambridge, MA), and Raichu-RhoA-1237X was kindly provided by T. Ng. To construct the Raichu-RhoA probe with mTFP1 and mVenus, multi-site, three-way gateway cloning was used according to the manufacturer’s protocol (Invitrogen), with mTFP1 in Position 1, the Raichu-RhoA sensing region in Position 2, and mVenus in Position 3. The Raichu-RhoA sensing region was defined as that being amplified by the forward primer 59-TGGTCCCTGCTAGAGCAGCTGGGCC-39 and the reverse primer 59- ACCAGATTTTTTCTTCCCACGTCTA-39. To amplify mVenus out of EKAR, we first digested EKAR with EcoRI/BamHI to remove Cerulean, which has significant sequence homology with mVenus. In the tandem mTFP1-Venus construct, the amino acid linker between mTFP1 and Venus was TGAGGGGLG.
Protein Expression and Purification
The BL-21 strain ofE. coliwas transformed with the appropriate plasmids. Single colonies were then expanded in a 50 mL culture overnight in LB containing the appropriate antibiotic. The 50 mL culture was then added to 2 L of fresh LB, and bacteria were allowed to grow to an optical density of approximately 0.6. Protein expression was induced with 1 mM IPTG for 4 hrs at 37uC. The bacteria were pelleted (5,000 g, 10 min) and lysed in ice-cold PBS containing 1% Triton X-100, 1 mM PMSF, and 2 mM EDTA with sonication (3630 sec bursts) on ice. The lysate was cleared by centrifugation (4uC, 13,000 rpm, 15 min, SS-34 rotor) and incubated with glutathione-sepharose beads (GE-Healthcare) overnight at 4uC with gentle rotation. Beads were pelleted and washed in Mobicol Mini-Columns (MoBiTec, Go¨ttingen, Ger-many) 36with lysis buffer and 26with PBS, all at 4uC. Proteins were eluted by incubating the beads with 6 mg/ml reduced glutathione in PBS, pH 8.0 in Mobicol Mini-Columns 26for 30 minutes. Protein concentrations were measured by absorbance at 280 nm on a NanoDrop spectrophotometer (Thermo-Scientific, Hertfordshire, UK), using 6 mg/ml reduced glutathione in PBS, pH 8.0 as the blank.
Preparation of Raichu-RhoA-GTP and GDP
Raichu-RhoA-GST-glutathione-sepharose beads were incubat-ed for 30 min at 37uC with either GTPcS or GDPbS binding buffer (20 mM Hepes, pH 8.0, 100 mM NaCl, 1 mM DTT, 1 mM EDTA, 10 mM MgCl2, 10mM GTPcS or 100mM GDPbS-all from Sigma) in a spin column (MoBiTec, Go¨ttingen, Germany). The beads were subsequently washed 36with binding buffer void of GTPcS or GDPbS and eluted by incubating the beads 2630 min with glutathione elution buffer (20 mM Hepes, pH 8.0, 100 mM NaCl, 1 mM DTT, 1 mM EDTA, 10 mM MgCl2, 6 mg/ml reduced glutathione) at 25uC, as described
above.
Ratiometric Imaging
Protein solutions were prepared in the indicated proportions, and then loaded into a black 96-well plate. A plate reader (SynergyMX, BioTek, Mason Technology, Dublin, Ireland) was then used to excite the samples with 436/20 nm light for the donor and FRET channel or 505/9 nm light for the acceptor channel and scan emission wavelengths from 480 (FRET and donor) or 525 (acceptor) nm to 565 nm at 5 nm intervals. The donor channel was defined as the sum of emission intensities from 480 nm to 500 nm, the acceptor channel was defined as the sum of emission intensities from 525 nm to 565 nm, and the nominal FRET channel was defined as the sum of emission intensities from 515 nm to 565 nm. To vary the degree of overlap, decreasing
5 nm wavelength emission intervals were added to the FRET channel, starting with 535 nm to 565 nm and going down to 480 nm to 565 nm.
Fluorescence Lifetime Imaging
Fluorescence lifetime measurements were performed using a Lambert Instruments fluorescence attachment (Amsterdam, The Netherlands) on a Nikon Eclipse TE 2000-U microscope equipped with a 406objective and a filter block consisting of a 436/20 excitation filter, a T455LP dichroic mirror, and a 480/40M emission filter. A modulated 445 nm LED was used as light source to measure FLIM-FRET by frequency domain methods. Fluores-cein (10mM in 0.1 M Tris-Cl, pH.10), which has a known lifetime of 4.0 ns, was used as reference standard. Fluorescence lifetime, t, was analyzed using the LI-FLIM software (version 1.2.1; Lambert Instruments, Amsterdam, The Netherlands). All measurements correspond to the lifetime estimated via the phase shift. Lifetime values were calculated for a rectangular region of interest of at least 100 by 100 pixels.
Results and Discussion
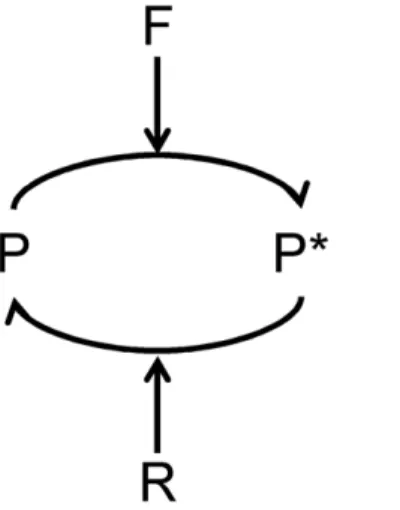
Relating FRET Data to a Biochemical Quantity of Interest Before trying to understand the linear range of FRET measurements, it is important to understand precisely how the FRET signal is related to specific biochemical entities within the cell, such that FRET data can be compared to appropriate quantities in a mathematical model. In general, the transition of the inactive FRET probe P to an active state P*, where FRET is more likely to occur, can be represented by the scheme in Fig. 1. The enzyme F catalyzes the forward reaction and the enzyme R catalyzes the reverse reaction, both with a standard Michaelis-Menten mechanism. The fraction of donor fluorophores that are capable of transferring energy by FRET (QF), is directly proportional to the concentration of active FRET probes, P*
(the quantityQFis related but not exactly equal to the traditional FRET efficiencyE; this will be important and discussed in below analyses). Here, we consider how P* is related to biochemical quantities.
First, consider the scenario where the enzyme F is saturated (Kf
mvvPTOT{P;Kmfis the Michaelis constant for the forward
Figure 1. Kinetic Scheme for FRET Probe Activation.A forward enzyme F catalyzes the conversion of the FRET probe into an active state, and a reverse enzyme R catalyzes the conversion of the probe into an inactive state.
enzyme andPTOTis the total probe concentration) and the enzyme R is in its linear range (Kr
mwwP;Kmr is the Michaelis constant
for the reverse enzyme). Then, the steady-state level ofP*is given by
dP
dt ~0~Fa{ Ra
Kr m
P[P~FaK r m
Ra
, ð1Þ
whereFais the activity of the forward enzyme andRais the activity of the reverse enzyme. Under these conditions, we see that the concentration of active probe molecules is linearly proportional to the forward enzyme activity. However, consider the steady-state levels ofP*when R is saturated and F is in its linear range,
dP dt ~0~
Fa
Kmf
PTOT{P
ð Þ{Ra[P~PTOT{Ra
Kf m
Fa , ð2Þ
or when both enzymes are in their linear range,
dP dt ~0~
Fa
Kmf
PTOT{P
ð Þ{Ra
Kr m
P[P~ K r mFaPTOT (KmfRazKmrFa)
: ð3Þ
Equations 2 and 3 yield non-linear relationships between the forward enzyme activityFaandP*. Considering a more complex scenario where both enzymes follow Michaelis-Menten kinetics (not saturated nor in the linear range of operation) we have
dP dt ~0~
FaðPTOT{PÞ
KmfzðPTOT{PÞ
{ RaP
Kr mzP
, ð4Þ
which again gives a non-linear relationship between Fa and P*. Considering non-steady-state or non-Michaelean conditions, which is particularly important given that intracellular reactions are rarely at steady-state or obey Michaelis-Menten kinetics, only further complicates the relationship between P* and forward enzyme activity. Therefore, we conclude that when FRET data are used for quantitative modeling, they should be compared to an explicitly modeled downstream substrate [11,12,13,14,15,16,17, 18], and not the activity state of the forward enzyme. For example, if the FRET probe is responsive to a kinase activity, then the amount of active FRET probes are proportional to the level of a phosphorylated substrate (which should be explicitly modeled), but not the kinase activity itself.
Ratiometric Imaging
The most common way of quantifying FRET is by a technique called ratiometric imaging. The standard protocol in such an experiment is as follows [19]. Cells are exposed to excitation light for the donor channel, and then fluorescence emission is divided into donor and acceptor channels. The output from ratiometric imaging,R, is the intensity in the acceptor channel,IAdon, divided by the intensity in the donor channel,IDdon,
R~I don A
Idon D
: ð5Þ
Below we derive an expression for R in terms of properties of intrinsic donor and acceptor properties, the excitation and emission channel characteristics, and of greatest importance, the fraction of donor molecules capable of transferring energy by
FRET (QF), which is directly indicative of the number of active probes.
The intensity in the donor channel is the sum of donor emission (IDD) and acceptor emission crosstalk (IDA),
IDdon~IDDzIDA: ð6Þ
In most circumstances, it is reasonably easy to exclude acceptor emission from the donor channel, and therefore we assume that
IDA is negligible compared to IDD. The donor emission can be represented in terms of the total number of excited donor molecules (ND*), the fraction of donor molecules actually transferring energy by FRET (the fraction of donor molecules capable of transferring energy by FRET multiplied by the FRET efficiency E of such molecules:EQF), and the fraction of the donor emission captured by the donor channel (fDD), which has units of photons per molecule.
IDD&IDdon~NDð1{EwFÞfDD: ð7Þ
Note thatfDDis proportional to the integral of the emission spectra between the emission filter wavelengths.
The intensity in the acceptor channel, similar to that of the donor channel, is the sum of acceptor emission (IAA) and donor emission crosstalk into the acceptor channel (IAD),
IAdon~IAAzIAD: ð8Þ
As above, the individual emission intensities can be represented in terms of the number of excited molecules, FRET fraction, and emission spectrum coverage, giving
IAdon~ NDEwFzNA
fAAzNDð1{EwFÞfAD: ð9Þ
Here, the acceptor may be excited either by FRET from the donor (with the number of molecules denoted byNDEwF) or by direct
excitation at the donor wavelength (with the number of molecules denoted byN
A), andfAAandfADare the fractions of the acceptor and donor emission captured by the acceptor channel, respectively (again units of photons per molecule).
Given these expressions for the acceptor and donor emission intensities, the ratio R becomes
R~ N
DEwFzNA
fAAzNDð1{EwFÞfAD
N
Dð1{EwFÞfDD :
ð10Þ
Providing that the amount of direct acceptor excitation is negligible, R simplifies to
R~ EwFfAA 1{EwF
ð ÞfDD
zfAD
fDD:
ð11Þ
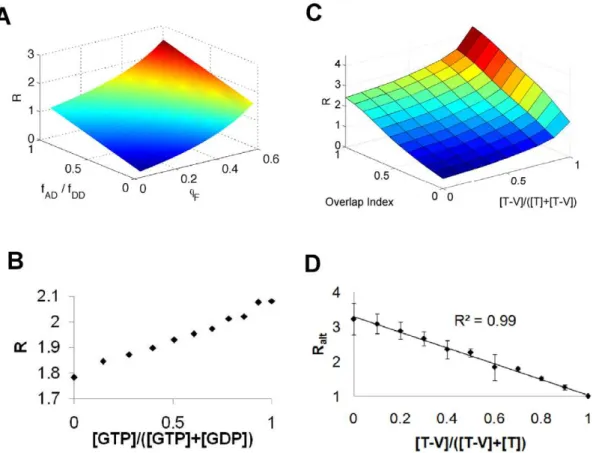
magnitude (1,fAA/fDD). Although condition (ii) may seem restrictive, in practice deviation from this condition can be easily adjusted at the level of digital intensities by changing detector gains for the acceptor and donor channels. A striking feature of Fig. 2A is the non-linearity ofRas a function ofQFfor all values of
fAD/fDD(which quantifies the relative amount of crosstalk from the donor into the acceptor channel). Even with no crosstalk from the donor into the acceptor channel, ratiometric FRET should give a non-linear signal-response relationship.
To test this prediction of a non-linear relationship betweenQF and the observed ratio R we analyzed a Raichu-RhoA FRET probe [7] that has mTFP1 [20] as the donor and mVenus as the acceptor [21]. This combination is superior to the previously used CFP/YFP pair as mTFP1 has a mono-exponential fluorescence decay, and is more photostable and brighter than ECFP (or its derivative mCerulean). The mTFP1/mVenus donor/acceptor combination has been shown previously to undergo significant FRET [22,23]. The FRET output of this probe increases when it is bound to GTP, and decreases when it is bound to GDP. We expressed the Raichu-RhoA FRET probe inE. coliand purified it. To create active and inactive populations of the probe, we incubated the recombinant Raichu-RhoA proteinin vitrowith either GTPcS or GDPbS, which stably bind to small G-proteins such as those found in the Raichu-RhoA
probe sensing unit, and therefore holds it either in the ‘‘on’’ (GTP) or ‘‘off’’ (GDP) state. We then mixed the GTP and GDP bound forms of the probe in various proportions and analyzed the ratiometric FRET with a fluorescence plate reader (Fig. 2B). To our surprise, the resulting relationship was linear across the entire spectrum of GTP bound fractions. However, the ratio R only ranges between approximately 1.8 and 2.1, which is quite small compared to the range calculated in Fig. 2A. Given this small ratio range, the inherently non-linear relationship predicted by Eq. 11 would appear effectively linear. Therefore, we tested a system where a greater range of ratios may be explored. We expressed and purified both mTFP1 alone (non-FRETing protein) and an mTFP1-mVenus tandem fusion (FRETing protein), mixed these two proteins together in various propor-tions, and then measured the resulting ratiometric FRET again with a fluorescence plate reader (Fig. 2C). With this system, we could explore a much wider range of ratio changes. The results confirm that the ratios depend non-linearly on the fraction of molecules undergoing FRET, in a manner consistent with the predictions of Fig. 2A. We verified that adding matched amounts of pure mVenus, rather than mTFP1-mVenus, did not change the observed ratios, showing that the observed ratio changes were a result of intra-molecular rather than inter-molecular FRET (data not shown).
Figure 2. Ratiometric FRET.(A) Simulations for how the ratio R depends on the FRET efficiency QF and the relative overlap of the donor fluorescence into the acceptor channel (fAD/fDD). The simulations were performed in MATLAB and are based on Eq. 11. Pseudo-color is indicative of
z-axis (R) value. (B) Observed ratiometric FRET (y-axis) from various mixtures of GDP and GTP bound mTFP1-RaichuRhoA-mVenus. The proportion of GTP bound molecules is plotted on the x-axis. Data are representative of three independent experiments, and the observed ratio is based on the standard FRET channel (see Methods). Surface plots were not created to make the linear dependence clearer. (C) Observed ratiometric FRET from various mixtures of mTFP1 ([T]) and mTFP1-mVenus ([T-V]). The overlap index is a measure of how much mTFP1 fluorescence appears in the FRET channel (see Methods), and is proportional to the quantityfAD/fDDplotted in Panel A. Data are representative of three independent experiments.
Pseudo-color is indicative of z-axis (R) value. (D) Observed ratiometric FRET, based onRalt, from various mixtures of mTFP1 ([T]), mTFP1-mVenus
An alternative method of quantifying FRET via ratiometric methods is to divide the donor emission intensity by the emission intensity of direct acceptor excitation (IAacc) [13,14]. In this method, a reduction of the donor intensity is indicative of increased FRET, and this FRET indicator is normalized by the directly-excited acceptor intensity, which is an indicator of the total number of probes. In this formulation, one avoids introducing an inherent non-linearity into the denominator of the ratio. We denote this alternative ratio asRalt
Ralt~
Idon D
Iacc A
: ð12Þ
In the common situation where we can excite the acceptor without exciting the donor, and following the above nomenclature and assumptions, we arrive at
Ralt~
N
Dð1{EwFÞfDD
N AfAA
~N DfDD
N AfAA
{N DfDDEwF
N AfAA
, ð13Þ
which shows that the ratioRaltshould be linearly proportional to the fraction of probes capable of FRET.
To test this hypothesis, we again mixed various dilutions of mTFP1-mVenus and mTFP1. But in contrast to the above experiment, as the concentration of mTFP1-mVenus was reduced, equal concentrations of both mTFP1 and mVenus were added to retain a constant total mVenus concentration (monomer plus tandem). The results confirmed that indeed there is a linear relationship between Ralt and QF (Fig. 2D, R2= 0.99). Note, however, that this same linearity result does not apply to Ralt21, when one divides the emission intensity of direct acceptor excitation with the donor emission intensity.
Fluorescence Lifetime Imaging
Another way of measuring FRET is by observing the lifetime of a population of excited donor molecules, which is commonly called fluorescence lifetime imaging microscopy (FLIM). When a donor molecule undergoes FRET rather than standard fluores-cence emission, the average fluoresfluores-cence lifetime decreases [24,25]. In particular, the FRET efficiency E is related to the fluorescence lifetime by
E~1{tf
t, ð14Þ
wheretand tfare the fluorescence lifetimes in the absence and presence of acceptor, respectively [25]. Now, consider a situation where there are two populations of excited donor molecules, one that is capable of FRET (FY*) and one that is not (FN*), and FRET
occurs with rate constant ket while fluorescence occurs with rate constantkf(Fig. 3A). Given (i) standard first-order kinetics for these processes and (ii) that the resultant measured lifetime of the mixture is a fractional weighted average of the individual components, it can be shown that
Emix:1{tmix
t ~wFE, ð15Þ
where Emix and tmix are the overall FRET efficiency and fluorescence lifetime of such a mixture of molecules, respectively. Condition (ii) will be the case so long as measurement error of the pure and FRETting lifetimes is the approximately the same, and
the measurement method does not bias the estimate toward one population or another. Rearrangement of Eq. 15 gives
tmix~t{tEwF, ð16Þ
which shows that the fraction of molecules capable of undergoing FRET, QF, should be linearly proportional to the measured fluorescence lifetimetmix. Moreover, both the slope and y-intercept of this line should be the related to donor fluorescence lifetime.
To test these hypotheses we again prepared mixtures of mTFP1 and the mTFP1-mVenus tandem fusion in various proportions, and then measured their fluorescence lifetimes (Fig. 3B). As predicted, we see a linear correlation between the fraction of mTFP1-mVenus molecules and the fluorescence lifetime (R2= 0.98), with a y-intercept that agrees with that measured for pure mTFP1 (2.98 ns vs. 2.94+/20.07 ns). Based on the calculated slope (20.78 ns—see Fig. 3B) and the measured value of the mTFP1 lifetime (2.94 ns), we calculate the FRET efficiency of mTFP1-mVenus tandem mole-cules as 27% based on Eq. 16 (0.78/2.94). This corresponds closely to the measured FRET efficiency of 25% based on standard definition in Eq. 14 ((2.94 ns-2.2 ns)/2.94 ns), further justifying Eq. 16 and the calculated value of the slope.
Relating Measured FRET to the Fraction of Active Probes When comparing the measured FRET responses to a mathe-matical model simulation, it is useful to extract the absolute fraction of probes that are in the active state (Qa= P*/PTOT). This is possible, Figure 3. Fluorescence Lifetime Imaging. (A) Simple kinetic scheme for decay of excited FRET probes that are either capable (FY*)
or not capable of FRET (FN*). The molecules can relax by fluorescence
(kf) or by FRET (ket). (B) Various proportions of mTFP1 and mTFP1-Venus
were mixed in solution and their fluorescence lifetimes analyzed as described in Methods. The concentration of mTFP1 is denoted as [T] and mTFP1-Venus as [T-V]. We verified that adding corresponding concentrations of pure mVenus to decreasing amounts mTFP1 did not change the fluorescence lifetime of mTFP1, showing that this lifetime did not depend on mTFP1 concentration and that mTFP1 did not undergo significant intermolecular FRET given the concentrations used (0.1 mg/mL). Error bars denote 95% confidence intervals.
so long as one uses eithertmixorRaltto quantify FRET (which both vary linearly with the fraction of probes capable of FRET), and can force all of the probes in a cell either to the active state or inactive state. If the probe is for a kinase, for example, then one can use saturating doses of phosphatase or kinase inhibitors to accomplish this. Then, the FRET measurements of these completely active and inactive states may be measured; denote these Fact and Fin, respectively. Here, FRET measurements may refer to eithertmix or Ralt. Then, because the measurement scales linearly with the number of probes capable of FRET, the fraction of active probes can be written in terms of known quantities as follows
Fmix~Finð1{waÞzFactwa[wa~
Fmix{Fin
Fact{Fin
, ð17Þ
where Fmix denotes either tmix or Ralt. Thus, linear FRET measurements combined with simple controls allows for direct estimation of the fraction of active probes in the cell.
Conclusions
Our theoretical analysis supported by experimental data yields important guidelines for using FRET probe data with quantitative modeling. We have shown that only in rare circumstances will the fraction of molecules capable of FRET be linearly related to an upstream enzymatic activity. Therefore, FRET data should only be directly compared to model variables analogous to the active FRET probe state, and not upstream enzyme activities. For instance, FRET data from the probe for ERK kinase, EKAR [2], should only be compared to the phosphorylation levels of an ERK substrate (corresponding to P*), and not the levels of active, doubly-phosphorylated ERK (proportional to enzyme activity). Of relevance to this study, FRET data from a probe for a small GTPase such as RhoA should only be compared to levels of RhoGTP (P*) or an explicitly modeled FRET probe, and not directly to GEF or GAP activities. Furthermore, we show that FRET measurements obtained via the standard ratiometric method have an inherently non-linear signal-response relationship and should therefore be avoided if possible. Although we found the dynamic range of the Raichu-RhoA FRET probe was not great enough to observe this inherent non-linearity, some probes have a greater dynamic range, and further probe improvements will push experiments into a regime where ratiometric measurements would become troublesome. Importantly, however, we find that
measur-ing FRET either by (1) ratiometric methods where the donor emission intensity is divided by the emission intensity of direct acceptor excitation (Ralt) or (2) FLIM (tmix), results in a linear signal-response relationship between the measurement (Raltortmix) and the fraction of probes capable of undergoing FRET. Quantifying FRET via Ralt removes the inherent non-linearity built into the denominator of the typically-used ratio R. As ratiometric methods involve less expensive, simpler microscope equipment than does FLIM, it may be preferable to use such methods, so long as data are quantified viaRalt, and not with other commonly used forms of the ratio. Moreover, it has been shown in one case that ratiometric methods have a slightly better signal-to-noise ratio than lifetime imaging methods [2], albeit the difference is small, a non-linear form of the ratiometric method was employed, and it is not clear whether it holds true for different probes and fluorescent protein pairs. Also, some donors, such as ECFP, have multi-exponential lifetimes, and therefore are not suitable for FLIM. On the other hand, FLIM has several technical advantages. First, slight photobleaching of the donor will not affect FLIM measurements, whereas it would introduce significant artifacts into ratiometric methods, showing up as increased FRET. Second, photobleaching of the acceptor plays a minimal role in FLIM, but is likely to occur in ratiometric imaging due to direct acceptor excitation, and can introduce artifacts showing up as decreased FRET. This is particularly important given the well-known weak photostability of the YFP derivatives, which are commonly-used as acceptors. Lastly, dark acceptors, such as REACh [26], may be used in FLIM, greatly increasing the ability to multiplex FRET measurements for observing multiple activities in the same cell in real time. Thus, FLIM may be preferable when one is interested in analysis of networks over long time scales (or with high frequency measurements), which is usually the case in the context of mathematical modeling.
Acknowledgments
We thank Prof. Ulla Knaus for use of the fluorescence plate reader.
Author Contributions
Conceived and designed the experiments: MRB AVK. Performed the experiments: MRB AVK KK JPS. Analyzed the data: MRB AVK. Contributed reagents/materials/analysis tools: WK KIA JPS. Wrote the paper: MRB AVK KK JPS KIA WK.
References
1. Gao X, Zhang J (2008) Spatiotemporal analysis of differential Akt regulation in plasma membrane microdomains. Mol Biol Cell 19: 4366–4373.
2. Harvey CD, Ehrhardt AG, Cellurale C, Zhong H, Yasuda R, et al. (2008) A genetically encoded fluorescent sensor of ERK activity. Proc Natl Acad Sci U S A 105: 19264–19269.
3. Miyawaki A, Griesbeck O, Heim R, Tsien RY (1999) Dynamic and quantitative Ca2+measurements using improved cameleons. Proc Natl Acad Sci U S A 96: 2135–2140.
4. Mochizuki N, Yamashita S, Kurokawa K, Ohba Y, Nagai T, et al. (2001) Spatio-temporal images of growth-factor-induced activation of Ras and Rap1. Nature 411: 1065–1068.
5. Violin JD, Zhang J, Tsien RY, Newton AC (2003) A genetically encoded fluorescent reporter reveals oscillatory phosphorylation by protein kinase C. J Cell Biol 161: 899–909.
6. Wang Y, Botvinick EL, Zhao Y, Berns MW, Usami S, et al. (2005) Visualizing the mechanical activation of Src. Nature 434: 1040–1045.
7. Yoshizaki H, Ohba Y, Kurokawa K, Itoh RE, Nakamura T, et al. (2003) Activity of Rho-family GTPases during cell division as visualized with FRET-based probes. J Cell Biol 162: 223–232.
8. Offterdinger M, Georget V, Girod A, Bastiaens PI (2004) Imaging phosphorylation dynamics of the epidermal growth factor receptor. J Biol Chem 279: 36972–36981. 9. Timpson P, McGhee EJ, Morton JP, von Kriegsheim A, Schwarz JP, et al. (2011) Spatial regulation of RhoA activity during pancreatic cancer cell invasion driven by mutant p53. Cancer Res 71: 747–757.
10. Scheich C, Kummel D, Soumailakakis D, Heinemann U, Bussow K (2007) Vectors for co-expression of an unrestricted number of proteins. Nucleic Acids Res 35: e43.
11. Huber HJ, Laussmann MA, Prehn JH, Rehm M (2010) Diffusion is capable of translating anisotropic apoptosis initiation into a homogeneous execution of cell death. BMC Syst Biol 4: 9.
12. O’Connor CL, Anguissola S, Huber HJ, Dussmann H, Prehn JH, et al. (2008) Intracellular signaling dynamics during apoptosis execution in the presence or absence of X-linked-inhibitor-of-apoptosis-protein. Biochim Biophys Acta 1783: 1903–1913.
13. Rehm M, Dussmann H, Prehn JH (2003) Real-time single cell analysis of Smac/ DIABLO release during apoptosis. J Cell Biol 162: 1031–1043.
14. Rehm M, Huber HJ, Dussmann H, Prehn JH (2006) Systems analysis of effector caspase activation and its control by X-linked inhibitor of apoptosis protein. EMBO J 25: 4338–4349.
15. Rehm M, Huber HJ, Hellwig CT, Anguissola S, Dussmann H, et al. (2009) Dynamics of outer mitochondrial membrane permeabilization during apoptosis. Cell Death Differ 16: 613–623.
16. Song Q, Saucerman JJ, Bossuyt J, Bers DM (2008) Differential integration of Ca2+-calmodulin signal in intact ventricular myocytes at low and high affinity Ca2+-calmodulin targets. J Biol Chem 283: 31531–31540.
18. Neves SR, Tsokas P, Sarkar A, Grace EA, Rangamani P, et al. (2008) Cell shape and negative links in regulatory motifs together control spatial information flow in signaling networks. Cell 133: 666–680.
19. Aoki K, Matsuda M (2009) Visualization of small GTPase activity with fluorescence resonance energy transfer-based biosensors. Nat Protoc 4: 1623–1631.
20. Ai HW, Henderson JN, Remington SJ, Campbell RE (2006) Directed evolution of a monomeric, bright and photostable version of Clavularia cyan fluorescent protein: structural characterization and applications in fluorescence imaging. Biochem J 400: 531–540.
21. Nagai T, Ibata K, Park ES, Kubota M, Mikoshiba K, et al. (2002) A variant of yellow fluorescent protein with fast and efficient maturation for cell-biological applications. Nat Biotechnol 20: 87–90.
22. Padilla-Parra S, Auduge N, Lalucque H, Mevel JC, Coppey-Moisan M, et al. (2009) Quantitative comparison of different fluorescent protein couples for fast FRET-FLIM acquisition. Biophys J 97: 2368–2376.
23. Kumagai Y, Kamioka Y, Yagi S, Matsuda M, Kiyokawa E (2011) A genetically encoded Forster resonance energy transfer biosensor for two-photon excitation microscopy. Anal Biochem 413: 192–199.
24. Wouters FS, Bastiaens PI (1999) Fluorescence lifetime imaging of receptor tyrosine kinase activity in cells. Curr Biol 9: 1127–1130.
25. Bastiaens PI, Squire A (1999) Fluorescence lifetime imaging microscopy: spatial resolution of biochemical processes in the cell. Trends Cell Biol 9: 48–52. 26. Ganesan S, Ameer-Beg SM, Ng TT, Vojnovic B, Wouters FS (2006) A dark