p
-Charts in the Quality Control of the Grading
Process in the High Education
Mirko Savi
ć
∗Summary: European countries are making efforts to change their educational system. These changes include implementation of the ECTS (European Credit Transfer and Accumulation System) and are based on the Bologna Declaration. Adoption of ECTS will necessitate new quality standards in higher education, especially in grading procedures. With only small modifications, the control charts(such as p-charts) used in production and distribution applications can be applied to educational purposes.
Key words: ECTS (European Credit Transfer and Accumulation System), Quality control, Statistical analysis, p-charts
JEL: I21, C40
1. ECTS Grading Scale
What is quality? It is not easy to define quality, and a number of different definitions have been proposed. One definition that makes sense is fitness for use. Another plausible definition of the word states that quality is the extent to which customers feel that a product or service exceeds their needs and expectations.
In the realm of education, quality is the extent to which participants feel the educational and grading processes are corresponding to the specified requirements. Stakeholders in science and education are becoming interested in quality monitoring. They want their evaluation criteria to be used, and they want evaluations to be done on a regular basis (Hemlin and Wenneberg (2002)). Using reliable research methods, educational institutions must determine how well participants' needs are met and how reliable products are*.
The European Credit Transfer and Accumulation System (ECTS) is a student-oriented system of regulations based on the student workload required to achieve a program’s objectives. ECTS allows students (both local and foreign) to evaluate and compare various academic programs. ECTS facilitates mobility* and academic recognition and helps universities to organize and revise their study programmes. It can be used across a variety of programmes*
∗
(disciplines?) and it makes European higher education more attractive to international students.
The introduction of ECTS is based on the high quality of national education systems*: how to measure the quality of education in each country and how to attain defined standards.
Students are given both a national (or sometimes local) grade and also an ECTS grade. The ECTS grading scale ranks the students on a statistical basis.
Elaboration of statistical data on student performance is a prerequisite to applying the ECTS grading system. According to ECTS, the following rates among assigned pass grades are proposed (Marinković-Nedučin and Lazetić (2002)):
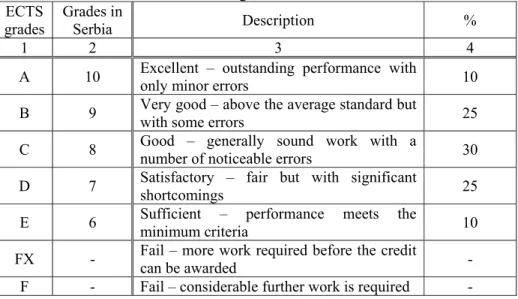
Table 1. ECTS grading scale - % of successful students normally achieving the grade
ECTS grades
Grades in
Serbia Description %
1 2 3 4
A 10 Excellent – outstanding performance with
only minor errors 10
B 9 Very good – above the average standard but
with some errors 25
C 8 Good – generally sound work with a
number of noticeable errors 30
D 7 Satisfactory – fair but with significant
shortcomings 25
E 6 Sufficient – performance meets the
minimum criteria 10
FX - Fail – more work required before the credit
can be awarded -
F - Fail – considerable further work is required -
The inclusion of failure rates is optional.
We can consider a grading process as a mass service production. Variation always exists in this process. To control this process from the position of objectivity and ECTS standards, we can effectively use statistical control charts.
2. Implementation of control charts in quality control
we attempt to remove them in order to reduce the amount of process variation, and therefore improve the process.
In 1924, Walter Shewhart of Bell Telephone Laboratories introduced the concept of statistical quality control: controlling quality of mass-produced goods.Shewhart believed that variation always exists in processes, and that the variation can be studied, monitored, and controlled using statistics. In particular, Shewhart developed a statistical tool called the control chart. Such a chart is a graph that can demonstrate when a process needs to be adjusted and when the process should be left alone.
Following World War II, neither statistical quality control nor the statistical control chart were greatly used. The man credited with turning this situation around is W. Edwards Deming. By following the Deming's philosophy, quality culture was introduced as well as the overall approach of applying quality principles to all company activities. This philosophy is named ‘total quality management’ (TQM) or ‘total quality control’ (TQC). Deming (1986) summarized the fundaments of his approach to quality and productivity improvement in 14 points. He stressed that implementation of these 14 points requires both changes in management philosophy and the use of statistical methods. Additionally, Deming believed it necessary to follow every point, not merely some of them.
W. Edwards Deming's 14 Points:
Create constancy of purpose toward improvement of product and service with a plan to become competitive, stay in business, and provide jobs.
Adopt a new philosophy.
Cease the dependence on mass inspection.
End the practice of awarding business on the basis of price tag.
Constantly improve the system of production and service to improve quality and productivity, and thus constantly decrease costs.
Institute training. Workers should know how to do their jobs and to be aware of how their jobs affect quality and the success of the company.
Institute leadership. The job of management is leadership, not mere supervision.
Drive out fear, so that everyone may work more effectively for the company.
Break down organizational barriers.
Eliminate slogans, exhortations, and arbitrary numerical goals and targets for the workforce that urges the workers to achieve new levels of productivity and quality without providing methods.
Eliminate work standards and numerical quotas. Work standards and numerical quotas that specify the quantity of goods to be produced while quality is ignored are counterproductive and should be eliminated.
Institute a vigorous program of education and self-improvement.
Take action to accomplish the transformation. A management structure that is committed to continuous improvement must be put in place.
Deming’s work was oriented mostly to the production of goods, but lately his principles have been implemented in the social sciences.
3. Statistical Process Control (SPC)
The ultimate goal of SPC is continuous process improvement. SPC is often used to monitor and improve manufacturing processes. However, it is also commonly used to improve service quality. For instance, we might use SPC to improve the quality of the grading process.
In order to understand SPC methodology, we must realize that the variations we observe in quality characteristics are caused by various factors. These factors include equipment, materials, people, methods and procedures, the environment, etc. Here we must distinguish between usual process variation and unusual process variation. Usual process variation results from what we call common causes of process variation* (maybe reduce repitition).
Common causes are sources of variation that have the potential to influence all process observations. In fact, these sources of variation are inherent to the current process design. In grading, the common cause of variation is mainly student’s knowledge.
Common cause variation can be substantial. Obsolete or poorly maintained equipment, a poorly designed process, and inadequate instructions for students are examples of common causes that might significantly influence all process output.
Together, the important and unimportant common causes of variation determine the usual process variability. That is, these causes determine the amount of variation that exists when the process is operating routinely. We can reduce the amount of common cause variation by removing some of the important common causes. Reducing common cause variation is usually a student's responsibility, for instance, poor preparation for exams, concentration, tiredness, etc.
Assignable causes are sources of unusual process variation. These are intermittent or permanent changes in the process that are not common to all process observations and that may cause important process variation. Assignable causes are usually of short duration, but they can be persistent or recurring conditions. In the grading process, assignable causes could be the product of changes in the professor’s objectivity.
When a process is influenced only by common cause variation, it will be in statistical control.
When a process is influenced by one or more assignable causes, it will not be in statistical control.
In general, in order to bring a process into statistical control, we must find and eliminate undesirable assignable causes of process variation, and we should (if feasible) build desirable assignable causes into the process. When we have done these things, the process is what we call a stable, common cause system. This means that the process operates in a consistent fashion and is predictable. Since there is no unusual process variation, the process meets all the requirements and doing all it can be expected to do.
When a process is in statistical control, management of the faculty can estimate the process capability. That is, it is possible to determine whether the process performs well enough to produce output that meets ECTS requirements. If it does not, action by local supervision will not remedy the situation.
Finally, the SPC approach is really a philosophy of doing business. It is an entire firm or organization that is focused on a single goal: continuous quality and productivity improvement. The impetus for this philosophy must come from managers of educational institutions. Unless management is supportive and directly involved in the ongoing quality improvement process, the SPC approach will not be successful.
4. Sampling Grading Processes, Rational Subgroups, and Control Charts
In order to find and eliminate assignable causes of process variation, we sample output from the grading process. To do this, we first decide which variables – that is, which process characteristics – will be studied. Whenever possible and economical, it is best to study a quantitative, rather than a categorical, variable. Naturally, the variable of interest in this case will be numerical (grades).
When we study a quantitative process variable, we say that we are employing measurement data. To analyze such data, we take a series of samples (usually called subgroups) over time. Each subgroup consists of a set of several measurements; subgroup sizes between 2 and 6 are often used. Summary statistics (for example, means and ranges) for each subgroup are calculated and are plotted versus time. By comparing plot points, we hope to discover when unusual process variations are taking place.
Each subgroup is typically observed over a short period of time – a period in which the process operating characteristics do not greatly change. These periods of time are ‘rational subgroups’.
In order to obtain rational subgroups, we must determine the frequency with which the subgroups will be selected. For example, we might select a subgroup once every 15 minutes, once per hour, or once per day. In general, we should observe subgroups often enough to detect important process changes.
When the sampling frequency has been established, we then need to determine the subgroup size and how we will actually select the measurements of each subgroup. It is recommended that the subgroup size be held constant. We typically choose the subgroup size (denoted by N) to be from 2 to 6, with n=4 or 5 being a frequent choice. To illustrate how we can actually select the subgroup measurements, suppose that we select a subgroup of 5 students from every exam. We can select these students by using a consecutive, periodic, or random sampling process. If we employ consecutive sampling, we would select 5 consecutive students examined by one professor. Such a subgroup provides a ''freeze-frame picture'' of the process at a particular point in time, and the chance of variations occurring within the subgroups is minimized.
A statistical rule of thumb requires that we use at least 20 subgroups, each containing 4 or 5 measurements. Following this rule permits judgement of statistical control and allows us to obtain reasonable estimates of the process mean and variability (Cooper and Schindler (2001)).
Subgrouped data is used to determine when assignable causes of process variation exist. Typically, we analyze subgrouped data by plotting summary statistics for the subgroups versus time. The resulting plots are often called ‘graphs of process performance’.
Now, we wish to answer a very basic question: is the performance variation seen on the graphs due to the usual process variation (common causes), or is the variation due to one or more assignable causes (unusual variations)? In other words, is the variation of the student’s performance on the exams due to their knowledge or is it because professors do not have firm criteria? We can answer these questions by converting the graphs of performance into control charts.
This is called ‘statistical process monitoring’. The use of 'seat of the pants intuition' is not a particularly effective way to decide whether observed process performance is unusual. By using a control chart, we can reduce our chances of making two possible errors – (1) taking action when none is needed and (2) not taking action when it is needed.
If all observed plot points are between the LCL and UCL, and if no unusual patterns of points exist, (this will be explained later) we have no evidence of assignable causes. We then assume that the process is in statistical control. In this case, only common causes of process variation exist, and no action to remove assignable causes is taken. If we were to take such action, we would be unnecessarily tampering with the process.
If we observe one or more plot points outside the control limits, then we have evidence that the process is out of control due to one or more assignable causes. Here we must take action on the process to remove these assignable causes. It is important to document a process while the subgroups of data are being collected. The time at which each subgroup is taken is recorded, and the person who collected the data is also noted. Any process changes must be documented. Any potential sources of variation that may significantly affect the process output should also be noted.
5. Charts for Fraction Nonconforming* (perhaps this should be “nonconforming fractions”?)
When an inspected unit does not meet the desired criteria, it is said to be nonconforming (or defective). Conversely, when an inspected unit meets the desired criteria, it is said to be conforming (or nondefective). In the context of the grading process we will address conformance and nonconformance according to the ECTS rates.
The control chart that we set up for this type of data is called a p-chart. To construct this chart, we observe subgroups of n units over time. We inspect (test) the n units in each subgroup and determine the number d of these units that are nonconforming. We then calculate for each subgroup
n d
pˆ = = the fraction of nonconforming units in the subgroup. (1)
We then plot the fraction of nonconforming units versus time on the p-chart. Units can be described by a binomial distribution if the process is in statistical control and is producing a fraction of nonconforming units d in a subgroup of n. If, in addition, n is large enough so that np is greater than 2, then both d and the fraction of nonconforming units are approximately described by a normal distribution. Furthermore, the population of all possible
p
ˆ
values has meanp
upˆ = and standard deviation
(
)
n p p
p
−
= 1
ˆ
Therefore, if p is known, we can compute three standard deviation control limits for values of pˆ by setting
(
)
n p p p
UCL= +3 1− (3)
and
(
)
n p p p
LCL= −3 1− (4)
According to ECTS, a p value is specified for every grade (see Table 1, column 4).
The control limits calculated using the above formulas are considered to be trial control limits. Plot points* (should this be “Points plotted”?) above the upper control limit suggest that one or more assignable causes have increased the process fraction nonconforming* (again, this might mean “nonconforming fractions”). Data for subgroups associated with assignable causes that have been eliminated will be omitted, and data for newly observed subgroups will be added when calculating the revised limits. This procedure is carried out until the process is in statistical control. When control is achieved, the limits can be used to monitor grading process performance. The capability for a process that is in statistical control is expressed using the estimated process fraction nonconforming*.
The size n of each subgroup should be large enough so that np is greater than 2 (some practitioners prefer np to be greater than 5). Since we often monitor a p that is quite small (0,05 or 0,01* (these commas may need changed to periods. I’m unclear if these are decimals or data sets) or less), n must often be quite large. Subgroup sizes of 50 to 200 or more are common. Another suggestion is to choose a subgroup size that is large enough to give a positive lower control limit. Often when employing a p-chart, smaller subgroup sizes give a calculated lower control limit that is negative. A positive LCL is desirable because it allows us to detect opportunities for process improvement. Such an opportunity exists when we observe a plot point below the LCL. If there is no LCL, it would obviously be impossible to obtain a plot point below the LCL.
that a p-chart would not be appropriate if the likelihood of a unit being defective depends on whether other units produced in close proximity are defective. Another procedure is to randomly select the units in a subgroup from all the units produced in a specified period of time. As long as the subgroup size is small relative to the total number of units produced in a specified period, the units in the randomly selected subgroup will likely be independent.
In general, the large subgroup sizes that are required can make it difficult to set up useful p-charts. For this reason, it is sometimes possible (especially when we are monitoring a very small p) to relax the requirement that np be greater than 2. Practice shows that even if np is somewhat smaller than 2, we can still use the three standard deviation p-chart control limits. In such a case, we detect assignable causes by looking for points outside the control limits and by looking for runs of points on the same side of the center line.
6. Empirical Results
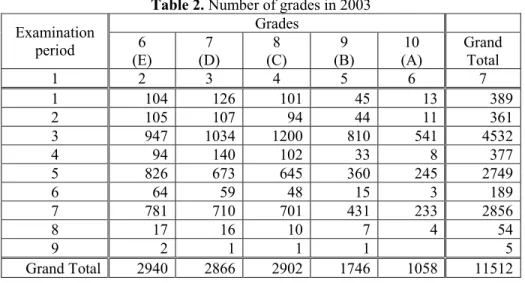
Faculty of Economics* (this would be written “The economics faculty” or “The economics department” in English, but since it’s a title, I’m unsure if it needs changed) in Subotica (Serbia) is making the first steps to introduce ECTS in the educational process. Statistical control p-charts were used at the faculty* (department?) to evaluate the existing grading process and to see if it is compatible with the ECTS grading system.
The data was obtained from the Student Services database at the Faculty of Economics in Subotica for full professor Milutin Stojković.
All passing grades during nine examination periods in 2004 were collected and the following table has been constructed:
Table 2. Number of grades in 2003
Grades Examination
period 6
(E)
7 (D)
8 (C)
9 (B)
10 (A)
Grand Total
1 2 3 4 5 6 7
1 104 126 101 45 13 389
2 105 107 94 44 11 361
3 947 1034 1200 810 541 4532
4 94 140 102 33 8 377
5 826 673 645 360 245 2749
6 64 59 48 15 3 189
7 781 710 701 431 233 2856
8 17 16 10 7 4 54
9 2 1 1 1 5
Statistica for Windows, Release 4.5 was used in performing computations and creating graphs.
The control p-chart has been made for grade 6, or grade "E" according to ECTS. The p value for calculations is known on the basis of recommended rates for this grade (p = 10% or 0,1).
Figure 1. p-chart for passing grade 6 (E) Grade 6 (E): Mean: .255386
Standard: .100000
Examination period
BRSTUD6 (Proportion per Sample)
.100000 .074835 .125165
0 0.05 0.1 0.15 0.2 0.25 0.3 0.35 0.4 0.45
1 2 3 4 5 6 7 8 9
Figure 1: the upper control limit, UCL (upper dashed line), is 12,5% (0,125165) and the lower control limit, LCL (lower dashed line) is 7,5% (0,074835). The center line, CL, is representing a specified rate of 10%. The empirical line for the fraction of students with grade 6 is high above the specified UCL in every examination period. The mean fraction value of original data is 25,5% which is two times higher than the specified rate (10%). This means that the number of students with grade 6 (E) at the faculty of Economics in Subotica are very far from the specified ECTS rate. The similar results were achieved for grade 7 (D). The empirical line of fractions for grades 8 (C), 9 (B) and 10 (A) is significantly below the LCL.
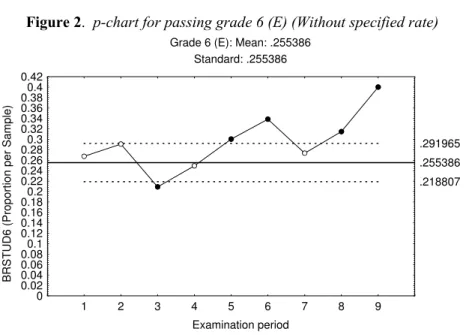
Figure 2. p-chart for passing grade 6 (E) (Without specified rate) Grade 6 (E): Mean: .255386
Standard: .255386
Examination period
BRSTUD6 (Proportion per Sample)
.255386
.218807 .291965
0 0.02 0.04 0.06 0.080.1 0.12 0.14 0.16 0.180.2 0.22 0.24 0.26 0.280.3 0.32 0.34 0.36 0.380.4 0.42
1 2 3 4 5 6 7 8 9
On Figure 2, a new LCL and UCL were calculated, while the mean fraction value and center line are the same. The original data’s mean fraction value is 25,5%. Our conclusion is that the grading process is out of control limits even if empirical limits were calculated on the basis of empirical data. This is because five points are out of defined limits. If we exclude assignable causes from analysis we will have the grading process in control but it will still be very far from the specified limits of ECTS.
Figure 3. p-chart for passing grade 6 (E) (Subject 1303) Subject 1303, Grade 6 (E): Mean: .234756
Standard: .100000
Examination period
VAR8 (Proportion per Sample) .100000
0.00000 .231478
0 0.05 0.1 0.15 0.2 0.25 0.3 0.35 0.4 0.45 0.5 0.55 0.6
1 2 3 4 5 6 7
It is obvious that in examination periods 2, 4 and 6, these students rate above specified limits, which means that unusual process variations are existing. The real explanation for these assignable causes should be given by the professor teaching Subject 1303.
In addition to p-charts, other statistical methods could be used to analyze differences between empirical results and ECTS standards. This may provide a better understanding of the problem on the faculty level, as well as the level of individual subjects.
7. Conclusion
Implementation of the ECTS system could be a difficult and slow process. Many aspects of the educational system should be adjusted to ECTS requirements and (probably) improved. The grading process is one of the most sensitive functions in educational institutions. To change that process and, at least, get closer to the ECTS standards will require much work.
References
Cabrera J., McDougall A. (2002) Statistical Consulting, Springer, USA
Cooper D.R., Schindler P.S. (2001) Business Research Methods, seventh edition,
McGraw-Hill Irwin, USA
Deming W.E., (1986) Out of the Crisis, Cambridge, MA: Massachusets Institute of Technology, Center for Advanced Engineering Study, USA
Dretzke, B., J. (2001) Statistics with Microsoft Excel, second edition, Prentice Hall, Upper Saddle River, New Jersey, USA
Heerman N. E. (1970) Readings in Statistics for the Behavioral Sciences, Prentice-Hall, New York, USA
Hemlin S., Wenneberg S. B. (2002) From Quality Control to Quality Monitoring and Organisational Learning, Copenhagen Business School, Department of
Management, retrieved June 16, 2006, from:
http://www.cbs.dk/departments/mpp/papers/wp13-2002.pdf
Judd, C.M., Smith, E.R., Kidder, L.H. (1991) Research Methods in Social Relations, Harcourt Brace Jovanovich College Publishers, The Druyden Press, Orlando, Florida, USA.
Marinković-Nedučin, R., Lazetić P. (2002) Evropski sistem prenosa bodova u visokom
školstvu – vodić kroz ECTS, Alternativna akademska obrazovna mreža, Beograd
Marques de Sa, J. P. (2003) Applied Statistics Using SPSS, Statistica and Matlab Springer, USA
Thomke, S. (2003) R&D Comes to Services, Harward Business Review. April, 71-75
p-karte u kontroli kvaliteta procesa ocenjivanja u visokom obrazovanju
Rezime: Evropske zemlje čine napore da usklade svoj sistem visokog obrazovanja sa Bolonjskom deklaracijom i da implementiraju evropski sistem prenosa bodova (ECTS). To može da bude dug i složen proces. ECTS sistem u visokom obrazovanju zahteva nov
pristup povećanju kvaliteta obrazovnog procesa, a posebno procesa ocenjivanja koji
predstavlja jedan od najosetljivijih aspekata. Kontrolne karte, na primer p-karte, predstavljaju standardan metod za kontrolu kvaliteta u proizvodnji dobara i usluga. Sa
manjim prilagođavanjem one se mogu primeniti i u obrazovnom procesu radi kontrole
kvaliteta procesa ocenjivanja u visokom obrazovanju.
Ključne reči: ECTS (evropski sistem prenosa bodova), Kontrola kvaliteta, Statistička analiza, p-karte