Journal of Public Health
Universidade de São Paulo
Faculdade de Saúde Pública
VOLUME 34
NÚMERO 3
JUNHO 2000
Revista de Saúde Pública
p. 214-22
Assessing the effects of global warming and
local social and economic conditions on the
malaria transmission
Quantificando os efeitos do aquecimento global
e das condições socioeconômicas locais na
transmissão de malária
Hyun M Yanga and Marcelo U Ferreirab
aDepartamento de Matemática Aplicada do Instituto de Matemática, Estatística e Ciência da
Compu-tação da Universidade Estadual de Campinas. Campinas, SP, Brasil. bDepartamento de Parasitologia do Instituto de Ciências Biomédicas da Universidade de São Paulo. São Paulo, SP, Brasil
YANG Hyun M a and Marcelo U Ferreirab Assessing the effects of global warming and local social and economic
Correspondence to:
Hyun M. Yang Caixa Postal 6065
13081-970 Campinas, SP, Brasil E-mail: [email protected]
The publication of this article was subsidied by Fapesp ( Process nº 00/01601-8). Submitted on 8/2/1999. Reviewed on 3/1/2000. Approved on 2/2/2000.
Assessing the effects of global warming and
local social and economic conditions on
the malaria transmission
Quantificando os efeitos do aquecimento global
e das condições socioeconômicas locais na
transmissão de malária
Hyun M Yanga and Marcelo U Ferreirab
aDepartamento de Matemática Aplicada do Instituto de Matemática, Estatística e Ciência da
Compu-tação da Universidade Estadual de Campinas. Campinas, SP, Brasil. bDepartamento de Parasitologia do Instituto de Ciências Biomédicas da Universidade de São Paulo. São Paulo, SP, Brasil
Keywords
Malaria, transmission#. Anopheles,
parasitology#. Plasmodium,
physiology#. Temperature#.
Socio-economic factors#. Epidemiology
models. Insect vectors. Host parasite relations.
Descritores
Malária, transmissão#. Anopheles,
parasitologia#. Plasmodium,
fisiologia#. Temperatura ambiente#.
Fatores socioeconômicos#. Modelos
epidemiológicos. Insetos vetores. Relações hospedeiro-parasita.
Abstract
Objective
To show how a mathematical model can be used to describe and to understand the malaria transmission.
Methods
The effects on malaria transmission due to the impact of the global temperature changes and prevailing social and economic conditions in a community were as-sessed based on a previously presented compartmental model, which describes the overall transmission of malaria.
Results/Conclusions
The assessments were made from the scenarios produced by the model both in steady state and dynamic analyses. Depending on the risk level of malaria, the effects on malaria transmission can be predicted by the temperature ambient or local social and-economic conditions.
Resum o Resum o Resum o Resum o Resum o
Objetivo
Apresenta-se um modelo matemático mostrando como esse instrumento pode ser importante para descrever a transmissão de malária.
Métodos
Baseado no modelo proposto previamente, foram quantificados os efeitos de dois fatores que podem afetar a transmissão da malaria: a temperatura ambiente e as condições socioeconômicas locais.
Resultados/Conclusões
2 1 5 Rev Saúde Pública 2000;34(3):214-22
www.fsp.usp.br/rsp
Global warming and malaria transmission Yang H M & Ferreira MU
INTRODUCTION
Based on the mathematical model developed by
Yang16 to describe quantitatively the overall picture
of malaria transmission, the possible effects of global warming and local social and economic conditions on the epidemiology of malaria were assessed.
There has recently been a growing interest on the effects of global warming on the epidemiology of ma-laria and other vector-borne diseases.11,13 Due to the “greenhouse effect”, the global annual average tem-perature at the surface of the Earth is expected to in-crease between 1.0 to 3.5°C by the year 2100. The impact of global warming is currently considered by the World Health Organization as one of the greatest public health challenges for the next century.11 Higher ambient temperatures within the range of 20-31°C af-fect malaria transmission in several ways: (a) develop-ment of Anopheles is shortened; (b) biting capacity of female mosquitoes is increased since their gonado-trophic cycle (interval between bloodmeals) is short-ened; and (c) the extrinsic incubation period of Plas-modium decreases logarithmically. As a result, small increases in temperature can result in large increases in the vectorial capacity of mosquitoes, defined as the daily potential number of inoculations originated in an infectious person.8
Therefore the effect of global warming on malaria transmission, for instance, has been examined in terms of increased vectorial capacity.7,8 However, the impact of temperature changes may be disproportionately higher in populations with low levels of antimalarial immunity, such as children and adults coming from malaria-free regions.9
Another aspect of malaria risk is related to local conditions. The change in malaria transmission can be associated with social and economic conditions (e.g., prevailing health care services and sanitation improvements). In most endemic areas of malaria the effect of a temperature increase on the disease transmission seems limited, however changes in social and economic conditions are far more important than a temperature shift.7
The epidemiological impact of temperature changes and social and economic conditions on malaria incidence in communities with different levels of acquired immunity was analyzed. To do this, in the section 2 some results are transported from the model
presented by Yang.16 The mathematical formulas are
numerically treated to furnish some epidemiological scenarios in the section 3 and in the section 4 these results are commented.
METHODS
The system of dynamic equations and the steady
state equilibrium points are transported from Yang,16
and the range over which the model’s parameters can vary are discussed.
For humans, the seven compartments are: suscepti-ble (x1), incubating (x2), infectious (x3), immune (x4),
partially immune (x5), non-immune but with
immuno-logical memory (x6), and incubating after reinfection (x7). The fractions of the host population are described by the following system of differential equations
( ) [ ] ( ) ( ) ( ) [ ] [ ] ( ) + + − = + + − + = + + − = + − + + = + − = + + + − = + − + + + = , ) ( ) ( ) ( ) ( ) ( ) ( ) ( ) ( ) ( ) ( ) ( ) ( ) ( ) ( ) ( ) ( ) ( ) ( ) ( ) ( ) ( ) ( ) ( ) ( ) ( ) ( ) ( ) ( ) ( ) ( ) ( 7 1 6 3 7 . 6 3 3 7 5 2 6
. 1 4 3 2 5
5 . 4 1 7 1 5 3 3 4
. 1 2 3
3
. 3 1 1 2
2 . 1 3 6 3 2 1 . t x t x t hy t x t x t hy t x t x t x t x t hy t x t x t x t x t x t hy t x t x t x t x t x t x t x t hy t x t x t hy t x t x t x µ γ θ µ π θ π µ π π µ π γ γ µ γ γ α µ γ θ µ π α θ µ [ ] [ ] [ ] ( ) + − = + + − = + + − + + + = , ) ( ' ' ) ( ) ( ) ( ) ( ' ' ) ( ) ( ) ( ) ( ) ( ' ' ) ( ) ( ) ( ) ( ) ( ) ( ) ( ) ( 3 2 2 3
. 3 1 2 2
2 . 1 3 3 2 1 1 1 1 . t Y t Y T t Y t Y T t Y t fx t Y t Y t fx t Y t Y t Y T T T t Y e α µ σ α µ σ α µ µ σ σ φ
where µ and α are, respectively, the natural and dif-ferential mortality rates of human host, θ is the natu-ral resistance rate against malaria, γ1-1 and γ-1 are the average periods, respectively, to initiate the produc-tion of gametocytes and to build up an effective im-mune response, π1, π2 and π3 are, respectively, rates at which protective immunity, partial immunity and
immunological memory are lost, and h is the
inocula-tion rate. The quantity y3(t) is the proportion of in-fectious mosquitoes.
The mosquitoes population is divided into three compartments Y1, Y2 and Y3, which are, respectively, the number of susceptible, incubating (infected but non-infectious), and infectious mosquitoes. The mos-quito population is described by the following sys-tem of equations
where µ’ and α’ are, respectively, the natural and in-duced mortality rates of mosquitoes, φ and µe(T) are, respectively, the rates of oviposition and of eggs be-coming non-viable, σ1-1(T) and σ
2
-1(T) are, respectively, the duration of the cycle from egg to mature adult and
the duration of sporogony in the mosquito, and f is
the transmission rate. Even though the rate of oviposi-(1)
tion may depend on temperature,8 that is designated by symbol T, is restricted and dependent only on the pa-rameters σ1, σ2and µe.
The equation systems (1) and (2) have two equilibrium points. The first one is the disease-free community,which is given by
As can be noted, the table above was obtained from the literature for the parameters θ, γ1, γ, π1, π2, π3, µ, φ, µ’, σ1(T) and σ2(T). Regarding the differen-tial (α) and induced (α’) mortality rates, it was as-sumed a decrease of about 2% and 6% respectively in the expected life span. Finally, µe(T) was calcu-lated applying the equation
= = = 3 2 ; 0 1 1 and i for y y i
for vector population, and for host population.
= = = , 7 , , 3 , 2 ; 0 1 1 and i for x x i K
The second one is malaria at endemic levels, given by
for the vector population and for the host population,
( )
[
]
( ) + = + + + + + = + + + = , ) ( ' ' ' ' ) ( ' ' ) ( ' ' ' ' ) ( 2 3 1 3 3 3 3 2 3 3 2 3 3 1 c x c x x y fx T fx x y fx x y α µ α µ σ α µ α µ α µ( ) ( ) 3 0
2 3 3
3 +Bx +Cx +D=
x A , ' ' ' ' ) ( ) ( 2 2 1 1 0 α µ α µ σ σ µ γ α µ γ θ γ + × + + × + × + + + = h T T f R
The model can be analyzed with steady state equi-librium values3 and dynamic state.15 The steady state analysis is performed by calculating the equations (5), (6) and (7), which are the equilibrium points, consider-ing a chosen set of values for the parameters. The time-dependent solution of the equation systems (1) and (2), from the initial values until the system reaches a new equilibrium point, enables the dynamics analy-sis. Both dynamic and steady state analyses depend heavily on the R0 value given by the equation (8).
To obtain useful epidemiological information, the actual values for the model’s parameters must be known. Since their values can vary a lot, Table 1 shows the range and the mean value that the model’s parameters can assume.
Table 1 - The values found in the literature for the parameters of the model. The symbols d and y stand, for days and years, respectively.
Parameter Range Mean
θ -1 (d) 1 – 4 6 2.5
γ1-1 (d) 15 – 19 5 17
γ -1 (d) 50 – 150 14 100
π1-1 (d) 40 – 60 14 50
π2-1 (y) 0.2 – 5 4 2.6
π3-1 (y) 1 – 20 4 10.5
µ -1 (y) 50 – 55 4 52.5
α -1 (y) 2,450 – 2,964 2,707
φ (eggs/d) 25 – 65 5 45
µ’ -1 (d) 10 – 14 5 12
α’ -1 (d) 98 – 191.8 144.9
σ1-1(T) (d) 10 (31 °C) – 26 (20 °C) 8,10 18
σ2-1(T) (d) 8 (31 °C) – 22 (20 °C) 8,10 15
µe
-1(T) (d) 0.020 (31 °C) – 0.052 (20 °C) 0.036
, 1 ' ' ) ( )
( 1
− + = α µ φ σ µeT T
which is the equation (4) given in Yang.16
The focus will be on the effects on malaria transmis-sion due to temperature changes and social and eco-nomic conditions prevailing in a community. For this reason, the temperature is considered as independent parameters θ, γ1, γ, π1, π2, π3 and φ as being related, roughly and indirectly, to the general social and eco-nomic conditions; and the temperature is of course considered as dependent parameters µe(T), σ1(T) and σ2(T) as being related to temperature changes. Also, three representative risk areas of malaria are consid-(3)
(4)
(5)
(6)
plus a third degree polynomial to determine x3, given by
The auxiliary variables b1, b2, b3, b4, b5, c1 and c2, and the coefficients of the polynomial A, B, C and D can
be found in Yang.16
Finally, the basic reproduction ratioR0 is given by
which is a product of four terms.16
(7)
(8)
2 1 7 Rev Saúde Pública 2000;34(3):214-22
www.fsp.usp.br/rsp
Global warming and malaria transmission Yang H M & Ferreira MU
ered by assigning particular values for the inocula-tion h and transmission f rates.
With regard to the temperature independent pa-rameters, it is being assumed that they are related to social and economic conditions prevailing in the community. For instance, they can be used as an indicator of the health care system effectiveness in identifying promptly new malaria cases, their sani-tation condition and economic activity, which can be responsible for deforestation. It is possible to characterize, with due caution, the lower bounded values of Table 1 as representative of good social and economic conditions. Here is the rationale. Note that the values in Table 1 are given in terms of the periods of time (the inverse of the respective rates) which decrease as the rates increase. Observe that the lower bounded values of the parameters reveal a quick acquisition of immunity (represented by a
large value of γ) and also a rapid natural recovery
period (represented by a large value of θ). Both fea-tures can be associated to the effectiveness of the health care system in identifying and treating ma-laria infected individuals (represented by an
addi-tional increase in θ), and providing the individuals
some kind of protection (vaccine when available).
As explained in Yang,16 the quick immunity response
and drug treatment can lead to the early differentia-tion of the merozoites to sexual gametocytes
(rep-resented by a large value of γ1). Nevertheless, the
quick immunity response can induce protection for a limited amount of antigens, which results in quick loss rates of acquired (fully and partially
protec-tive) immunity (represented by a large value of π1
and π2) and immunological memory (represented by
a large value of π3). Finally, the surrounding envi-ronment can be adverse to the vector proliferation
(represented by a low value of φ). Hence, the lower
bound values of Table 1 can be associated with a community with good social and economic condi-tions. Conversely, the upper bound values can be related to a community with deteriorating social and economic conditions. Based on what was discussed, the indices 1, 2 and 3 are introduced to describe a community with good, intermediate, and deteriorat-ing social and economic conditions.
In regard to the temperature dependent parameters, the values presented in Table 1 are related to lower tem-perature (20°C), intermediate temperature (between 20-31°C but close to 21.5°C because the shape of the curve of parameters as a function of the temperature follows a
hyperbolic curve), and higher temperature (31°C). To
these parameters, the indices 1, 2 and 3 to are introduced to describe areas of low, intermediate, and high tempera-ture. Note that when temperature increases from 20°C to
about 21.5°C, the values of temperature dependent pa-rameters increase from the lower bound to the mean
ones.10 When the remaining 9.5°C in the temperature
increases, the parameters are allowed to grow from the mean values to the upper bounded values.
Both social and economic conditions and temperature were subdivided in 3 classes. For that, there are 9 possi-ble combinations of the model’s parameters values given in Table 1. They are denoted them as Pij, which appears hereafter and throughout the text, for each possible case, with i=1, 2 and 3 and j=1, 2 and 3. The first subscript i
stands for the social and economic conditions, and the second subscript j for the temperature. Because of that, for temperature independent parameters it was assigned 1 for lower bound values, 2 for the mean values and 3 for upper bound values on the range of parameters. For tem-perature dependent parameters it was assigned 1 for the
values corresponding to upper bound (20°C), 2 to the
mean values (21.5°C), and 3 to those corresponding to the lower bound (31°C) on the range of parameters.
Finally, the inoculation rate h and the transmission rate f, both being dependent on the average number of mosquito bites in humans, measure the level of interac-tion between these populainterac-tions. Three levels of human exposure to the mosquito are analyzed, to reproduce low, intermediate and high contact of human hosts with mosquito populations. Note that both h and f can be dependent on temperature (vectorial capacity), social and economic conditions (bed-net and deforestation),
and other climate changes (El Niño phenomenon).
In the next section, based on the above results and the values of the model’s parameters, the effects of global warming and social and economic conditions on malaria epidemiology are assessed.
RESULTS
The effects of different levels of acquired immunity among human hosts and the influence of temperature on the parameters related to vectors on malaria transmis-sion are assessed. For that, the 9 possible combinations of the values shown in Table 1 were taken into account.
First is the steady state analysis. Tables 2 to 4 show
the values of the equilibrium point and the basic
re-production ratio for 3 sets of values for h and f.
Table 2 analyzes the situation where a community is in a low risk area of malaria, where h=0.07 and f=0.13 (both in days1).
A broad range of basic reproduction ratios
values of R0 mean that small efforts can lead to the eradication of the disease. The 6 cases P11 to P23 show that the disease cannot develop itself in this commu-nity (R0≤ 1). However, if cases P31, P32 and P33 (re-ferred as P3·, the deteriorating social and economic conditions regardless the temperatures) are consid-ered, it is possible to note that the disease can de-velop itself at a low endemic level in the community.
Consider the deterioration of the social and eco-nomic conditions in a community. There is a transition from disease-free (P2·) to malaria at endemic levels (P3·), due to deteriorating social and economic conditions. Note that a community who lives in higher tempera-tures suffers more the effects of deterioration of so-cial and economic conditions, a case where the dis-ease can develop itself at a prevalence rate of 53.3%. The deteriorating conditions favor about 46.7% of the susceptible individuals to have their first exposure to the parasite (the region was previously malaria-free), which can result in an increased number of severe malaria disease.
Consider the effect of the increasing temperatures in a low malaria transmission area. This effect can only be seen in the case that reproduces deteriorating (P3·) so-cial and economic conditions. The increasing
tempera-tures are responsible for a low variation on the basic
reproduction ratio, from 1.14 to 1.91. However, the
pro-portion of susceptible individuals (x1) is reduced from 87.8 % to 53.3 %. The increasing temperatures favor about 34.5 % of the susceptible individuals to have their first exposure with the parasite. Observe that half of this variation occurs when the temperature increases 1.5°C. The decreasing in the number of susceptible in-dividuals is transferred to inin-dividuals who are partially
immune (x5) and non-immune but with immunological
memory (x6). But the number of incubating individuals after reinfection (x7) is almost negligible. The propor-tion of infectious mosquitoes is situated below 1%.
When there is a transition from malaria-free to endemic levels, there is a more pronounced effect on malaria transmission due to the changes in the social and economic parameters at higher temperatures. Therefore, in a low malaria transmission area, the presence deteriorating social and economic conditions is much more hazardous than the temperature changes.
Table 3 analyzes a community at an intermediate risk of malaria, where h=0.25 and f=0.17 (both in days-1).
A broad range of the basic reproduction ratio is
seen, with its intermediate values varying from 0.35 to 8.90. Cases P11, P12 and P13 (good social and economic conditions) represent a malaria disease-free commu-nity, but in other 6 cases P21 to P33 malaria is at en-demic levels.
Table 2 - The equilibrium values (in percentage) of human and mosquito populations and the basic reproduction ratio R0 for h=0.07 and f=0.13 (both in days-1). The notation P
ij (see the text), where (i,j) = 1, 2 and 3, are related to the chosen values for
the parameters.
P11 P12 P13 P21 P22 P23 P31 P32 P33
x1 100 100 100 100 100 100 87.8 70.6 53.3
x2 0 0 0 0 0 0 0.03 0.08 0.12
x3 0 0 0 0 0 0 0.27 0.61 0.93
x4 0 0 0 0 0 0 0.14 0.49 1.21
x5 0 0 0 0 0 0 3.24 8.70 15.8
x6 0 0 0 0 0 0 8.56 19.4 28.6
x7 0 0 0 0 0 0 0.01 0.02 0.06
y1 100 100 100 100 100 100 99.6 99.0 98.5
y2 0 0 0 0 0 0 0.28 0.55 0.59
y3 0 0 0 0 0 0 0.17 0.48 0.96
R0 0.075 0.097 0.14 0.43 0.55 0.75 1.14 1.43 1.91
Table 3 - The equilibrium values (in percentage) of human and mosquito populations, and the basic reproduction ratio R0, for
h=0.25 and f=0.17 (both in days-1). The notation P
ij is accordingly to Table 2.
P11 P12 P13 P21 P22 P23 P31 P32 P33
x1 100 100 100 50.7 40.1 29.4 19.2 15.4 11.5
x2 0 0 0 0.18 0.21 0.22 0.16 0.16 0.16
x3 0 0 0 1.05 1.21 1.31 1.28 1.26 1.22
x4 0 0 0 2.08 3.51 6.04 7.29 9.52 12.9
x5 0 0 0 15.2 20.2 26.3 38.5 42.1 45.9
x6 0 0 0 30.7 34.6 36.4 33.3 31.2 27.9
x7 0 0 0 0.11 0.18 0.28 0.28 0.33 0.38
y1 100 100 100 98.1 97.8 97.6 97.2 97.3 97.4
y2 0 0 0 1.29 1.28 1.01 1.73 1.46 1.00
y3 0 0 0 0.65 0.95 1.40 1.03 1.27 1.64
2 1 9 Rev Saúde Pública 2000;34(3):214-22
www.fsp.usp.br/rsp
Global warming and malaria transmission Yang H M & Ferreira MU
Consider the deterioration of the social and economic conditions. There is a transition from disease-free (P1·) to malaria at endemic levels (P2·), and the transition from these levels to higher ones (P3·). Note that a community living in higher temperatures suffers more with the wors-ening of social and economic conditions, where the disease can develop itself at a prevalence rate of 53.3%. The deteriorating social and economic conditions favor about 70.6% of the susceptible individuals to have their first exposure to the parasite (the region was previously malaria-free). In another situation, when the disease was previously established, the community living at lower temperature suffers more the effects of the worsening of social and economic conditions, resulting in 31.5% of the susceptible individuals to have their first expo-sure to the parasite.
Consider the effect of the increasing temperatures in an intermediate malaria transmission area. This effect can be seen in cases that reproduce intermediate (P2·) and deteriorating (P3·) social and economic conditions. The increase in temperatures leads to a low variation on the basic reproduction ratio, from 2.01 to 8.90. There is a greater change from case P21 to case P23, which decreases the susceptible individuals in 21.3%, which is a greater proportion than from case P31 to case P33. Also, half of this variation occurs when the
tempera-ture increases 1.5°C. At this temperature change, the
increasing rate for individuals who are partially immune (x5) is greater than for individuals who are non-immune
but have immunological memory (x6). The proportion
of immune individuals (x4) also increases, but the pro-portion of infectious individuals (x3) remains at a low value. The number of incubating individuals after rein-fection (x7) is still small, but about 10-times greater in relation with the previous situation. The proportion of
infectious mosquitoes is situated around 1%. The
ba-sic reproduction ratio showed a broader variation than that of the previous situation.
Again, when there is a transition from malaria-free to endemic levels, malaria transmission is more dangerous if a community lives in deteriorating social and economic conditions at higher temperatures.
However, when the disease is already established in the area, the worsening of social and economic conditions in a community who lives at lower temperatures has a great effect on malaria transmission.
Table 4 analyzes the situation where a community is
under high-risk of malaria, where h=0.90 and f=0.25
(both in days-1).
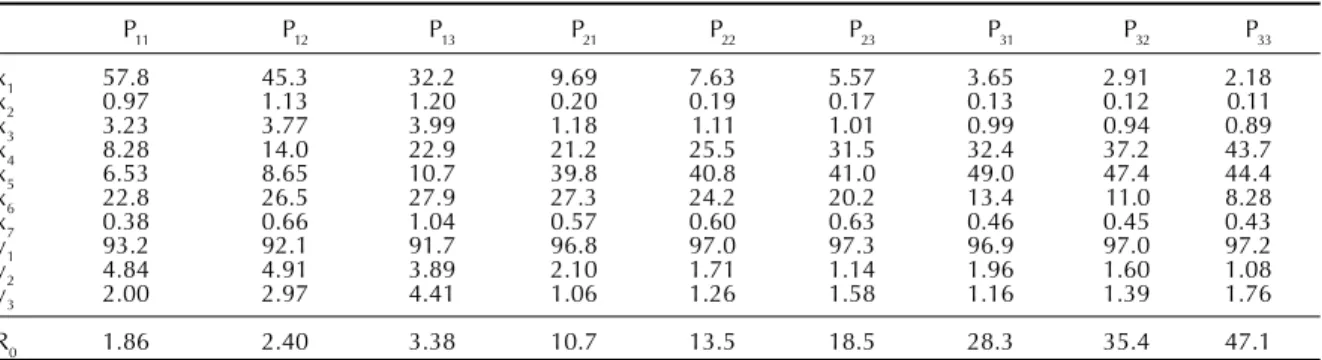
The basic reproduction ratio varies a lot, from 1.86 to 47.1. The higher values of R0 mean that only greater ef-forts can lead to the disease eradication (in general, only disease control). All 9 cases show the disease at en-demic levels. In this situation, excluding cases P11, P12
and P13, the proportion of infectious individuals remains at low values. Changing from case P11 to case P33, the proportion of immune and partially immune individuals increases dramatically. The proportion of infectious mos-quitoes is situated around 2%, but in for case P13 it is 4.41%. Also, in this case, there is the highest proportion of incubating individuals after reinfection.
Consider the deteriorating social and economic condi-tions in a community. There is a transition from disease at low endemic levels (P1·) to intermediate prevalence (P2·), and a transition from these to higher endemic levels (P3·). If social and economic conditions are deteriorating from good to intermediate, then there is an increase in new cases of malaria (48.11%) at lower temperatures (P11
to P21). This finding is in opposition to what was found in previous cases, especially when the disease was not established. In this situation (high risk), the effects of worsening social and economic conditions at lower tem-peratures contribute more to malaria transmission.
Consider the effect on malaria transmission due to increasing temperatures in a high-risk malaria area. This effect can be seen in all situations that reproduce good (P1·), intermediate (P2·) and deteriorating (P3·) social and economic conditions. When the temperature increases, about 25.6% of the susceptible individuals will have their first exposure to the parasite. Half of this variation
occurs when the temperature increases 1.5°C. In this
situation, the variation in malaria prevalence is much
Table 4 - The equilibrium values (in percentage) of human and mosquito populations, and the basic reproduction ratio R0, for h=0.90 and f=0.25 (both in days-1). The notation P
ij is accordingly to Table 2.
P11 P12 P13 P21 P22 P23 P31 P32 P33
x1 57.8 45.3 32.2 9.69 7.63 5.57 3.65 2.91 2.18
x2 0.97 1.13 1.20 0.20 0.19 0.17 0.13 0.12 0.11
x3 3.23 3.77 3.99 1.18 1.11 1.01 0.99 0.94 0.89
x4 8.28 14.0 22.9 21.2 25.5 31.5 32.4 37.2 43.7
x5 6.53 8.65 10.7 39.8 40.8 41.0 49.0 47.4 44.4
x6 22.8 26.5 27.9 27.3 24.2 20.2 13.4 11.0 8.28
x7 0.38 0.66 1.04 0.57 0.60 0.63 0.46 0.45 0.43
y1 93.2 92.1 91.7 96.8 97.0 97.3 96.9 97.0 97.2
y2 4.84 4.91 3.89 2.10 1.71 1.14 1.96 1.60 1.08
y3 2.00 2.97 4.41 1.06 1.26 1.58 1.16 1.39 1.76
more pronounced at lower temperatures when a com-munity lives in good social and economic conditions.
Regarding to the range of allowed values to h and f,
only the variation of the parameter f was constrained
to obtain the proportion of infectious mosquitoes (which is equivalent to sporozoite rate measured in field surveys), varying from 0.17% to 4.41%. On the range of variation of both parameters, the above three tables show a strong effect of the temperature and the level of immunity on malaria transmission.
The effect of variation of the parameters h and f on malaria transmission is now analyzed. Both parameters can be influenced by many factors. The transition from low to intermediate risk community reveals that the tran-sition from case P23L (Table 2) to case P
23
I (Table 3)
shows the highest variation in malaria prevalence (70.6%), while for the intermediate to high risk commu-nities, the transition from case P13I (Table 3) to case
P13H (Table 4) shows the highest variation in malaria prevalence (67.8%). The superscripts L, I and H stand, respectively, for low, intermediate, and high risk of ma-laria. It was observed, however, that at higher tempera-tures the effects of malaria transmission is seen mostly among individuals living in more favorable social and economic conditions. A trend of the same magnitude is seen in the variation of malaria prevalence in all ranges of temperature variation, except for the change from intermediate to high risk transmission in a community with extremely deteriorating social and economic con-ditions (a minor effect is seen in the transmission P33I [Table 3] to case P33H [Table 4] with a 9.32% variation).
Second, the numerical simulations of the systems of equations (1) and (2) are considered. The purpose of the dynamic simulation is to show how the disease reaches the steady state. The ordinary differential equations are solved by the 4th order Runge-Kutta method.12
Only three situations were analyzed regarding the temperature and the focus was on three regions: dis-ease-free community, but potentially under risk (Southeast Brazil); disease at low endemic levels (Amazon region and Southeast Asia); and disease at high endemic levels (Africa). To the first region can be assigned lower bound values for parameters which do not depend on the temperature, and for those which depend on the temperature, the upper bound
values (20°C). To the second region, mean values
were assigned to parameters that are dependent and not dependent on the temperature. Finally, the last area is characterized by upper bound values for pa-rameters which do not dependent on the
tempera-ture, and lower bound values (31°C) for those which
depend on the temperature.
Figure 1 shows a disease-free region (Southeast Bra-zil), and the case corresponding to P11 of Table 2 was chosen, with R0=0.075. This case takes into account the temperature of 20°C, and values corresponding to lower bound for temperature independent and upper bound for temperature dependent parameters. This is a commu-nity with relatively good social and economic conditions, situated in an area relatively protected against malaria transmission and at lower temperatures. The assumed initial values are (in percentage): x1=10, x2=20, x3=20, x4=15,
x5=15, x6=10, x7=10, y1=60, y2=20 and y3=20.
Observe that the disease is eradicated in the first years after the outbreak of an epidemic, despite the initial high prevalence of malaria.
In the next two simulations, the following initial
con-ditions (in percentage) were considered: x1=99.8,
x2=0.1, x3=0.1, x4= x5= x6= x7=0, y1=100 and y2= y3=0. The purpose is to analyze the development of the dis-ease at endemic levels when a small number of malaria cases is introduced into a disease-free community.
Figure 2 presents the disease at a low endemic level region (Amazon region and Southeast Asia) and case
P22 of Table 3 was considered, with R0=2.56. This case takes into account temperatures between 20-31°C (near
21.5°C), and mean values for the parameters. It is a
community with intermediate social and economic conditions, situated in an area of low malaria trans-mission and at intermediate temperatures.
There is a strong fluctuation in all dynamic vari-ables. The first epidemic outbreak has a duration of 3
years (see x3), and the second outbreak has its peak delayed in about 6 years.
Figure 3 shows the disease at high endemic level region (Africa), which corresponds to P33 of Table 4, with R0=47.1. This case takes into account a
tempera-Figure 1 - The time-dependent classes of individuals corresponding to P11 of Table 2 are showed (the curves corresponding to their classes are labeled by their respective numbers). The relatively low valued fractions x2 and x7 do not appear, and the actual fraction x1 is obtained by
2 2 1 Rev Saúde Pública 2000;34(3):214-22
www.fsp.usp.br/rsp
Global warming and malaria transmission Yang H M & Ferreira MU
fort is not carried out consistently, then there will be new cases of malaria, and there will be damped oscilla-tions until a new endemic level is reached.
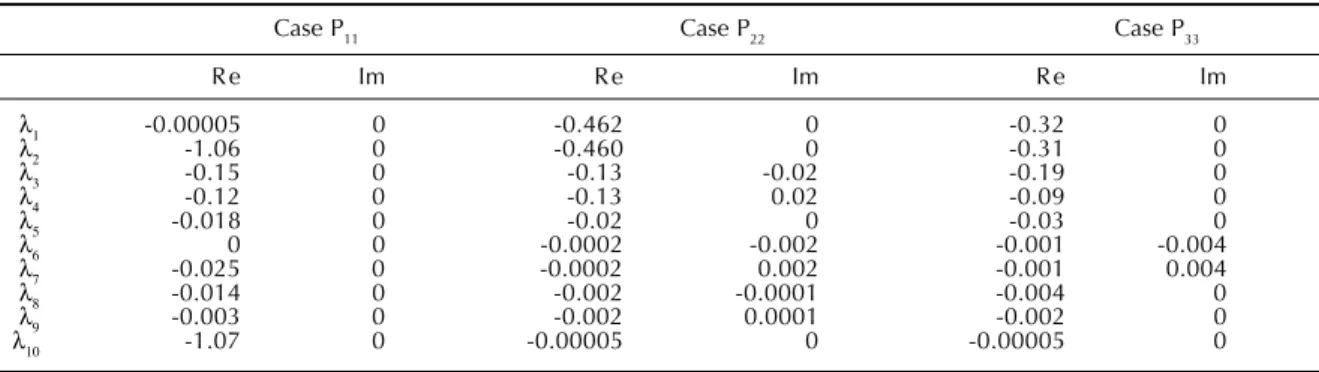
Finally, Table 5 shows the eigen-values correspond-ing to the equilibrium points considered in the dy-namic simulation.
As cited in Yang,16 the equilibrium point is stable if all eigen-values have negative real part. The first case (P11) shows an exponential decay until it reaches the disease free situation, because all eigen-values are real and negative, except for one which is zero,
ac-cordingly to Yang.16 The other two cases (P
22 and
P33) show damped oscillations until they reach the
malaria at endemic levels. Both cases present com-plex eigen-values.
DISCUSSION
The temperature in malaria transmission plays an im-portant role. For instance, the increase in the tempera-ture around 1.5°C leads the malaria-free environment to low endemicity, or the occurrence of malaria disease from low to high endemicity. Therefore, as reported before in the literature, the effects of global warming on malaria transmission is a major challenge in the next years.8 The situation where social and economic condi-tions associated parameters varied was also analyzed. The effects of variation in these parameters are much stronger than the effects of increasing ambient tem-peratures, as expected.7 However, the effects of social and economic conditions on malaria transmission must be considered, because these effects were assessed indirectly by interpreting the values assigned to the temperature independent parameters.
Also, inoculation and transmission rates can have a broad range of variation in the same region. For exam-ple, when there is deforestation or irregular rainfall (El
Niño phenomenon), the interaction between the
hu-man host and the mosquito vector can be changed. Therefore, if case P11 of the intermediate transmission
Table 5 - The eigen-values corresponding to the equilibrium points P11 (Table 2), P22 (Table 3) and P33 (Table 4). Re and Im stand for the real and imaginary parts of a complex number, respectively.
Case P11 Case P22 Case P33
R e Im R e Im R e Im
λ1 -0.00005 0 -0.462 0 -0.32 0
λ2 -1.06 0 -0.460 0 -0.31 0
λ3 -0.15 0 -0.13 -0.02 -0.19 0
λ4 -0.12 0 -0.13 0.02 -0.09 0
λ5 -0.018 0 -0.02 0 -0.03 0
λ6 0 0 -0.0002 -0.002 -0.001 -0.004
λ7 -0.025 0 -0.0002 0.002 -0.001 0.004
λ8 -0.014 0 -0.002 -0.0001 -0.004 0
λ9 -0.003 0 -0.002 0.0001 -0.002 0
λ10 -1.07 0 -0.00005 0 -0.00005 0
Figure 3 - The time-dependent classes of individuals corresponding to P33 of Table 4 are showed. The relatively low valued fraction x7 does not appear.
Figure 2 - The time-dependent classes of individuals corresponding to P22 of Table 3 are showed. The relatively low valued fraction x7 does not appear.
ture of 31°C, and values corresponding to upper bound
for temperature independent and lower bound for tem-perature dependent parameters. It is a community with relatively deteriorating social and economic conditions, situated in an area of relatively great risk of malaria transmission and at higher temperatures.
The first epidemic peak is much more accentuated, and subsequent peaks decrease more rapidly than in the previous case.
When the malaria region is at endemic levels, if the
parameters are changed to drive the basic
ef-REFERENCES
1. Arruda M, Carvalho MB, Nussensweig RS, Aracic M, Ferreira AW, Cochrane AH. Potential vectors of malaria and their different susceptibility to
Plasmodium falciparum and Plasmodium vivax in northern Brazil identified by immunoassay. Am J Trop M ed H yg 1986;35:873-81.
2. Camargo LMA, Dal Colleto GMD, Ferreira MU, Gurgel SM, Escobar AL, Marques A et al.
Hypoendemic malaria in Rondônia (Brazil, Western Amazon Region): seasonal variation and risk group in an urban locality. Am J Trop Med H yg 1996;55:32-8.
3. Coutinho FAB, Massad E, Burattini MN, Yang HM, Azevedo Neto RS. Effects of vaccination programs on transmission rates of infections and related threshold conditions for control. IMA J Math Appl Med Biol
1993;10:187-206.
4. Deleron P, Chognet C. Is immunity to malaria really short-lived? Parasitol Today 1992;8:375-8.
5. Gilles HM, Warrell DA. Bruce Chwatt’s essential malariology. London: Edward Arnold; 1993.
6. Greenwood BM, Marsh K, Snow R. Why do some african children develop severe malaria? Parasitol Today 1991;7:277-81.
7. Jetten TH, Martens WJM, Takken W. Model simulations to estimate malaria risk under climate change. J M ed Entomol 1996;33:361-71.
(Table 3) is compared with one of the higher transmis-sion (Table 4), there is a dangerous change, from dis-ease-free to relatively high malaria endemic levels. Based on that, the data observed in the Amazon region can fit in this model. There was observed about 1% of
infectious mosquitoes2 and around 45% of individuals
without antibodies against malaria parasite.1 Among
them, besides the susceptible individuals, there are in-cubating, infectious, non-immune but with immunologi-cal memory, and incubating after reinfection individu-als. Therefore, this community can be explained by case
P32 of Table 3, a community with extremely deteriorat-ing social and economic conditions livdeteriorat-ing in intermedi-ate temperatures at an intermediintermedi-ate risk of malaria.
The basic reproduction ratio increased from case
P11L (Table 2) to case P 33
H (Table 4). Since this
pa-rameter is associated with secondary infections among mosquito populations originated by one sin-gle infectious mosquito, hence in case P11L (and all others with R0≤ 1) there will be a natural eradication of malaria when malaria infection at any rate is in-troduced in the community. On the other hand, in case P33H (and all others with R
0 > 1), malaria dis-ease is at endemic levels because each infectious
mosquito can infect more than one susceptible mos-quito. For that, controlling or eradication efforts in-crease with increasing R0.
The climate, social and economics changes, and environmental changes due to rainfall or deforestation showed to influence dramatically malaria prevalence. The variation in the temperatures interferes much more with the pattern of the prevalence among individuals in a community with good social and economic conditions than that those living in extremely deteriorating social and economic conditions. Also, almost half of the decrease in susceptible individuals occurs during a
temperature variation of about 1.5°C. However, the
variation in the transmission parameters has a more pronounced effect in a community with good social and economic conditions living at higher temperatures.
Finally, it is more realistic that a region’s social and economic conditions (deterioration or improvement) should be managed by humans rather than temperature variation. Therefore, in regions where there is a malaria risk, a good management of the surrounding environment and the existence of a good health care system can avoid the outbreak of malaria transmission in the area.
8. Lindsay SW, Birley MH. Climate change and malaria transmission. Ann Trop Med Parasitol 1996;90:573-88.
9. Loevisohn ME. Climatic warming and increased malaria incidence in Rwanda. Lancet 1994;343:714-8.
10. MacDonald G. The epidemiology and control of malaria. London: Oxford University Press; 1957.
11. Patz JA, Epstein PR, Burke TA, Balbus JM. Global climate change and emerging infectious diseases. J Am Med Assoc 1997;275:217-23.
12. Press WH, Flannery BP, Teukolsky SA, Etterling WT.
N umerical recipes: the art of scientific computing (FO RTRAN version). Cambridge: Cambridge University Press; 1989.
13. Roger DJ, Packer MJ. Vector-borne diseases, models and global change. Lancet 1993;342:1282-4.
14. Saul AJ. Transmission dynamics of Plasmodium falciparum. Parasitol Today 1996;12:74-9.
15. Yang HM. Modelling vaccination strategy against directly transmitted diseases using a series of pulses. J Biol Syst 1998;6:187-212.
16. Yang HM. Malaria transmission model for different levels of acquired immunity and temperature-dependent parameters (vector). Rev Saúde Pública