BGD
12, 11191–11216, 2015
Microbial carbon and nitrogen in China’s
forests
Z. Zhou and C. Wang
Title Page
Abstract Introduction
Conclusions References
Tables Figures
◭ ◮
◭ ◮
Back Close
Full Screen / Esc
Printer-friendly Version Interactive Discussion
Discussion
P
a
per
|
Discussion
P
a
per
|
Discussion
P
a
per
|
Discussion
P
a
per
Biogeosciences Discuss., 12, 11191–11216, 2015 www.biogeosciences-discuss.net/12/11191/2015/ doi:10.5194/bgd-12-11191-2015
© Author(s) 2015. CC Attribution 3.0 License.
This discussion paper is/has been under review for the journal Biogeosciences (BG). Please refer to the corresponding final paper in BG if available.
Soil resources and climate jointly drive
variations in microbial biomass carbon
and nitrogen in China’s forest ecosystems
Z. H. Zhou1,*and C. K. Wang1,*
1
Center for Ecological Research, Northeast Forestry University, 26 Hexing Road, Harbin 150040, China
*
These authors contributed equally to this work.
Received: 28 February 2015 – Accepted: 22 June 2015 – Published: 16 July 2015
Correspondence to: C. K. Wang ([email protected])
BGD
12, 11191–11216, 2015
Microbial carbon and nitrogen in China’s
forests
Z. Zhou and C. Wang
Title Page
Abstract Introduction
Conclusions References
Tables Figures
◭ ◮
◭ ◮
Back Close
Full Screen / Esc
Printer-friendly Version Interactive Discussion
Discussion
P
a
per
|
Discussion
P
a
per
|
Discussion
P
a
per
|
Discussion
P
a
per
|
Abstract
Microbial metabolism plays a key role in regulating the biogeochemical cycle of for-est ecosystems, but the mechanisms driving microbial growth are not well understood. Here, we synthesized 689 measurements on soil microbial biomass carbon (Cmic) and nitrogen (Nmic) and related parameters from 207 independent studies published during
5
the past 15 years across China’s forest ecosystems. Our objectives were to (1) examine patterns in Cmic, Nmic, and microbial quotient (i.e., Cmic/Csoiland Nmic/Nsoilrates) by climate zones and management regimes for these forests; and (2) identify the factors driving the variability in the Cmic, Nmic, and microbial quotient. There was a large vari-ability in Cmic (390.2 mg kg−1), Nmic (60.1 mg kg−1), Cmic: Nmic ratio (8.25), Cmic/Csoil
10
rate (1.92 %), and Nmic/Nsoil rate (3.43 %) across China’s forests, with coefficients of variation varying from 61.2 to 95.6 %. The natural forests had significantly greater Cmic and Nmic than the planted forests, but had less Cmic: Nmic ratio and Cmic/Csoil rate. Soil resources and climate together explained 24.4–40.7 % of these variations. The Cmic: Nmic ratio declined slightly with the Csoil: Nsoil ratio, and changed with
lat-15
itude, mean annual temperature and precipitation, suggesting a plastic homeostasis of microbial carbon-nitrogen stoichiometry. The Cmic/Csoil and Nmic/Nsoil rates were responsive to soil resources and climate differently, suggesting that soil microbial as-similation of carbon and nitrogen be regulated by different mechanisms. We conclude that soil resources and climate jointly drive microbial growth and metabolism, and also
20
emphasize the necessity of appropriate procedures for data compilation and standard-ization in cross-study syntheses.
1 Introduction
Microbial metabolism is closely coupled with ecological processes such as decom-position, nutrient cycling, and rhizosphere symbiosis, and hence plays a key role in
25
BGD
12, 11191–11216, 2015
Microbial carbon and nitrogen in China’s
forests
Z. Zhou and C. Wang
Title Page
Abstract Introduction
Conclusions References
Tables Figures
◭ ◮
◭ ◮
Back Close
Full Screen / Esc
Printer-friendly Version Interactive Discussion
Discussion
P
a
per
|
Discussion
P
a
per
|
Discussion
P
a
per
|
Discussion
P
a
per
Microbial communities convert soil organic carbon (Csoil) and nitrogen (Nsoil) into mi-crobial biomass and release CO2 to the atmosphere, mineralize soil organic matter (SOM) and nutrients, and thus control energy and material flows between trophic levels (Miltner et al., 2012; Sinsabaugh et al., 2013). Although soil microbial biomass carbon (Cmic) and nitrogen (Nmic) only account for 0.9–6.5 % of Csoil and 1.7–8.1 % of Nsoil,
5
respectively (Xu et al., 2013), microbial decomposition of SOM releases about half of the total soil CO2efflux (Wang and Yang, 2007). Microbes also provide supplementary nutrients for the plants especially in nutrient-limited ecosystems (Singh et al., 1989) because of the dichotomous seasonality between microbial biomass and soil nutrient availability (Kaiser et al., 2011). Therefore, understanding soil microbial metabolism
10
and its feedback to climate change is critical in carbon cycling studies (Davidson and Janssens, 2006; Singh et al., 2010) especially in forest ecosystems that contain more than 70 % of the global storage of Csoil(Jandl et al., 2007).
Recently, Xu et al. (2013) synthesized the global microbial biomass data of terres-trial ecosystems, of which only about 24 % were of forest ecosystems mainly from
15
North America and Europe. China has diverse geographic and environmental condi-tions, including a latitudinal gradient from boreal to tropical climate zones, a longitudinal gradient from arid desert to humid forest areas, and an altitudinal ladder-like topogra-phy from the east to the west, which allow various forests to exist (Fang et al., 2012; Yang et al., 2014). Research on the forest soil microbes in China had lagged behind
20
many regions in the world, but has been catching up rapidly since 2000. During the past 15 years, large amounts of data on microbial biomass have been produced but not synthesized to date. Synthetic analyses of these data are likely to shed light on the mechanism regulating soil microbial metabolism.
Soil resources saliently influence microbial growth (He et al., 2014; Jagadamma
25
indi-BGD
12, 11191–11216, 2015
Microbial carbon and nitrogen in China’s
forests
Z. Zhou and C. Wang
Title Page
Abstract Introduction
Conclusions References
Tables Figures
◭ ◮
◭ ◮
Back Close
Full Screen / Esc
Printer-friendly Version Interactive Discussion
Discussion
P
a
per
|
Discussion
P
a
per
|
Discussion
P
a
per
|
Discussion
P
a
per
|
cator of soil biological responses to environmental changes (Sparling, 1992). To date, however, it is not conclusive how soil resources control microbial metabolic processes. For example, Xu et al. (2014), using field data and modeling simulation, indicated that soil microbial quotient decreased exponentially with the Csoil: Nsoil ratio at a biome-level. On the other hand, Spohn (2015), based on laboratory incubation data, reported
5
microbial metabolic quotient (i.e., respiration rate per unit microbial biomass) linearly increased with the litter C : N ratio but decreased with the litter nitrogen concentration. Such diverse relationships between soil resources and microbial metabolism may be associated with environmantal conditions and research scales, because the transloca-tion of soil resources involves a series of biological activities and physical diffusion that
10
are constrained by soil temperature and moisture regimes especially in frozen or arid harsh environment or seasons (Jefferies et al., 2010; Edwards and Jefferies, 2013).
At a large scale, geographic climate is the primary driver of vegetation communities (Drenovsky et al., 2010). Vegetation controls Csoil inputs, alters soil habitats by modi-fying rhizospheric activities and elemental stoichiometry, and eventually influences
mi-15
crobial composition and metabolism (Paterson et al., 2007; Bell et al., 2014). Addition-ally, forest disturbances change soil and vegetation characteristics, which in turn alter microbial biochemical processes (Holden and Treseder, 2013). Of the diverse influenc-ing factors, it is not clear which are the major drivers of the variability in soil microbial biomass (Wardle, 1998; Xu et al., 2013).
20
In this study, we retrieved peer-reviewed papers on microbial biomass in China’s for-est ecosystems published during the past 15 years. The database included 689 mea-surements from 207 independent studies (Table S1, Supplement S1) that covered all the climate zones (frigid highland, cool temperate, warm temperate, subtropical/tropical zones) and management regimes (natural vs. planted forests; Fig. 1). The objectives
25
manage-BGD
12, 11191–11216, 2015
Microbial carbon and nitrogen in China’s
forests
Z. Zhou and C. Wang
Title Page
Abstract Introduction
Conclusions References
Tables Figures
◭ ◮
◭ ◮
Back Close
Full Screen / Esc
Printer-friendly Version Interactive Discussion
Discussion
P
a
per
|
Discussion
P
a
per
|
Discussion
P
a
per
|
Discussion
P
a
per
ment regimes because of different quality and quantity of soil resources and environ-mental conditions involved, and (2) the variability in Cmicand Nmicare jointly driven by soil resources and climate (a proxy of soil temperature and moisture regimes).
2 Methods
2.1 Data collection
5
We collected the data on soil microbial biomass of China’s forest ecosystems pub-lished from January 2000 to November 2014. The literature retrieval was conducted through the China National Knowledge Infrastructure (CNKI, http://www.cnki.net) and the Web of Science (http://apps.webofknowledge.com) online databases using “soil microbial” and “forest” as key words. To enhance the cross-study comparability, the
10
original papers were further screened by the following criteria: (1) The studies must contain corresponding Csoil or SOM and Nsoil data. The SOM values were converted into Csoil values using the Bemmelen index (0.58, Mann, 1986). (2) There were no an-thropogenic disturbances or management activities in recent years (>7 years). (3) We only included the measurements from the control or untreated plots if a manipulated
15
experiment was employed. And (4) we only adopted the data on Cmic and Nmic de-termined with the chloroform fumigation-extraction method, but ignored the conversion factors due to lacking detailed description in the original literature. Eventually, 689 mea-surements from 207 peer-reviewed papers met the criteria above and were included in this synthesis (Table S1, Supplement S1). The dataset covered the forest regions
20
across China, divergent in climate zones and management regimes (Fig. 1).
We also obtained corresponding data on the geographic locations (latitude, longi-tude), climate conditions (mean annual temperature (MAT), mean annual precipitation (MAP)), soil properties (bulk density), and vegetation characteristics (forest type, man-agement regime). Unlike previous syntheses (e.g., Tian et al., 2010) that averaged the
25
BGD
12, 11191–11216, 2015
Microbial carbon and nitrogen in China’s
forests
Z. Zhou and C. Wang
Title Page
Abstract Introduction
Conclusions References
Tables Figures
◭ ◮
◭ ◮
Back Close
Full Screen / Esc
Printer-friendly Version Interactive Discussion
Discussion
P
a
per
|
Discussion
P
a
per
|
Discussion
P
a
per
|
Discussion
P
a
per
|
study were calculated from the original literature and weighted by the numbers of mea-surements. This algorithm may more realistically reflect the environmental conditions driving the microbial metabolism, because microbial communities are more directly responsive to the local habitat, rather than the large-scaled environment. All data col-lected in this study were numerical data from the tables, text, or extracted from the
5
figures in the original papers with the Origin 7.0 digital plugin (Digitize) (OriginLab Ltd., China).
2.2 Data standardization and analyses
Considering the effects of climate, parent materials and vegetation, we standard-ized the dataset by implementing the following procedures. First, we, based on the
10
1 : 1 000 000 land-use map of China (Wu, 1988), categorized the dataset into five cli-mate zones, i.e., frigid highland (FH), cool temperate (CT), warm temperate (WT), temperate desert (TD), and subtropical/tropical (ST) zones. Since forests are rarely distributed in the TD zone, we excluded it in this synthesis (Fig. 1). Second, we further divided the forests within each climate zone into natural and planted forests by
man-15
agement regimes. Third, the soil data were all standardized to the top 20 cm depth in order to maximize the cross-study comparison. The rationales for doing this are: (1) Cmicand Nmicare concentrated on the top soil layers (0–20 cm) (Cleveland and Liptzin, 2007); and (2) direct comparisons with the raw data are problematic, because the in-dividual studies included in the current dataset applied different soil sampling methods
20
(e.g., by soil profile horizons or fixed-depth layers) and sampling depths. About 75 % of the studies were implicated in the top 20 cm of the soil (Fig. 1 Ins. 2). Therefore, we conducted the following procedures for the topsoil standardization: (1) In the cases that the 0–20 cm topsoil was divided into more than one sublayers, we obtained the bulk density (BD) weighted means of Csoil, Nsoil, Cmic, and Nmic across the 0–20 cm depth.
25
The BD, if missing in the original papers, was derived from an empirical relationship be-tween SOM and BD (i.e., BD=0.29+1.2033×exp (−0.0775×SOM); Wu et al., 2003;
BGD
12, 11191–11216, 2015
Microbial carbon and nitrogen in China’s
forests
Z. Zhou and C. Wang
Title Page
Abstract Introduction
Conclusions References
Tables Figures
◭ ◮
◭ ◮
Back Close
Full Screen / Esc
Printer-friendly Version Interactive Discussion
Discussion
P
a
per
|
Discussion
P
a
per
|
Discussion
P
a
per
|
Discussion
P
a
per
20 cm, we estimated the Csoil, Nsoil, Cmic, and Nmic across the 0–20 cm depth with the empirical equations (Csoil:y =1−0.878x,R2=0.95, P <0.001; Nsoil:y =1−0.893x, R2=0.95,P <0.001; Cmic:y=1−0.889x,R2=0.97,P <0.001; Nmic:y=1−0.869x,
R2=0.97, P <0.001, wherex is the soil depth (cm), andy is the cumulative fraction of the dependent variable. See details in Fig. S1). (3) In the cases that the seasonal
5
dynamics in microbial biomass were reported, we calculated the arithmetic means of the data.
An ANOVA procedure was performed to test the differences in all variables among climate zones and between management regimes. A multiple regression procedure was employed to examine the effects of soil resources and climate on Cmic, Nmic, Cmic:
10
Nmic ratio, and microbial quotient. A full model (including the independent variables of both soil resources and climate and possible interactions) and a reduced model (only including the independent variables of soil resources and possible interactions) for each dependent variable were developed to examine partial contributions of soil resources or climate to the variability. A backward elimination procedure was conducted to remove
15
insignificant terms (α=0.05) in the models. The variables, if needed, were transformed with a 10-based logarithm to meet the assumptions of normality and homoscedasticity for the regressions.
To examine the effect of soil quality on Cmic, we subjectively divided the original dataset into two groups by the median of the Csoil: Nsoil ratio, and defined as
high-20
quality group (Csoil: Nsoilratio≤the median,n=251) and low-quality group (Csoil: Nsoil ratio>the median,n=250). Then we applied the standardized major axis (SMA) pro-cedure to compare the Cmic–Csoil or Cmic–Nsoil relationship between the two groups. The SMA procedure was also used to compare the Cmic: Nmic–Csoil: Nsoil relationship between this study and the one derived from the global dataset (Cleveland and Liptzin,
25
BGD
12, 11191–11216, 2015
Microbial carbon and nitrogen in China’s
forests
Z. Zhou and C. Wang
Title Page
Abstract Introduction
Conclusions References
Tables Figures
◭ ◮
◭ ◮
Back Close
Full Screen / Esc
Printer-friendly Version Interactive Discussion
Discussion
P
a
per
|
Discussion
P
a
per
|
Discussion
P
a
per
|
Discussion
P
a
per
|
3 Results
3.1 Concentrations of soil microbial biomass carbon and nitrogen
The Cmicin the topsoil (0–20 cm) varied by 142 folds (mean±SD: 390.2±312.9 g kg−1)
with a coefficient of variation (CV) of 80.2 % across China’s forest ecosystems; and the Nmic varied by 289 folds (60.1±57.4 g kg−1) with a CV of 95.6 %. The Csoil varied by
5
72 folds (26.2±21.9 g kg−1) with a CV of 83.8 %; the Nsoil varied by 62 folds (2.06±
1.65 g kg−1) with a CV of 80.1 %.
Cmic and Nmic differed significantly between management regimes and among cli-mate zones (Fig. 2). In the natural forests, the Cmicand Nmicdisplayed similar patterns across the climate zones: ST>FH>CT>WT (Fig. 2e and g). The ST zone had the
10
greatest Cmic and Nmic with the greatest MAT and MAP (Fig. 1 Ins. 1) in spite of the least Csoil and Nsoil among the climate zones (Fig. 2a and b). The Csoil significantly (P <0.05) decreased from cold humid FH zone to warm humid ST zone, the former was one fold greater than the latter (Fig. 2a). This pattern was largely opposite to that of MAT (Fig. 1 Ins. 1). There was no significant difference in Nsoil (P =0.673) among
15
the climate zones (2.83±1.85 g kg−1; Fig. 2b).
The planted forests had significantly lower concentrations of Csoil, Nsoil, Cmic, and Nmic than the natural forests (P <0.05); the latter had 2.2, 2.0, 1.8, and 2.1 times as much as the former, respectively (Fig. 2 Ins.). Unlike the natural forests, the planted forests exhibited relatively consistent patterns of Csoil, Nsoil, Cmic, and Nmicacross the
20
climate zones: FH>CT>WT or ST (Fig. 2b, d, f, and h).
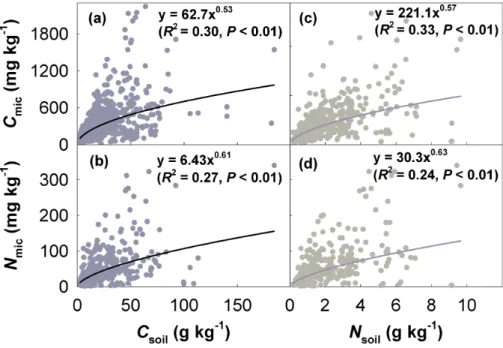
Csoil, Nsoil, and their interactions explained 36.6 % of the variability in Cmic, and 28.7 % in Nmic; MAT and MAP explained additional 2.6 and 12.0 %, respectively (Ta-ble 1). Both Cmic and Nmic were increasing in a power function with Csoil or Nsoil (Fig. 3). Further SMA analysis showed that the high-quality (i.e., low Csoil: Nsoil ratio)
25
BGD
12, 11191–11216, 2015
Microbial carbon and nitrogen in China’s
forests
Z. Zhou and C. Wang
Title Page
Abstract Introduction
Conclusions References
Tables Figures
◭ ◮
◭ ◮
Back Close
Full Screen / Esc
Printer-friendly Version Interactive Discussion
Discussion
P
a
per
|
Discussion
P
a
per
|
Discussion
P
a
per
|
Discussion
P
a
per
high-quality group had a significantly greater intercept (P <0.001) than the low-quality group for the log(Csoil)–log(Cmic) relationship (Fig. 4a), while the former had a signifi-cantly less intercept (P <0.001) than the latter for the log(Nsoil)–log(Cmic) relationship (Fig. 4b).
3.2 Stoichiometry of soil microbial biomass carbon and nitrogen
5
The Csoil: Nsoil and Cmic: Nmic ratios varied by 15 folds (13.7±6.63, CV=48.4 %)
and 41 folds (8.25±6.20, CV=75.1 %) across the country, respectively. Manage-ment regime and climate zone significantly affected the Cmic: Nmic ratio (Fig. 5). The Cmic: Nmic ratio in the natural forests was significantly less (P <0.05) than that in the planted forests (Fig. 5d Ins.), while the Csoil: Nsoil ratio in the former was significantly
10
greater (P <0.05) than that in the latter (Fig. 5b Ins.). The Cmic: Nmic ratio showed a similar pattern across the climate zones for both natural and planted forests, with the greatest ratio occurring in the CT zone and the least ratio in the FH zone (Fig. 5c and d).
Pooling the data across the climate zones and management regimes, we found a
sig-15
nificant power relationship, rather than a linear, between Csoil and Nsoil or between Cmic and Nmic (P <0.001; Fig. S2). The Csoil and Nsoil together explained 10.8 % of the variability in the Cmic: Nmic ratio, and climate explained another 13.6 % (Table 1). There was a weak negative correlation between Cmic: Nmic ratio and Csoil: Nsoil ratio (n=335, P =0.002, R2=0.04; Fig. 6a), which was consistent with the relationship
20
derived from the global dataset (Cleveland and Liptzin, 2007). The slope of the rela-tionship was −0.13 [−0.21, −0.05] (mean [95 % confidence interval]) from this study and−0.12 [−0.23,−0.01] from the global dataset, while the intercept was 9.73 [8.45,
11.06] and 9.34 [7.86, 10.82], respectively. The Cmic: Nmicratio increased with latitude (Fig. 6b), decreased with MAT (Fig. 6c), and was correlated with MAP in a quadratic
25
BGD
12, 11191–11216, 2015
Microbial carbon and nitrogen in China’s
forests
Z. Zhou and C. Wang
Title Page
Abstract Introduction
Conclusions References
Tables Figures
◭ ◮
◭ ◮
Back Close
Full Screen / Esc
Printer-friendly Version Interactive Discussion
Discussion
P
a
per
|
Discussion
P
a
per
|
Discussion
P
a
per
|
Discussion
P
a
per
|
3.3 Soil microbial quotient
The Cmic/Csoilrate varied by 91 folds (1.92±1.17 %, CV=61.2 %), while the Nmic/Nsoil
rate varied by 480 folds (3.43±2.49 %, CV=72.5 %). They differed significantly be-tween management regimes and among climate zones (Fig. 5). The Cmic/Csoil rate in the natural forests was significantly (P <0.05) less than that in the planted forests
5
(Fig. 5f Ins.), while the Nmic/Nsoil rate did not differ (P >0.05; Fig. 5h Ins.). The Cmic/Csoiland Nmic/Nsoil rates showed different patterns across the climate zones be-tween the natural and planted forests (Fig. 5e–h). In the natural forests, the FH zone had the least Cmic/Csoil rate but the greatest Nmic/Nsoil rate among the climate zones; the ST zone had greater Cmic/Csoiland Nmic/Nsoil rates (Fig. 5e and g). In the planted
10
forests, the Cmic/Csoil and Nmic/Nsoil rates showed similar patterns across the climate zones: WT>ST>FH>CT (Fig. 5f and h).
Csoil, Nsoil, and their combinations explained 36.7 % of the variability in the Cmic/Csoil rate, and 17.3 % in the Nmic/Nsoil rate; MAT, MAP, and their interactions explained an-other 2.4 and 13.3 %, respectively (Table 1). The Cmic/Csoilrate decreased in a power
15
function with the Csoil: Nsoilratio (Fig. 7a), but the Nmic/Nsoilrate increased linearly with the Csoil: Nsoilratio (Fig. 7b). Both Cmic/Csoil and Nmic/Nsoil rates increased with MAT (Fig. 7c and d). There was a quadratic polynomial function between the Cmic/Csoilrate and MAP (Fig. 7e), but there was no significant relationship (P >0.05) between the Nmic/Nsoilrate and MAP (Fig. 7f).
20
4 Discussion
4.1 Variability in forest soil microbial biomass carbon and nitrogen
The Cmicand Nmicin China’s forest ecosystems varied substantially with climate zones and management regimes (CV up to 80–96 %), but the variability is less than previous large-scale synthesis (e.g., Xu et al., 2013), partly because of the difference in data
BGD
12, 11191–11216, 2015
Microbial carbon and nitrogen in China’s
forests
Z. Zhou and C. Wang
Title Page
Abstract Introduction
Conclusions References
Tables Figures
◭ ◮
◭ ◮
Back Close
Full Screen / Esc
Printer-friendly Version Interactive Discussion
Discussion
P
a
per
|
Discussion
P
a
per
|
Discussion
P
a
per
|
Discussion
P
a
per
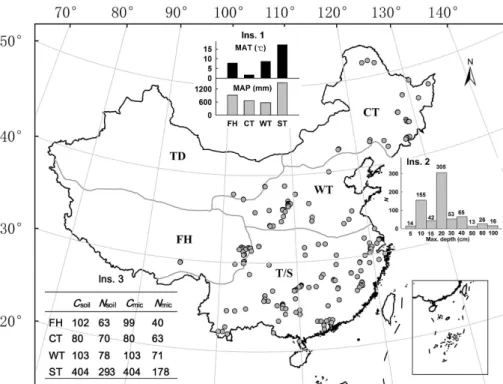
lection and standardization procedures (see Methods). In this study, for example, the data with maximum sampling depth less than 15 and 20 cm accounted for 30 and 75 % of the whole dataset, respectively (Fig. 1 Ins. 2). If we had applied the same procedure as Cleveland and Liptzin (2007) or Xu et al. (2013) without the soil-depth standard-ization (see Methods), then we would overestimate the Csoil: Nsoil ratio by 2.8 % and
5
underestimate the Cmic: Nmic ratio by 5.2 %. These pieces of evidence underpin the necessity of appropriate procedures for data compilation and standardization in such cross-study syntheses that should take soil depth, forest characteristics, and distur-bance regimes into account.
Forest disturbances contain various regimes and histories, and thus increase the
10
complexity of the microbial biomass pattern associated with climate (Holden and Treseder, 2013). In this synthesis, the natural forests in the subtropical/tropical zones with the greatest MAT and MAP (Fig. 1 Ins. 1) had the greatest Cmicand Nmicamong the climate zones (Fig. 2), while the planted counterparts had the least Cmic and Nmic (Fig. 2f and h). Similarly, the planted forests in both warm and cool temperate zones
15
had lower Cmicand Nmic than those in the frigid highland zone. The reason for these different patterns between the natural and planted forests is probably associated with more afforestation and younger plantations in regions other than the frigid highland zone in China (Fang et al., 2012; Yang et al., 2014).
In this study, soil resources and climate together explained about 40 % of the
vari-20
ability in microbial biomass, to which Csoil and Nsoil contributed 71–93 % (Table 1). All power functions of microbial biomass against soil resources had exponents of less than one (Fig. 3), indicating that microbes grow rapidly with soil resource availability increas-ing when the Csoilor Nsoil is low, but the acceleration decreases as the Csoil or Nsoil in-creases. This implies a shift in constraints of microbial growth from resource availability
25
BGD
12, 11191–11216, 2015
Microbial carbon and nitrogen in China’s
forests
Z. Zhou and C. Wang
Title Page
Abstract Introduction
Conclusions References
Tables Figures
◭ ◮
◭ ◮
Back Close
Full Screen / Esc
Printer-friendly Version Interactive Discussion
Discussion
P
a
per
|
Discussion
P
a
per
|
Discussion
P
a
per
|
Discussion
P
a
per
|
grow faster in the soils with a lower Csoil: Nsoil ratio at a specific Csoil level or in the carbon-richer soils at a specific Nsoil level. These findings illustrate that effects of soil resources on Cmic and Nmicchange with the availability and stoichiometry of Csoil and Nsoil.
4.2 Stoichiometry of forest soil microbial biomass carbon and nitrogen
5
The Cmic: Nmic ratio in the topsoil for the natural forests in this study (7.3) is slightly greater than the global mean (6.9; Cleveland and Liptzin, 2007; Xu et al., 2013). It varied substantially less than Cmic(41 folds vs. 142 folds) or Nmic(289 folds) (Fig. 5). The relatively little variability in the Cmic: Nmicratio, together with its slight decline with the Csoil: Nsoil ratio (Fig. 6a), illustrates that soil microbes alleviate soil resource
stoi-10
chiometry (Kaiser et al., 2014), rather than “you are what you eat” (Sterner and Elser, 2002).
Nevertheless, the Cmic: Nmic ratio decreased by 13 % as the Csoil: Nsoil ratio in-creased (Fig. 6a), consistent with other terrestrial ecosystems studies (e.g., Cleveland and Liptzin, 2007; Fanin et al., 2013). And it also changed with latitude (Fig. 6b) and
15
climate (Fig. 6c and d). These results indicate that the microbial carbon-nitrogen sto-ichiometry is plastic homeostatic and regulated by soil resources and environmental conditions (Fig. 6; Sterner and Elser, 2002; Li et al., 2012). It also raises caution re-garding taking the Csoil: Nsoil ratio as a proxy of resource quality in exploring the effect of soil resource availability on microbial assimilation of carbon.
20
Our data also showed that the Cmic: Nmicratio was predictable to some degree (Ta-ble 1). The multiple regression model that included soil resources and climate did ex-plain 24.4 % of the variability in the Cmic: Nmicratio. This might be useful for modeling the biogeochemical cycle of forest ecosystems, but no conclusive notion has been reached on the underlying mechanisms of such environmental plasticity of microbial
25
BGD
12, 11191–11216, 2015
Microbial carbon and nitrogen in China’s
forests
Z. Zhou and C. Wang
Title Page
Abstract Introduction
Conclusions References
Tables Figures
◭ ◮
◭ ◮
Back Close
Full Screen / Esc
Printer-friendly Version Interactive Discussion
Discussion
P
a
per
|
Discussion
P
a
per
|
Discussion
P
a
per
|
Discussion
P
a
per
cell wall) as a defensive strategy in harsh environments. Additionally, environmental changes may shift microbial community composition, and thus change the Cmic: Nmic ratio (Drenovsky et al., 2010; Tischer et al., 2014) because fungi have higher C : N ratio than bacteria (Keiblinger et al., 2010). Clearly, disclosing the underlying mechanisms of microbial metabolism is challenging but critically needed.
5
4.3 Forest soil microbial quotient
Soil microbial quotient is largely determined by microbial assimilation and respiration that are mainly affected by soil substrates and environment (Manzoni et al., 2012). In this study, we found that Cmic/Csoiland Nmic/Nsoilrates responded to soil resources dif-ferently or even oppositely. First, soil resources explained 36.7 % of the variability in the
10
Cmic/Csoilbut only 17.3 % in the Nmic/Nsoil(Table 1), indicating that the Cmic/Csoilrate was more controlled by soil resources. Second, the Cmic/Csoiland Nmic/Nsoilrates re-sponded oppositely to the Csoil: Nsoilratio, i.e., decreasing in a power function (Fig. 7a) vs. increasing linearly (Fig. 7b). Third, much stronger interactions between MAT and MAP exerted on the Nmic/Nsoilrate than the Cmic/Csoilrate (Table 1), because weak or
15
no correlations between the Nmic/Nsoilrate and MAT (Fig. 7d) or MAP (Fig. 7f) despite that climate factors explained 4.5 times more variability in the Nmic/Nsoilrate than in the Cmic/Csoilrate (13.3 % vs. 2.4 %; Table 1). These results, together with Fig. 4 (See the discussion above), suggests that soil microbial assimilation of carbon and nitrogen are responsive to soil resources and climate differently, and might be regulated by different
20
mechanisms.
Vegetation and disturbances modify soil resources, interact with climate, and even-tually affect microbial growth and metabolism (Figs. 5 and 7). The rapid decrease in Cmic/Csoilrate with Csoil: Nsoilincreasing (Fig. 7a) suggests that soil microbes produce less biomass and respire more carbon in N-limited soils (Xu et al., 2014). The
under-25
BGD
12, 11191–11216, 2015
Microbial carbon and nitrogen in China’s
forests
Z. Zhou and C. Wang
Title Page
Abstract Introduction
Conclusions References
Tables Figures
◭ ◮
◭ ◮
Back Close
Full Screen / Esc
Printer-friendly Version Interactive Discussion
Discussion
P
a
per
|
Discussion
P
a
per
|
Discussion
P
a
per
|
Discussion
P
a
per
|
to changes in Csoil: Nsoil ratio, may evolve to a new balance between species-specific resource demand and resources availability in the micro-habitat via inter-specific com-petition and shifting of specific extracellular enzymes stoichiometry, and eventually alter the resource use efficiency at the community level (Tilman, 1982; Cherif and Loreau, 2007; Kaiser et al., 2014; Mooshammer et al., 2014; Torres et al., 2014).
5
5 Conclusions
By synthesizing 689 measurements from 207 independent studies across China’s for-est ecosystems, we find large variations in soil microbial biomass carbon and nitrogen and microbial quotient that are subjected to changes in soil resources and climate. Soil microbial assimilation of carbon and nitrogen are responsive to soil resources
10
and climate differently, and might be regulated by different mechanisms. Identifying these interacting factors improves our understanding of the underlying mechanisms of microbial metabolism, and is useful for modeling the biogeochemical cycle of forest ecosystems.
The Supplement related to this article is available online at
15
doi:10.5194/bgd-12-11191-2015-supplement.
Acknowledgements. We thank all the researchers whose data were used in this study and Dr. Anja Rammig and two anonymous reviewers for their valuable comments. This work was financially supported by the National Key Technology Research and Development Program of the Ministry of Science and Technology of China (No. 2011BAD37B01), the Program for
20
BGD
12, 11191–11216, 2015
Microbial carbon and nitrogen in China’s
forests
Z. Zhou and C. Wang
Title Page
Abstract Introduction
Conclusions References
Tables Figures
◭ ◮
◭ ◮
Back Close
Full Screen / Esc
Printer-friendly Version Interactive Discussion
Discussion
P
a
per
|
Discussion
P
a
per
|
Discussion
P
a
per
|
Discussion
P
a
per
References
Asner, G. P., Martin, R. E., Tupayachi, R., Anderson, C. B., Sinca, F., Carranza-Jiménez, L., and Martinez, P.: Amazonian functional diversity from forest canopy chemical assembly, P. Natl. Acad. Sci. USA, 111, 5604–5609, 2014.
Bell, C., Carrillo, Y., Boot, C. M., Rocca, J. D., Pendall, E., and Wallenstein, M. D.:
Rhizo-5
sphere stoichiometry: are C : N : P ratios of plants, soils, and enzymes conserved at the plant species level?, New Phytol., 201, 505–517, 2014.
Chapin III, F. S., Matson, P. A., and Vitousek, P. M.: Principles of Terrestrial Ecosystem Ecology, 2nd Edn., Springer, New York, 2011.
Cherif, M. and Loreau, M.: Stoichiometric constraints on resource use, competitive interactions,
10
and elemental cycling in microbial decomposers, Am. Nat., 169, 709–724, 2007.
Cleveland, C. C. and Liptzin, D.: C : N : P stoichiometry in soil: is there a “Redfield ratio” for the microbial biomass?, Biogeochemistry, 85, 235–252, 2007.
Davidson, E. A. and Janssens, I. A.: Temperature sensitivity of soil carbon decomposition and feedbacks to climate change, Nature, 440, 165–173, 2006.
15
Drenovsky, R. E., Steenwerth, K. L., Jackson, L. E., and Scow, K. M.: Land use and climatic factors structure regional patterns in soil microbial communities, Global Ecol. Biogeogr., 19, 27–39, 2010.
Edwards, K. A. and Jefferies, R. L.: Inter-annual and seasonal dynamics of soil microbial biomass and nutrients in wet and dry low-Arctic sedge meadows, Soil Biol. Biochem., 57,
20
83–90, 2013.
Fang, J. Y., Shen, Z. H., Tang, Z. Y., Wang, X. P., Wang, Z. H., Feng, J. M., Liu, Y. N., Qiao, X. J., Wu, X. P., and Zheng, C. Y.: Forest community survey and the structural characteristics of forests in China, Ecography, 35, 1059–1071, 2012.
Fanin, N., Fromin, N., Buatois, B., and Hättenschwiler, S.: An experimental test of the
hypothe-25
sis of non-homeostatic consumer stoichiometry in a plant litter–microbe system, Ecol. Lett., 16, 764–772, 2013.
He, J. S., Fang, J. Y., Wang, Z. H., Guo, D. L., Flynn, D. F. B., and Geng, Z.: Stoichiometry and large-scale patterns of leaf carbon and nitrogen in the grassland biomes of China, Oecologia, 149, 115–122, 2006.
30
BGD
12, 11191–11216, 2015
Microbial carbon and nitrogen in China’s
forests
Z. Zhou and C. Wang
Title Page
Abstract Introduction
Conclusions References
Tables Figures
◭ ◮
◭ ◮
Back Close
Full Screen / Esc
Printer-friendly Version Interactive Discussion
Discussion
P
a
per
|
Discussion
P
a
per
|
Discussion
P
a
per
|
Discussion
P
a
per
|
soil horizon types of boreal forest ecosystems: a mechanistically based model analysis, Bio-geosciences, 11, 4477–4491, doi:10.5194/bg-11-4477-2014, 2014.
Holden, S. R. and Treseder, K. K.: A meta-analysis of soil microbial biomass responses to forest disturbances, Front. Microbiol., 4, 163, doi:10.3389/fmicb.2013.00163, 2013.
Jagadamma, S., Mayes, M. A., Steinweg, J. M., and Schaeffer, S. M.: Substrate quality alters
5
the microbial mineralization of added substrate and soil organic carbon, Biogeosciences, 11, 4665–4678, doi:10.5194/bg-11-4665-2014, 2014.
Jandl, R., Lindner, M., Vesterdal, L., Bauwens, B., Baritz, R., Hagedorn, F., Johnson, D. W., Minkkinen, K., and Byrne, K. A.: How strongly can forest management influence soil carbon sequestration?, Geoderma, 137, 253–268, 2007.
10
Jefferies, R. L., Walker, N. A., Edwards, K. A., and Dainty, J.: Is the decline of soil microbial biomass in late winter coupled to changes in the physical state of cold soils?, Soil Biol. Biochem., 42, 129–135, 2010.
Kaiser, C., Franklin, O., Dieckmann, U., and Richter, A.: Microbial community dynamics alleviate stoichiometric constraints during litter decay, Ecol. Lett., 17, 680–690, 2014.
15
Kaiser, C., Fuchslueger, L., Koranda, M., Gorfer, M., Stange, C. F., Kitzler, B., Rasche, F., Strauss, J., Sessitsch, A., and Zechmeister-Boltenstern, S.: Plants control the seasonal dy-namics of microbial N cycling in a beech forest soil by belowground C allocation, Ecology, 92, 1036–1051, 2011.
Keiblinger, K. M., Hall, E. K., Wanek, W., Szukics, U., Hämmerle, I., Ellersdorfer, G., Böck, S.,
20
Strauss, J., Sterflinger, K., and Richter, A.: The effect of resource quantity and resource stoichiometry on microbial carbon-use-efficiency, FEMS Microbiol. Ecol., 73, 430–440, 2010. Li, Y., Wu, J. S., Liu, S. L., Shen, J. L., Huang, D. Y., Su, Y. R., Wei, W. X., and Syers, J. K.:
Is the C : N : P stoichiometry in soil and soil microbial biomass related to the landscape and land use in southern subtropical China?, Global. Biogeochem. Cy. 26, GB4002,
25
doi:10.1029/2012GB004399, 2012.
Mann, L. K.: Changes in soil carbon storage after cultivation, Soil Sci., 142, 279–288, 1986. Manzoni, S., Taylor, P., Richter, A., Porporato, A., and Ågren, G. I.: Environmental and
stoichio-metric controls on microbial carbon-use efficiency in soils, New Phytol., 196, 79–91, 2012. Miltner, A., Bombach, P., Schmidt-Brücken, B., and Kästner, M.: SOM genesis: microbial
30
biomass as a significant source, Biogeochemistry, 111, 41–55, 2012.
mecha-BGD
12, 11191–11216, 2015
Microbial carbon and nitrogen in China’s
forests
Z. Zhou and C. Wang
Title Page
Abstract Introduction
Conclusions References
Tables Figures
◭ ◮
◭ ◮
Back Close
Full Screen / Esc
Printer-friendly Version Interactive Discussion
Discussion
P
a
per
|
Discussion
P
a
per
|
Discussion
P
a
per
|
Discussion
P
a
per
nisms and implications of microbial adaptations to their resources, Front. Microbiol., 5, 22, doi:10.3389/fmicb.2014.00022, 2014.
Paterson, E., Gebbing, T., Abel, C., Sim, A., and Telfer, G.: Rhizodeposition shapes rhizosphere microbial community structure in organic soil, New Phytol., 173, 600–610, 2007.
Serna-Chavez, H. M., Fierer, N., and Bodegom, P. M.: Global drivers and patterns of microbial
5
abundance in soil, Global Ecol. Biogeogr., 22, 1162–1172, 2013.
Singh, B. K., Bardgett, R. D., Smith, P., and Reay, D. S.: Microorganisms and climate change: terrestrial feedbacks and mitigation options, Nat. Rev. Microbiol., 8, 779–790, 2010.
Singh, J. S., Raghubanshi, A. S., Singh, R. S., and Srivastava, S. C.: Microbial biomass acts as a source of plant nutrients in dry tropical forest and savanna, Nature, 338, 499–500, 1989.
10
Sinsabaugh, R. L., Manzoni, S., Moorhead, D. L., and Richter, A.: Carbon use efficiency of microbial communities: stoichiometry, methodology and modelling, Ecol. Lett., 16, 930–939, 2013.
Sparling, G. P.: Ratio of microbial biomass carbon to soil organic carbon as a sensitive indicator of changes in soil organic matter, Soil Res., 30, 195–207, 1992.
15
Spohn, M.: Microbial respiration per unit microbial biomass depends on litter layer carbon-to-nitrogen ratio, Biogeosciences, 12, 817–823, doi:10.5194/bg-12-817-2015, 2015.
Sterner, R. W. and Elser, J. J.: Ecological Stoichiometry: the Biology of Elements from Molecules to the Biosphere, Princeton University Press, Princeton, 2002.
Tian, H. Q., Chen, G. S., Zhang, C., Melillo, J. M., and Hall, C. A. S.: Pattern and variation
20
of C : N : P ratios in China’s soils: a synthesis of observational data, Biogeochemistry, 98, 139–151, 2010.
Tilman, D.: Resource Competition and Community Structure, monographs, Princeton University Press, Princeton, 1982.
Tischer, A., Potthast, K., and Hamer, U.: Land-use and soil depth affect resource and microbial
25
stoichiometry in a tropical mountain rainforest region of southern Ecuador, Oecologia, 175, 375–393, 2014.
Torres, I. F., Bastida, F., Hernández, T., Bombach, P., Richnow, H. H., and García, C.: The role of lignin and cellulose in the carbon-cycling of degraded soils under semiarid climate and their relation to microbial biomass, Soil Biol. Biochem., 75, 152–160, 2014.
30
BGD
12, 11191–11216, 2015
Microbial carbon and nitrogen in China’s
forests
Z. Zhou and C. Wang
Title Page
Abstract Introduction
Conclusions References
Tables Figures
◭ ◮
◭ ◮
Back Close
Full Screen / Esc
Printer-friendly Version Interactive Discussion
Discussion
P
a
per
|
Discussion
P
a
per
|
Discussion
P
a
per
|
Discussion
P
a
per
|
Wardle, D. A.: A comparative assessment of factors which influence microbial biomass carbon and nitrogen levels in soil, Biol. Rev., 67, 321–358, 1992.
Wardle, D. A.: Controls of temporal variability in the soil microbial biomass: a global-scale syn-thesis, Soil Biol. Biochem., 30, 1627–1637, 1998.
Wu, C.: 1 : 1 000 000 Land Use Map of China, Science Press, Beijing, China, 1998.
5
Wu, H. B., Guo, Z. T., and Peng, C. H.: Distribution and storage of soil organic carbon in China, Global Biogeochem. Cy., 17, doi:10.1029/2001GB001844, 2003.
Xu, X. F., Thornton, P. E., and Post, W. M.: A global analysis of soil microbial biomass carbon, nitrogen and phosphorus in terrestrial ecosystems, Global Ecol. Biogeogr., 22, 737–749, 2013.
10
Xu, X. F., Schimel, J. P., Thornton, P. E., Song, X., Yuan, F. M., and Goswami, S.: Substrate and environmental controls on microbial assimilation of soil organic carbon: a framework for Earth system models, Ecol. Lett., 17, 547–555, 2014.
Yang, Y. H., Mohammat, A., Feng, J. M., Zhou, R., and Fang, J. Y.: Storage, patterns and environmental controls of soil organic carbon in China, Biogeochemistry, 84, 131–141, 2007.
15
BGD
12, 11191–11216, 2015
Microbial carbon and nitrogen in China’s
forests
Z. Zhou and C. Wang
Title Page Abstract Introduction Conclusions References Tables Figures ◭ ◮ ◭ ◮ Back Close
Full Screen / Esc
Printer-friendly Version Interactive Discussion Discussion P a per | Discussion P a per | Discussion P a per | Discussion P a per
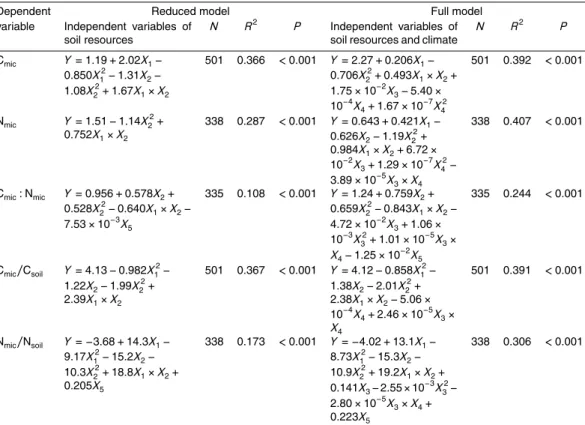
Table 1.Multiple regression models of microbial biomass carbon (Cmic), microbial biomass
nitrogen (Nmic), Cmic: Nmic ratio, and microbial quotients (i.e., Cmic/Csoil and Nmic/Nsoil rates)
against soil resources and climate. Csoil and Nsoil stand for soil organic carbon and soil total nitrogen, respectively.Y, X1, X2, X3, X4, andX5 in the models stand for the dependent
vari-able, Csoil, Nsoil, mean annual temperature, mean annual precipitation, and Csoil: Nsoil ratio,
respectively.Y,X1andX2 are 10-based log transformed.N,R2, andP stand for sample size, determination coefficient, and probability, respectively. All the terms in the regression models are significant atα=0.05.
Dependent Reduced model Full model
variable Independent variables of soil resources
N R2 P Independent variables of soil resources and climate
N R2 P
Cmic Y=1.19+2.02X1−
0.850X12−1.31X2−
1.08X22+1.67X1×X2
501 0.366 <0.001 Y=2.27+0.206X1−
0.706X22+0.493X1×X2+
1.75×10−2X 3−5.40×
10−4X
4+1.67×10
−7X2 4
501 0.392 <0.001
Nmic Y=1.51−1.14X22+
0.752X1×X2
338 0.287 <0.001 Y=0.643+0.421X1−
0.626X2−1.19X22+
0.984X1×X2+6.72×
10−2X
3+1.29×10
−7X2 4−
3.89×10−5X 3×X4
338 0.407 <0.001
Cmic: Nmic Y=0.956+0.578X2+
0.528X22−0.640X1×X2−
7.53×10−3X 5
335 0.108 <0.001 Y=1.24+0.759X2+
0.659X22−0.843X1×X2−
4.72×10−2X 3+1.06×
10−3X2
3+1.01×10
−5X 3×
X4−1.25×10
−2X 5
335 0.244 <0.001
Cmic/Csoil Y=4.13−0.982X12−
1.22X2−1.99X2 2+
2.39X1×X2
501 0.367 <0.001 Y=4.12−0.858X12−
1.38X2−2.01X2 2+
2.38X1×X2−5.06×
10−4X
4+2.46×10
−5X 3×
X4
501 0.391 <0.001
Nmic/Nsoil Y=−3.68+14.3X1−
9.17X12−15.2X2−
10.3X22+18.8X1×X2+
0.205X5
338 0.173 <0.001 Y=−4.02+13.1X1−
8.73X12−15.3X2−
10.9X22+19.2X1×X2+
0.141X3−2.55×10−3X2 3−
2.80×10−5X 3×X4+
0.223X5
BGD
12, 11191–11216, 2015
Microbial carbon and nitrogen in China’s
forests
Z. Zhou and C. Wang
Title Page
Abstract Introduction
Conclusions References
Tables Figures
◭ ◮
◭ ◮
Back Close
Full Screen / Esc
Printer-friendly Version Interactive Discussion
Discussion
P
a
per
|
Discussion
P
a
per
|
Discussion
P
a
per
|
Discussion
P
a
per
|
Figure 1.A map of China showing the distribution of sampling sites and data summary for this synthesis. The climate zones are categorized followed Wu (1988) into frigid highland (FH), cool temperate (CT), warm temperate (WT), subtropical/tropical (ST), and temperate desert (TD) zones. The TD is excluded in the synthesis because forests are rarely distributed in the zone.
Ins. 1:Mean annual temperature (MAT) and mean annual precipitation (MAP) by climate zones.
Ins. 2:Number of studies (N) of the maximum depth of soil sampling.Ins. 3:The number of measurements of soil organic carbon (Csoil), soil total nitrogen (Nsoil), microbial biomass carbon
BGD
12, 11191–11216, 2015
Microbial carbon and nitrogen in China’s
forests
Z. Zhou and C. Wang
Title Page
Abstract Introduction
Conclusions References
Tables Figures
◭ ◮
◭ ◮
Back Close
Full Screen / Esc
Printer-friendly Version Interactive Discussion
Discussion
P
a
per
|
Discussion
P
a
per
|
Discussion
P
a
per
|
Discussion
P
a
per
Figure 2.Comparison of Csoil (a and b), Nsoil (c and d), Cmic (e andf), and Nmic (gand h)
BGD
12, 11191–11216, 2015
Microbial carbon and nitrogen in China’s
forests
Z. Zhou and C. Wang
Title Page
Abstract Introduction
Conclusions References
Tables Figures
◭ ◮
◭ ◮
Back Close
Full Screen / Esc
Printer-friendly Version Interactive Discussion
Discussion
P
a
per
|
Discussion
P
a
per
|
Discussion
P
a
per
|
Discussion
P
a
per
|
Figure 3.Relationships between soil resources and microbial biomass. Csoil, Nsoil, Cmic, and
Nmic stand for soil organic carbon, soil total nitrogen, microbial biomass carbon, and microbial
BGD
12, 11191–11216, 2015
Microbial carbon and nitrogen in China’s
forests
Z. Zhou and C. Wang
Title Page
Abstract Introduction
Conclusions References
Tables Figures
◭ ◮
◭ ◮
Back Close
Full Screen / Esc
Printer-friendly Version Interactive Discussion
Discussion
P
a
per
|
Discussion
P
a
per
|
Discussion
P
a
per
|
Discussion
P
a
per
Figure 4.Relationships between microbial biomass carbon (Cmic) and soil organic carbon (Csoil,
a), and soil total nitrogen (Nsoil,b) by two soil quality groups: High-quality group (Csoil: Nsoil
ra-tio≤the median of the whole dataset, n=251) vs. Low-quality group (Csoil: Nsoil ratio>the
BGD
12, 11191–11216, 2015
Microbial carbon and nitrogen in China’s
forests
Z. Zhou and C. Wang
Title Page
Abstract Introduction
Conclusions References
Tables Figures
◭ ◮
◭ ◮
Back Close
Full Screen / Esc
Printer-friendly Version Interactive Discussion
Discussion
P
a
per
|
Discussion
P
a
per
|
Discussion
P
a
per
|
Discussion
P
a
per
|
Figure 5.Comparison of Csoil: Nsoilratio (aandb), Cmic: Nmicratio (candd), Cmic/Csoilrate (e
andf), and Nmic/Nsoilrate (gandh) among climate zones and between management regimes.
Inserted figures are overall comparisons between the natural (NF) and planted forests (PF). Csoil, Nsoil, Cmic, and Nmicstand for soil organic carbon, soil total nitrogen, microbial biomass
BGD
12, 11191–11216, 2015
Microbial carbon and nitrogen in China’s
forests
Z. Zhou and C. Wang
Title Page
Abstract Introduction
Conclusions References
Tables Figures
◭ ◮
◭ ◮
Back Close
Full Screen / Esc
Printer-friendly Version Interactive Discussion
Discussion
P
a
per
|
Discussion
P
a
per
|
Discussion
P
a
per
|
Discussion
P
a
per
Figure 6.Relationships between Cmic: Nmic and Csoil: Nsoil ratios (China: from this study vs.
Globe: from Cleveland and Liptzin, 2007) (a), latitude (b), MAT (c), and MAP (d), respectively. Csoil, Nsoil, Cmic, Nmic, MAT, and MAP stand for soil organic carbon, soil total nitrogen,
BGD
12, 11191–11216, 2015
Microbial carbon and nitrogen in China’s
forests
Z. Zhou and C. Wang
Title Page
Abstract Introduction
Conclusions References
Tables Figures
◭ ◮
◭ ◮
Back Close
Full Screen / Esc
Printer-friendly Version Interactive Discussion
Discussion
P
a
per
|
Discussion
P
a
per
|
Discussion
P
a
per
|
Discussion
P
a
per
|
Figure 7.Relationships between Cmic/Csoilor Nmic/Nsoilrate and Csoil: Nsoilratio (aandb), MAT
(c and d), and MAP (e and f), respectively. Csoil, Nsoil, Cmic, Nmic, MAT, and MAP stand for