Intelligence and Disability Pension in Swedish
Men and Women Followed from Childhood
to Late Middle Age
Andreas Lundin1*, Alma Sörberg Wallin1, Daniel Falkstedt2, Peter Allebeck2, Tomas Hemmingsson1,3
1Institute of Environmental Medicine, Karolinska Institutet, Stockholm, Sweden,2Department of Public Health Sciences, Karolinska Institutet, Stockholm, Sweden,3Centre for Social Research on Alcohol and Drugs, Stockholm University, Stockholm, Sweden
*andreas.lundin@ki.se
Abstract
Objective
To investigate the association between intelligence and disability pension due to mental, musculoskeletal, cardiovascular, and substance-use disorders among men and women, and to assess the role of childhood social factors and adulthood work characteristics.
Methods
Two random samples of men and women born 1948 and 1953 (n = 10 563 and 9 434), and tested for general intelligence at age 13, were followed in registers for disability pension until 2009. Physical and psychological strains in adulthood were assessed using job expo-sure matrices. Associations were examined using Cox proportional hazard regression mod-els, with increases in rates reported as hazard ratios (HRs) with 95% confidence intervals (95%CI) per decrease in stanine intelligence.
Results
In both men and women increased risks were found for disability pension due to all causes, musculoskeletal disorder, mental disorder other than substance use, and cardiovascular disease as intelligence decreased. Increased risk was also found for substance use disor-der in men. In multivariate models, HRs were attenuated after controlling for pre-school plans in adolescence, and low job control and high physical strain in adulthood. In the fully adjusted model, increased HRs remained for all causes (male HR 1.11, 95%CI 1.07–1.15, female HR 1.06, 95%CI 1.02–1.09) and musculoskeletal disorder (male HR 1.16, 95%CI 1.09–1.24, female HR 1.08, 95%CI 1.03–1.14) during 1986 to 2009.
OPEN ACCESS
Citation:Lundin A, Sörberg Wallin A, Falkstedt D, Allebeck P, Hemmingsson T (2015) Intelligence and Disability Pension in Swedish Men and Women Followed from Childhood to Late Middle Age. PLoS ONE 10(6): e0128834. doi:10.1371/journal. pone.0128834
Academic Editor:Koustuv Dalal, Örebro University, SWEDEN
Received:August 27, 2014
Accepted:April 30, 2015
Published:June 10, 2015
Copyright:© 2015 Lundin et al. This is an open access article distributed under the terms of the Creative Commons Attribution License, which permits unrestricted use, distribution, and reproduction in any medium, provided the original author and source are credited.
Data Availability Statement:Data are available from University of Gothenburg, Department of education and special education (att. Michael Hansen, Box 300, SE 405 30, Göteborg, Sweden; e-mail:michael. hansen@ped.gu.se).
Conclusion
Relatively low childhood intelligence is associated with increased risk of disability pension due to musculoskeletal disorder in both men and women, even after adjustment for risk fac-tors for disability pension measured over the life course.
Introduction
Disability pension, i. e., economic compensation when a person's work ability becomes chroni-cally reduced due to illness, injury or disability, is one of the cornerstones of the Swedish social security system, and is second only to old age pension in terms of expenditure. In most cases, receipt of disability pension entails permanently leaving the labor market. In 2013, about 7% of 19–64 year-olds had fully or partially left the labor market with a disability pension [1]. Al-though the pension decision is based on severity of functional impairment with regard to work, as judged by a physician, the granting of compensation is made with reference to the illness, in-jury or disability as it is registered in the International Classification of Diseases (ICD). Mental and musculoskeletal disorders are the dominant diagnostic groups [1]. Previously identified risk factors for disability pension are low education [2,3], current mentally and physically strenuous working conditions [2,4,5] low employment status [2], poor health behaviors, such as smoking, high alcohol consumption and lack of exercise, and body composition [2,4,6].
Intelligence has also been linked to health, and health-related and care-seeking behaviors, with risks increasing as intelligence decreases [7]. People with lower pre-morbid intelligence are more likely to smoke [8,9,10] and drink excessively [11,12], and have a higher non-adher-ence to treatment [13,14]. Furthermore, intelligence is, in most societies, the primary determi-nant of educational attainment, which in turn determines whether occupational positions and working conditions entail more or less physical and psychological strain [15]. A few studies, all of which are based on conscripted men, have established an association between level of intelli-gence and disability pension [16,17,18], but only one has made use of information on cause-specific disability pension [17]. A large study of Norwegian conscripts has shown that intelli-gence predicts disability pension in early adulthood (ages 23–36) [16], whereas studies based on Swedish conscripts have found that intelligence predicts disability pension at both ages 20–
43 [17] and 40–59 [18]. In one study of early-life predictors of disability pension in conscripts, which focused specifically on psychiatric diagnoses, people with low intelligence (defined as members of stanine groups 1–4, i.e., the 40% of the population lowest in intelligence) were found to have increased risks of disability pension due to psychosis, non-psychotic disorder, al-cohol-use disorder and drug-related disorder, compared with those with medium to high intel-ligence [17]. We have, in longer follow-up of the same conscripts, although not those with cause-specific diagnoses, examined the potential mediating role of working conditions, show-ing that adult workshow-ing conditions mediate part of the association between young-adulthood in-telligence and middle-age disability pension [18]. The same measures of working conditions have also been shown to explain educational differences in disability pension [5].
No previous study has examined the association between intelligence and disability pension in women, which may be different from that demonstrated in men. Moreover, no study has made use of disability pension diagnosis, which offers more specific information on the mor-bidity behind the functional impairment that may associate intelligence with disability pension in middle age. Intelligence may be an integral part in the production of social health inequali-ties, through factors such as behavior, and labor-market and working conditions (factors
which we also know may differ according to gender). Time series studies has also shown that the expansion of the education system potentially lead to increased wage inequality [19], and those with a higher education are less likely to have longer unemployment spells [20]. Intelli-gence is a strong predictor of education, and a very large study has recently shown that educa-tion has remained a strong mediator in the associaeduca-tion between male intelligence and all-cause disability pension across two decades [21]. However, it is also possible that intelligence is a risk factor for disability pension independent of mechanisms associated with education.
In the present study, we aim to investigate the associations between intelligence and disabili-ty pension, all-cause and cause-specific, in two pooled samples of 13-year-old boys and girls born in 1948 and 1953 and followed in national registers up to 2009. While all-cause disability pension is a summary measure of the extent of functional disability and exclusion from the labor market, cause-specific disorders may provide information regarding the mechanisms in-volved. That is, people are excluded from the labor market for not meeting mental or cognitive demands, for musculoskeletal disorder arising from manual work, or for decreased work ability due to life-style-related diseases, and the specific morbidity behind the disability pension may contribute to explain whether intelligence is a risk factor for not meeting physical, mental or other functional demands. Because these categories are not clear-cut–cardiovascular disease, for example, is caused not only by life-style related factors but also by work-related stress–an additional objective is to investigate the extent to which adult working conditions, measured using psychosocial and physical Job Exposure Matrices (JEMs), mediate any associations be-tween intelligence and disability pension due to mental disorder, substance use disorder, mus-culoskeletal disorder, and cardiovascular disease (CVD).
Method and Variables
Ethics statement
Ethical approval was obtained from Stockholm’s Regional Ethical Review Board at Karolinska Institutet (decision reference number 2004/5:9–639/5). Due to the character of the database and the anonymization of all data, the Review Board waived the normal requirement of written consent.
Study population
of the national basic pension and insurance system, which covers all Swedish residents, every-one in a cohort is considered at risk, irrespective of labor-market status.
The age-13 intelligence test
Intelligence test results at 13consist in the sum of scores from three tests: verbal (antonyms, 40 items, 10 minutes), inductive (number series, 40 items, 18 minutes), and spatial (metal folding, 40 items, 15 minutes). The tests measure the verbal, inductive and spatial aspects of intelligence separately, developed according to a Thurstone classification of abilities, but it has been shown that they can be combined as a measure of general intelligence (g) [24].
The tests were administered by class teachers according to instructions handed over by the school head teacher. They were performed in two sessions with a break in-between. Session 1 started with antonyms, followed by metal folding, and then a questionnaire on leisure. Session 2 started with a questionnaire on future plans, followed by the number series test, and question-naires on interests and attitudes toward school. All tests started out with easy items but became progressively more difficult, and teachers were instructed to help with the written instructions. All tests were preceded by examples illustrated by the teachers. Reliability tests were conducted on a subsample (173 boys and 176 girls, born 1948), showing that intercorrelations ranged be-tween 0.41 and 0.48, and that internal consistency was good (Kuder–Richardson Formula 20 co-efficients: 0.87 for the verbal, 0.88 for the spatial, and 0.92 for the inductive test) [25]. The tests developed for these cohorts are the same that were later used for the Swedish and Danish Metro-polit cohorts of 1953 [26,27]. For each individual, we summed the scores of the three tests, and standardized the total into a stanine score as a measure of general intelligence.
Disability pension
Information on disability pension is registered yearly in the Swedish Social Insurance Agency’s database. Anyone between 16 and 65 years of age can be granted disability pension if their work-ing capacity is impaired by at least 25% (50% prior to 1993) [28]. The following diagnostic groups were used: mental disorder excluding substance use ICD-8 290–302, 306–311, ICD-9 290–302, 306–315, and ICD-10 F00–F09, F20–F99; substance use disorder; ICD-8 and ICD-9 303–305, ICD-10 F10–F19; musculoskeletal diagnosis ICD-8 710–738, ICD-9 710–739 and ICD-10 M00–
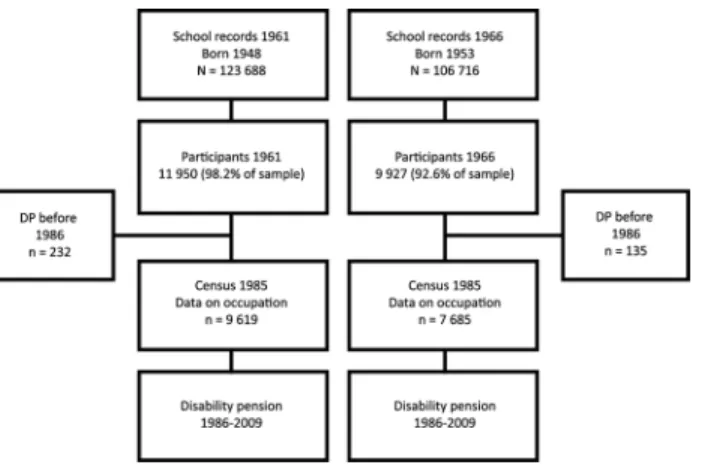
M99; and; cardiovascular disease ICD-8 390–459, ICD-9 390–459, ICD-10 I00–I99. Fig 1. Study Components of the Evaluation Through Follow-up 1948 and 1953 cohorts.The figure shows the sample frame, initial participants, deaths between participation and the 1986 census, and the study base in which disability pension was studied.
Covariates
Work characteristics in adulthood. High psychological demands/Low job control and High physical strain at work were established using two Job Exposure Matrices linked to the in-dividuals’5-digit occupational codes, as registered in the National Population and Housing Census of 1985 (Nordic Classification of Occupations, NYK, the Swedish version of ISCO-88). The Psychosocial Job Exposure Matrix is based on questions from the Swedish Work Environ-ment Surveys 1989–1997 concerning different aspects of working conditions, e.g., psychologi-cal demands (five items) and job control (four items on decision authority, and three on skill discretion). Average scores on these factors for 321 job titles were ascribed to the participants [29]. We created four equally sized groups based on psychological demands and job control: high, medium–high, medium–low, and low. In the manual the spearman-rank-order correla-tion between the derived JEM group and individual exposure level group for psychological de-mands ranged between 0.25 and 0.31 in men and women age 30–44, and for job control between 0.39 and 0.45 [29]. The second matrix, Physical Strain at Work, is based on a summary index of eight physical risk factors in the Annual Level-of-Living Surveys (1977, 1979–1981): heavy lifts daily, repetitive and one-sided work movements, awkward work postures, heavy shaking or vibrations, daily perspiration from physical exertion, contact with dirt, deafening noise, and risk of exposure to accidents, with means calculated for 300 job titles. Means were grouped into quartiles of physical strain, labeled high, medium–high, medium–low, and low [30], which we ascribed to the participants. We examined the spearman-rank-order correlation between the derived JEM group and the individual exposure level (a linear combination of the dichotomously scored items of physical work environment) in the Annual Level-of-Living Sur-vey 1977 linked to the JEM by NYK (with information on both: n = 7282) and found it to be 0.51 for women and 0.52 for men. Both matrices have been used previously as proxies for men-tal and physical working conditions [18].
Level of education. Data on level of education were taken from administrative school rec-ords and registered according to the Swedish version of the International Standard Classifica-tion of EducaClassifica-tion (ISCED): 1) Primary and lower secondary,<9 years; 2) Primary and lower
secondary, 9 years; 3) Secondary; 4) Upper secondary; 5) Post-secondary, 2 years or less; 6) Post-secondary, 3–4 years, and; 7) Postgraduate education. We combined categories 1 and 2 (9 years of schooling), and 6–7 (15 years of schooling) leaving five groups based on number of years of education:9, 10–11, 12–13, 14, and15 years. Very few persons were found in groups 1 and 7 in this cohort.
School plans and paternal education. Because intelligence test might also reflect differ-ences in school motivation, or childhood circumstances we included two measures of potential confounders, future school plans and paternal education. School plans, the intent to study be-yond compulsory schooling, was measured using the item:‘Do you expect eventually to gradu-ate from post-secondary school?’/’Will you eventually apply for post-secondary school?’with response options‘Yes’,‘No’, and‘Don’t know’. The rationale for using this item was that it has been shown to be a good predictor of future school continuation [23]. The highest level of edu-cation of the father (or other male caretaker) was reported in a questionnaire with four pre-de-fined categories: primary (compulsory six years), lower secondary (nine years), upper
Statistical analysis
The association between intelligence and disability pension was examined using Cox propor-tional hazards regression modeling, treating intelligence as a continuous variable, in order to measure increases in risk with decreasing levels of intelligence. Crude as well as adjusted hazard ratios (HRs) are reported, and 95% confidence intervals (CIs) are used as measures of uncer-tainty. Person-years were counted from January 1, 1971 until the date of receiving disability pension, migrating, dying or until end of follow-up on July 1, 2009. Non-proportionality was tested by including interaction by time in the regressions. School plans and paternal education were included as potential confounders, together with control for cohort (individuals born 1948 or 1953). In the analyses examining the potential mediating factors i.e. the role of educa-tion, information on which was first available in 1986, and the occupational factors, which were attributed from the occupational titles measured in 1985, person-years were counted from January 1, 1986. To assess the role of working conditions, we conducted the same analy-ses, but restricted the sample to people with occupational titles measured in 1985. After con-trolling for confounders and education, the potential mediators, i.e., physical demands, psychological demands and work control were added to the model. As a last step, we excluded education from the full analysis, since there are debates over whether education represents in-telligence, whether it is a proxy for occupational exposures, and whether it represents addition-al, independent factors, such as personality or incentives [15]. We used listwise deletion, and all analyses were conducted on 18 535 individuals (85% of the sample). Regressions were per-formed in SAS using the PHREG procedure (SAS 9.3, SAS Institute Inc., Cary, NC, USA).
Results
Of the total study population, 17.6% (n = 3269) had been granted a disability pension by the end of follow-up in 2009, by sex, 13.3% of the men (n = 1238) and 22.1% of the women (n = 2031).
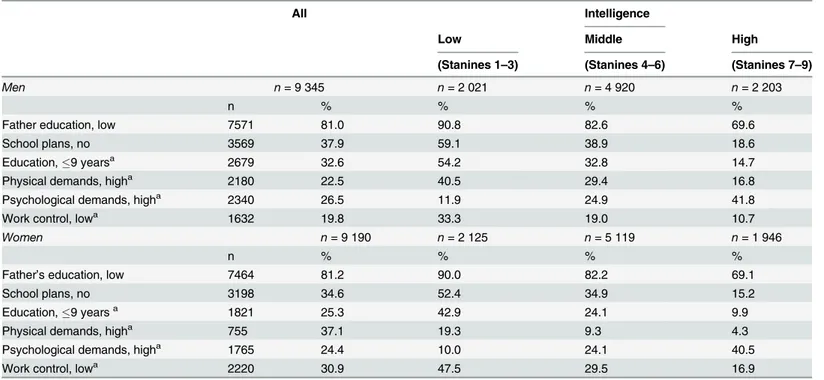
Table 1shows the distribution of potential explanatory risk factors across groups based on intelligence (with stanines 1–3, 4–6 and 7–9 grouped for illustrative purposes. Only individuals with full information on all variables are included). Individuals with higher intelligence more often came from homes with educated fathers, and more often thought they would continue into secondary school. Work characteristics of the jobs reported by the individuals in 1985, at ages 32–37, also differed when they were grouped by intelligence; physically demanding jobs and low-control jobs were more common among those with lower intelligence, as too were jobs with lower psychological demands.
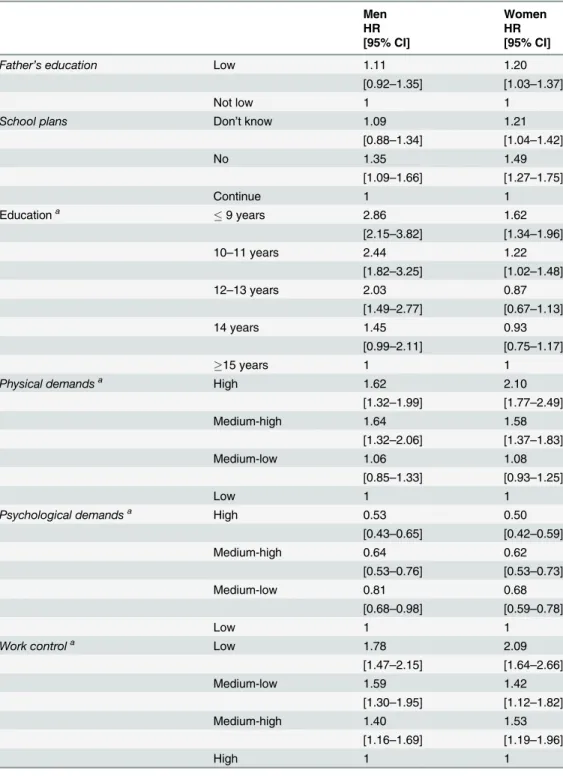
Table 2shows the associations between potential explanatory risk factors and disability pen-sion 1971–2009 as hazard ratios, adjusted for cohort. With the exception of the father being lowly educated, which was not a predictor in men, all the risk factors were statistically signifi-cant predictors of all-cause disability pension. Low psychological demands were associated with increased risk of disability pension.
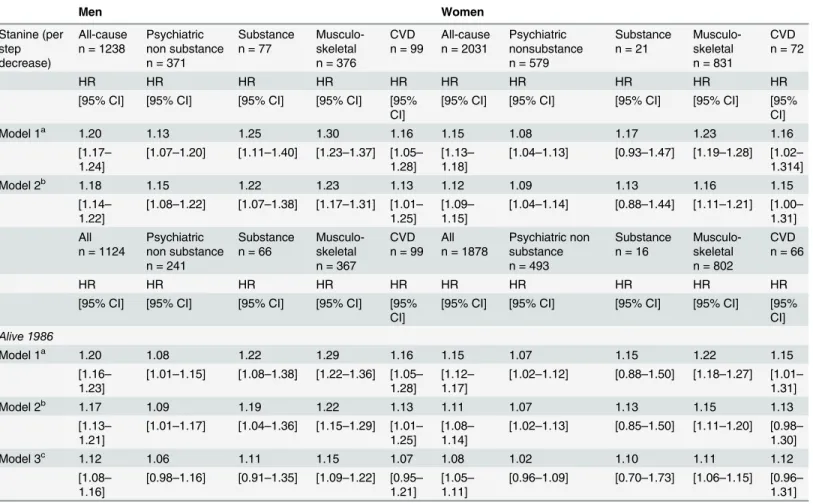
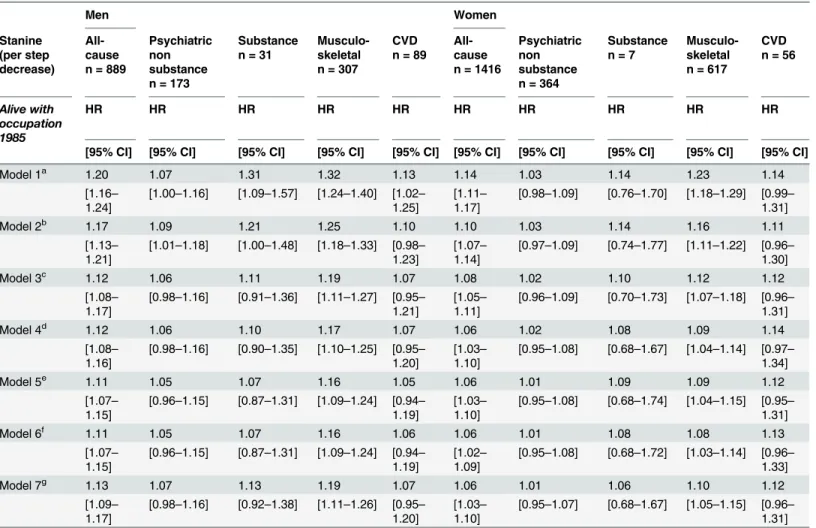
Table 4shows the association between intelligence and disability pension 1986–2009 among people with census information on occupation in 1985 (n= 8218 men andn= 7210 women). The strong associations of intelligence with musculoskeletal disorder and all-cause disability pension, for both men and women, remained significant after controlling for potential con-founders, including education. There was no effect of restricting the analysis to those with in-formation on occupation (cf. Tables4and3). For both men and women, the confounder-adjusted HR between intelligence and disability pension granted for musculoskeletal disorder is additionally diluted by controlling for working conditions, but remains statistically signifi-cantly increased. Also, the association between intelligence and all-cause disability pension re-mains statistically significant in the fully adjusted model.
Discussion
In this study, we found that preadolescent lower intelligence (at ages 12–13) was associated with all-cause disability pension, and also with disability pension due to mental disorder, mus-culoskeletal disorder and cardiovascular disease between ages 23 and 52, in both men and women. For men, there was also an association between lower intelligence and substance use disorder. The association between intelligence and disability pension granted for musculoskele-tal disorder was stronger than the association between intelligence and disability pension granted for mental disorder. Among people with information on occupation in middle age, lower intelligence predicted musculoskeletal disorder. This association was partly mediated by adult work load, approximated by the job exposure matrices for physical and mental load, but remained increased in both men and women. Poor working environment is the main determi-nant of musculoskeletal disorder.
Table 1. Distribution of potential explanatory risk factors across groups based on intelligence.
All Intelligence
Low Middle High
(Stanines 1–3) (Stanines 4–6) (Stanines 7–9)
Men n= 9 345 n= 2 021 n= 4 920 n= 2 203
n % % % %
Father education, low 7571 81.0 90.8 82.6 69.6
School plans, no 3569 37.9 59.1 38.9 18.6
Education,9 yearsa 2679 32.6 54.2 32.8 14.7
Physical demands, higha 2180 22.5 40.5 29.4 16.8
Psychological demands, higha 2340 26.5 11.9 24.9 41.8
Work control, lowa 1632 19.8 33.3 19.0 10.7
Women n= 9 190 n= 2 125 n= 5 119 n= 1 946
n % % % %
Father’s education, low 7464 81.2 90.0 82.2 69.1
School plans, no 3198 34.6 52.4 34.9 15.2
Education,9 yearsa 1821 25.3 42.9 24.1 9.9
Physical demands, higha 755 37.1 19.3 9.3 4.3
Psychological demands, higha 1765 24.4 10.0 24.1 40.5
Work control, lowa 2220 30.9 47.5 29.5 16.9
a= Participants with information on occupation in 1985 census (n = 8218 men, 7213 women).
The HRs of all-cause disability pension, after controlling for cohort, showed a 1.20 per in-crease on the stanine scale for men, which and 1.13 on the scale for women, with both estimates statistically significant. The male HR is similar to that found in a previous study of age-18 intel-ligence and disability pension between ages 40 and 59 in a conscription cohort, HR = 1.26 per Table 2. Associations between potential explanatory risk factors and disability pension, hazard ratios (HRs) and 95% confidence intervals (CIs).
Men Women
HR HR
[95% CI] [95% CI]
Father’s education Low 1.11 1.20
[0.92–1.35] [1.03–1.37]
Not low 1 1
School plans Don’t know 1.09 1.21
[0.88–1.34] [1.04–1.42]
No 1.35 1.49
[1.09–1.66] [1.27–1.75]
Continue 1 1
Educationa 9 years 2.86 1.62
[2.15–3.82] [1.34–1.96]
10–11 years 2.44 1.22
[1.82–3.25] [1.02–1.48]
12–13 years 2.03 0.87
[1.49–2.77] [0.67–1.13]
14 years 1.45 0.93
[0.99–2.11] [0.75–1.17]
15 years 1 1
Physical demandsa High 1.62 2.10
[1.32–1.99] [1.77–2.49]
Medium-high 1.64 1.58
[1.32–2.06] [1.37–1.83]
Medium-low 1.06 1.08
[0.85–1.33] [0.93–1.25]
Low 1 1
Psychological demandsa High 0.53 0.50
[0.43–0.65] [0.42–0.59]
Medium-high 0.64 0.62
[0.53–0.76] [0.53–0.73]
Medium-low 0.81 0.68
[0.68–0.98] [0.59–0.78]
Low 1 1
Work controla Low 1.78 2.09
[1.47–2.15] [1.64–2.66]
Medium-low 1.59 1.42
[1.30–1.95] [1.12–1.82]
Medium-high 1.40 1.53
[1.16–1.69] [1.19–1.96]
High 1 1
a= Participants with information on occupation in 1985 census (n = 8218 men, 7213 women).
stanine step [18]. In the same cohort, low intelligence (defined as being in the stanine range 1–4 at age 18) was associated with disability pension from mental disorder between the ages 20 and 43 even after controlling for psychiatric diagnosis, psychological symptoms, and deviant behavior measured at conscription [17]. Also, our results are in line with those of a Norwegian conscription study, where the disability-pension HR decreased by about 7% per stanine in-crease in intelligence [16]. We know of no previous comparable studies of women.
The association found between intelligence and musculoskeletal disorder, was the only sta-tistically significant multivariate association after excluding the first 15 years of follow-up. We found some reduction in the association after including attained level of education, which is similar to a result of the Norwegian conscript study, where one-third of the intelligence-disabil-ity pension association was found to be mediated through education [16]. In a British study, education fully mediated the associations of intelligence with anxiety and functional disability [31]. It is possible that intelligence also predicts disability pensions granted with other diagno-ses, and that the associations would have been statistically significant with a larger sample. Table 3. Intelligence and relative risks of disability pension 1971–2009 and 1986–2009, hazard ratios (HRs) and 95% confidence intervals (CIs)
as-sociated with one point decrease on the stanine intelligence scale.
Men Women
Stanine (per step decrease)
All-cause n = 1238
Psychiatric non substance n = 371
Substance n = 77
Musculo-skeletal n = 376
CVD n = 99
All-cause n = 2031
Psychiatric nonsubstance n = 579
Substance n = 21
Musculo-skeletal n = 831
CVD n = 72
HR HR HR HR HR HR HR HR HR HR
[95% CI] [95% CI] [95% CI] [95% CI] [95% CI]
[95% CI] [95% CI] [95% CI] [95% CI] [95% CI]
Model 1a 1.20 1.13 1.25 1.30 1.16 1.15 1.08 1.17 1.23 1.16
[1.17–
1.24] [1.07–1.20] [1.11–1.40] [1.23–1.37] [1.051.28]– 1.18][1.13– [1.04–1.13] [0.93–1.47] [1.19–1.28] [1.021.314]–
Model 2b 1.18 1.15 1.22 1.23 1.13 1.12 1.09 1.13 1.16 1.15
[1.14–
1.22] [1.08–1.22] [1.07–1.38] [1.17–1.31] [1.011.25]– 1.15][1.09– [1.04–1.14] [0.88–1.44] [1.11–1.21] [1.001.31]– All
n = 1124 Psychiatricnon substance n = 241
Substance
n = 66 Musculo-skeletal n = 367
CVD
n = 99 Alln = 1878 Psychiatric nonsubstance n = 493
Substance
n = 16 Musculo-skeletal n = 802
CVD n = 66
HR HR HR HR HR HR HR HR HR HR
[95% CI] [95% CI] [95% CI] [95% CI] [95%
CI] [95% CI] [95% CI] [95% CI] [95% CI] [95%CI] Alive 1986
Model 1a 1.20 1.08 1.22 1.29 1.16 1.15 1.07 1.15 1.22 1.15
[1.16– 1.23]
[1.01–1.15] [1.08–1.38] [1.22–1.36] [1.05– 1.28]
[1.12– 1.17]
[1.02–1.12] [0.88–1.50] [1.18–1.27] [1.01– 1.31]
Model 2b 1.17 1.09 1.19 1.22 1.13 1.11 1.07 1.13 1.15 1.13
[1.13–
1.21] [1.01–1.17] [1.04–1.36] [1.15–1.29] [1.011.25]– 1.14][1.08– [1.02–1.13] [0.85–1.50] [1.11–1.20] [0.981.30]–
Model 3c 1.12 1.06 1.11 1.15 1.07 1.08 1.02 1.10 1.11 1.12
[1.08–
1.16] [0.98–1.16] [0.91–1.35] [1.09–1.22] [0.951.21]– 1.11][1.05– [0.96–1.09] [0.70–1.73] [1.06–1.15] [0.961.31]–
aAdjusted for cohort. bAdjusted for cohort, father
’s education, and school plans.
cAdjusted for cohort, father
’s education, school plans, and education.
We examined the role of working conditions by controlling for physical and mental de-mands, and also work control, in the participants’jobs at ages 32–37, because these are factors that are associated with increased risk of disability pension due to musculoskeletal disorder, cardiovascular disease, and mental disorder [32]. We found, among those with occupational information in middle age, that work characteristics partially mediate the association between intelligence and musculoskeletal disorder, which indicates that at least some of the association is due to the selection of lower intelligence groups into more dangerous occupations. These findings are in line with those found in a cohort of 12 year-old boys and girls in Luxembourg, Table 4. Intelligence and relative risks of disability pension 1986–2009 in the working population, hazard ratios (HRs) and 95% confidence
inter-vals (CI) associated with a one point decrease on the stanine intelligence scale.
Men Women Stanine (per step decrease) All-cause n = 889
Psychiatric non substance n = 173
Substance n = 31
Musculo-skeletal n = 307
CVD n = 89
All-cause n = 1416
Psychiatric non substance n = 364
Substance n = 7
Musculo-skeletal n = 617
CVD n = 56
Alive with occupation 1985
HR HR HR HR HR HR HR HR HR HR
[95% CI] [95% CI] [95% CI] [95% CI] [95% CI] [95% CI] [95% CI] [95% CI] [95% CI] [95% CI]
Model 1a 1.20 1.07 1.31 1.32 1.13 1.14 1.03 1.14 1.23 1.14
[1.16–
1.24] [1.00–1.16] [1.09–1.57] [1.24–1.40] [1.021.25]– 1.17][1.11– [0.98–1.09] [0.76–1.70] [1.18–1.29] [0.991.31]–
Model 2b 1.17 1.09 1.21 1.25 1.10 1.10 1.03 1.14 1.16 1.11
[1.13–
1.21] [1.01–1.18] [1.00–1.48] [1.18–1.33] [0.981.23]– 1.14][1.07– [0.97–1.09] [0.74–1.77] [1.11–1.22] [0.961.30]–
Model 3c 1.12 1.06 1.11 1.19 1.07 1.08 1.02 1.10 1.12 1.12
[1.08–
1.17] [0.98–1.16] [0.91–1.36] [1.11–1.27] [0.951.21]– 1.11][1.05– [0.96–1.09] [0.70–1.73] [1.07–1.18] [0.961.31]–
Model 4d 1.12 1.06 1.10 1.17 1.07 1.06 1.02 1.08 1.09 1.14
[1.08– 1.16]
[0.98–1.16] [0.90–1.35] [1.10–1.25] [0.95– 1.20]
[1.03– 1.10]
[0.95–1.08] [0.68–1.67] [1.04–1.14] [0.97– 1.34]
Model 5e 1.11 1.05 1.07 1.16 1.05 1.06 1.01 1.09 1.09 1.12
[1.07–
1.15] [0.96–1.15] [0.87–1.31] [1.09–1.24] [0.941.19]– 1.10][1.03– [0.95–1.08] [0.68–1.74] [1.04–1.15] [0.951.31]–
Model 6f 1.11 1.05 1.07 1.16 1.06 1.06 1.01 1.08 1.08 1.13
[1.07–
1.15] [0.96–1.15] [0.87–1.31] [1.09–1.24] [0.941.19]– 1.09][1.02– [0.95–1.08] [0.68–1.72] [1.03–1.14] [0.961.33]–
Model 7g 1.13 1.07 1.13 1.19 1.07 1.06 1.01 1.06 1.10 1.12
[1.09–
1.17] [0.98–1.16] [0.92–1.38] [1.11–1.26] [0.951.20]– 1.10][1.03– [0.95–1.07] [0.68–1.67] [1.05–1.15] [0.961.31]–
aAdjusted for cohort. bAdjusted for cohort, father
’s education, and school plans.
cAdjusted for cohort, father
’s education, school plans, and education.
dAdjusted for cohort, father
’s education, school plans, education, and physical demands.
eAdjusted for cohort, father
’s education, school plans, education, psychological demands, and work control.
fAdjusted for cohort, father
’s education, school plans, education, physical demands, psychological demands, and work control.
gAdjusted for cohort, father
’s education, school plans, physical demands, psychological demands, and work control.
where the association between childhood intelligence and age-52 physical functional ability was fully mediated by education and adult socioeconomic position [33].
The crude association between intelligence and disability pension due to mental disorder, excluding substance use disorder, found in our study was HR 1.15 for men and HR 1.08 for women, for each point decrease on the stanine intelligence scale. This is in line with the finding of a Danish study of similar design (although with men only) in the same period, and using the same intelligence test, where every SD decrease in intelligence increased the HR of psychiatric hospitalization by 1.2 over 33 years of follow-up [34]. Larger studies of men with intelligence-test results collected at conscription have shown that intelligence is inversely associated with hospitalization due to most psychiatric diagnoses [35,36]. However these inpatients are charac-terized by injuries and high-severity disorders, while the Common Mental Disorders that give rise to the bulk of disability pension may be less associated with intelligence. Since we were able to adjust for adult physical and psychological work load, approximated in job exposure matri-ces, we provide additional understanding of how intelligence becomes related to future occupa-tional exposure and disability-related exit from the labor market. Several mechanisms might underlie the association of intelligence with morbidity, including latent morbidity, coping and behavior, and selection into hazardous occupational positions. Hazardous occupational posi-tions in adulthood, as well as educational success, and adult social circumstances are on the likely pathway, a chain of adverse events eventually leading to poor health and accompanying functional abilities. However, these adult circumstances might also be interpreted as indicators of a lower cognitive ability that would affect health irrespective of adult social and economic circumstances [37]. Using cause-specific disability pension provided one means for extending the knowledge of how and why intelligence predicts disorder and disability, although the etiol-ogy (e.g. work-related or not) of the disorders that accompany the disability pension is not known.
Methodological considerations
The principal strength of this study is that is based on a large sample representative of the Swedish population, including women. No previous study has examined the association be-tween intelligence and disability pension in women. A second strength is high baseline partici-pation. With more than 90% participating children, the test results are likely to provide good estimates of the population’s intelligence. A third strength is the use of register data on diagno-ses for disability pension, which were made by a physician. With the exception of one previous study based on Swedish men, where disability pension due to mental disorder was examined, studies of intelligence and disability pension have relied on non-specific disability-pension data.
vibrations, even stronger support for an indirect rather than a direct association between intel-ligence and disability pension due to musculoskeletal disorder would probably have appeared. Another potential limitation is that the occupational codes in the census refer to the respon-dents’occupation in a given week, and, although most individuals are occupationally stable in this regard, for some individuals, their occupation at a specific time point might not represent their long-term work exposure. However, comparisons between census occupations and survey reports on occupational history have shown good overall agreement, in particular with regard to the physical Job Exposure Index used in our study. [40,41]
Another caveat is that the validity of the ICD diagnoses involved in disability pension are largely unexamined. One study comparing registered sick leave due to musculoskeletal diagno-ses (that are set by the same physicians as for disability pension) with relevant self-reported ret-rospective information (four years back) did, however, find a high level of agreement (89–97%) [42], and we see no reason why the diagnostic practice for disability pension should be different from the practice for sick leave.
Conclusion
In this large population-based sample of Swedish men and women we found that preadolescent intelligence (at ages 12–13) was associated with disability pension between ages 20 and 61. As-sociations were found for disability pension granted for musculoskeletal disorder as well as for mental disorder and cardiovascular disease, in both men and women, but disability pension due to a musculoskeletal disorder was the only association that remained statistically signifi-cant after adjusting for education and work environment.
Acknowledgments
Statistician Sofia Löfving, Karolinska institutet, Department of public health sciences, provided valuable help with the data files.
Author Contributions
Analyzed the data: AL TH. Wrote the paper: AL AS DF PA TH.
References
1. Försäkringskassan (2013) Social insurance in figures 2013. Stockholm: Swedish Social Insurance Agency.
2. Krokstad S, Johnsen R, Westin S (2002) Social determinants of disability pension: a 10-year follow-up of 62 000 people in a Norwegian county population. International Journal of Epidemiology 31: 1183– 1191. PMID:12540720
3. Bruusgaard D, Smeby L, Claussen B (2010) Education and disability pension: A stronger association than previously found. Scandinavian Journal of Public Health 38: 686–690. doi:10.1177/
1403494810378916PMID:20709890
4. Kaila-Kangas L, Haukka E, Miranda H, Kivekas T, Ahola K, Luukkonen R et al. (2014) Common mental and musculoskeletal disorders as predictors of disability retirement among Finns. J Affect Disord 165: 38–44. doi:10.1016/j.jad.2014.04.036PMID:24882175
5. Falkstedt D, Backhans M, Lundin A, Allebeck P, Hemmingsson T (2014) Do working conditions explain the increased risks of disability pension among men and women with low education? A follow-up of Swedish cohorts. Scandinavian Journal of Work Environment & Health 40: 483–492.
6. Knudsen AK, Overland S, Aakvaag HF, Harvey SB, Hotopf M, Mykletun A. (2010) Common mental dis-orders and disability pension award: seven year follow-up of the HUSK study. Journal of Psychosomat-ic Research 69: 59–67. doi:10.1016/j.jpsychores.2010.03.007PMID:20630264
8. Taylor MD, Hart CL, Davey Smith G, Starr JM, Hole DJ, Whalley LJ et al. (2003) Childhood mental abili-ty and smoking cessation in adulthood: prospective observational study linking the Scottish Mental Sur-vey 1932 and the Midspan studies. Journal of Epidemiology and Community Health 57: 464–465. PMID:12775797
9. Wennerstad KM, Silventoinen K, Tynelius P, Bergman L, Kaprio J, Rasmussen F (2010) Associations between IQ and cigarette smoking among Swedish male twins. Social Science & Medicine 70: 575– 581.
10. Hemmingsson T, Kriebel D, Melin B, Allebeck P, Lundberg I (2008) How Does IQ Affect Onset of Smok-ing and Cessation of SmokSmok-ing—Linking the Swedish 1969 Conscription Cohort to the Swedish Survey of Living Conditions. Psychosomatic Medicine 70: 805–810. doi:10.1097/PSY.0b013e31817b955f PMID:18606723
11. Batty GD, Deary IJ, Macintyre S (2006) Childhood IQ and life course socioeconomic position in relation to alcohol induced hangovers in adulthood: the Aberdeen children of the 1950s study. Journal of Epide-miology and Community Health 60: 872–874. PMID:16973534
12. Jefferis BJMH, Manor O, Power C (2008) Cognitive development in childhood and drinking behaviour over two decades in adulthood. Journal of Epidemiology and Community Health 62: 506–512. doi:10. 1136/jech.2007.059840PMID:18477749
13. Stilley C, Sereika S, Muldoon M, Ryan C, Dunbar-Jacob J (2004) Psychological and cognitive function: Predictors of adherence with cholesterol lowering treatment. Annals of Behavioral Medicine 27: 117– 124. PMID:15026295
14. Deary IJ, Gale CR, Stewart MCW, Fowkes FGR, Murray GD, Batty GD et al. (2009) Intelligence and persisting with medication for two years: Analysis in a randomised controlled trial. Intelligence 37: 607– 612. PMID:19907664
15. Deary I (2008) Why do intelligent people live longer? Nature 456: 175–176. doi:10.1038/456175a PMID:19005537
16. Gravseth HM, Bjerkedal T, Irgens LM, Aalen OO, Selmer R, Kristensen P (2008) Influence of physical, mental and intellectual development on disability in young Norwegian men. European Journal of Public Health 18: 650–655. doi:10.1093/eurpub/ckn055PMID:18593730
17. Upmark M, Lundberg I, Sadigh J, Allebeck P, Bigert C (1999) Psychosocial characteristics in young men as predictors of early disability pension with a psychiatric diagnosis. Soc Psychiatry Psychiatr Epi-demiol 34: 533–540. PMID:10591813
18. Sörberg A, Lundin A, Allebeck P, Melin B, Falkstedt D, Hemmingsson T(2013) Cognitive Ability in Late Adolescence and Disability Pension in Middle Age: Follow-Up of a National Cohort of Swedish Males. PLoS ONE 8: 2–9.
19. Machado JAF, Mata J (2005) Counterfactual decomposition of changes in wage distributions using quantile regression. Journal of Applied Econometrics 20: 445–465.
20. Riddell WC, Song X (2011) The impact of education on unemployment incidence and re-employment success: Evidence from the U.S. labour market. Labour Economics 18: 453–463.
21. Karnehed N, Rasmussen F, Modig K (2015) Low IQ has become less important as a risk factor for early disability pension. A longitudinal population-based study across two decades among Swedish men. J Epidemiol Community Health.
22. SCB (1976) IndividualIzed school data for a sample of pupils born in 1948 or 1953 [Individualstatistiken. Skoldata för ett urval elever födda 1948 och 1953]. Örebro: National Central Bureau of Statistics. 1– 122 p.
23. Rovio-Johansson A (1968) Individualstatistikundersökningen 1966. I. Instrument, population och mate-rialöversikt [Individual statistics project 1966. Instrument, population and summary of the material]. Gö-teborg: University of Gothenburg. 1–49 p.
24. Balke-Aurell G (1982) Changes in Ability as Related to Educational and occupational Experience. Gothenburg: University of Gothenburg.
25. Härnqvist K, Svensson A (1964) En »databank« För Yrkes- Och Studievalsundersökningar [A Swedish “data bank”for follow-up studies of educational and vocational variables]. Nordisk Psykologi 16: 118– 124.
26. Stenberg S-Å, Vågerö D, Österman R, Arvidsson E, Von Otter C, Janson CG (2007) Stockholm Birth
Cohort Study 1953–2003: A new tool for life-course studies. Scandinavian Journal of Public Health 35: 104–110. PMID:17366094
27. Osler M, Andersen A-MN, Lund R, Batty GD, Hougaard CØ, Damsgaard MT et al. (2004) Revitalising
the Metropolit 1953 Danish male birth cohort: background, aims and design. Paediatric and Perinatal Epidemiology 18: 385–394. PMID:15367326
29. Fredlund P, Hallqvist J, Diderichsen F (2000) Psykosocial yrkesexponeringsmatris. Stockholm: Na-tional institute of working life.
30. Östlin P (1989) Occupational career and health. Uppsala: Uppsala University.
31. Johnson W, Corley J, Starr JM, Deary IJ (2011) Psychological and Physical Health at Age 70 in the Lo-thian Birth Cohort 1936: Links With Early Life IQ, SES, and Current Cognitive Function and Neighbor-hood Environment. Health Psychology 30: 1–11. doi:10.1037/a0021834PMID:21299289
32. Mäntyniemi A, Oksanen T, Salo P, Virtanen M, Sjösten N, Pentti J et al. (2012) Job strain and the risk of disability pension due to musculoskeletal disorders, depression or coronary heart disease: a prospec-tive cohort study of 69 842 employees. Occupational and Environmental Medicine 69: 574–581. doi: 10.1136/oemed-2011-100411PMID:22573793
33. Wrulich M, Brunner M, Stadler G, Schalke D, Keller U, Chmiel M et al. (2013) Childhood intelligence and adult health: The mediating roles of education and socioeconomic status. Intelligence 41: 490– 500.
34. Batty GD, Mortensen EL, Osler M (2005) Childhood IQ in relation to later psychiatric disorder— Evi-dence from a Danish birth cohort study. British Journal of Psychiatry 187: 180–181. PMID:16055831
35. Urfer-Parnas A, Mortensen EL, Saebye D, Parnas J (2010) Pre-morbid IQ in mental disorders: a Danish draft-board study of 7486 psychiatric patients. Psychological Medicine 40: 547–556. doi:10.1017/ S0033291709990754PMID:19656427
36. Gale CR, Batty GD, Tynelius P, Deary IJ, Rasmussen F (2010) Intelligence in Early Adulthood and Sub-sequent Hospitalization for Mental Disorders. Epidemiology 21: 70–77. doi:10.1097/EDE.
0b013e3181c17da8PMID:19907333
37. Batty GD, Deary IJ (2004) Early life intelligence and adult health. BMJ 329: 585–586. PMID:15361422
38. Karasek R, Brisson C, Kawakami N, Houtman I, Bongers P, Amick B (1998) The Job Content Question-naire (JCQ): an instrument for internationally comparative assessments of psychosocial job character-istics. J Occup Health Psychol 3: 322–355. PMID:9805280
39. Mantyniemi A, Oksanen T, Salo P, Virtanen M, Sjosten N, Pentti J et al. (2012) Job strain and the risk of disability pension due to musculoskeletal disorders, depression or coronary heart disease: a prospec-tive cohort study of 69 842 employees. Occupational and Environmental Medicine 69: 574–581. doi: 10.1136/oemed-2011-100411PMID:22573793
40. Ostlin P, Warneryd B, Thorslund M (1990) Should Occupational Codes Be Obtained from Census-Data or from Retrospective Survey Data in Studies on Occupational-Health. Social Indicators Research 23: 231–246.
41. Warneryd B, Thorslund M, Ostlin P (1991) The Quality of Retrospective Questions About Occupational History—a Comparison between Survey and Census-Data. Scandinavian Journal of Social Medicine 19: 7–13. PMID:1925431