Association of Adiposity Indices with Platelet
Distribution Width and Mean Platelet Volume
in Chinese Adults
Jian Hou
1,2☯, Chuanyao Liu
1,2☯, Ping Yao
2,3☯, Weihong Chen
1,2, Meian He
1,2,
Youjie Wang
2,4, Yuan Liang
2,5, Xiaoping Miao
6, Sheng Wei
6, Tian Xu
1,2, Weimin Fang
4,
Jiang Zhu
7, Xiulou Li
8, Frank B. Hu
9, Tangchun Wu
1,2, Handong Yang
10*
, Jing Yuan
1,2*
1Department of Occupational and Environmental Health, School of Public Health, Tongji Medical College, Huazhong University of Science and Technology, Wuhan 430030, Hubei, P.R.China,2MOE Key Lab of Environment and Health, School of Public Health, Tongji Medical College, Huazhong University of Science and Technology, Wuhan 430030, Hubei, P.R.China,3Department of Nutrition and Food Hygiene, School of Public Health, Tongji Medical College, Huazhong University of Science and Technology, Wuhan 430030, Hubei, P.R.China,4Department of Maternal and Child Health, School of Public Health, Tongji Medical College, Huazhong University of Science and Technology, Wuhan 430030, Hubei, P.R.China,5Department of Social Medicine and Health Management, School of Public Health, Tongji Medical College, Huazhong University of Science and Technology, Wuhan 430030, Hubei, P.R.China,6Department of Epidemiology and Biostatistics, School of Public Health, Tongji Medical College, Huazhong University of Science and Technology, Wuhan 430030, Hubei, P.R.China,7Physical Examination Center, Dongfeng Central Hospital, Dongfeng Motor Corporation, Shiyan, Hubei, 442008, Hubei, P.R.China,8Department of Clinic Teaching and Science, Dongfeng Central Hospital, Dongfeng Motor Corporation, Shiyan, Hubei, 442008, Hubei, P.R. China,9Department of Nutrition and Epidemiology, Harvard School of Public Health, Boston, 02115, Massachusetts, United States of America,10 Department of Cardiology, Dongfeng Central Hospital, Dongfeng Motor Corporation, Shiyan 442008, Hubei, China, P.R.China
☯These authors contributed equally to this work.
*[email protected](JY);[email protected](HDY)
Abstract
Hypoxia is a prominent characteristic of inflammatory tissue lesions. It can affect platelet
function. While mean platelet volume (MPV) and platelet distribution width (PDW) are
sam-ple platelet indices, they may reflect subcinical platelet activation. To investigated
associa-tions between adiposity indices and platelet indices, 17327 eligible individuals (7677 males
and 9650 females) from the Dongfeng-Tongji Cohort Study (DFTJ-Cohort Study, n=27009)
were included in this study, except for 9682 individuals with missing data on demographical,
lifestyle, physical indicators and diseases relative to PDW and MPV. Associations between
adiposity indices including waist circumstance (WC), waist-to-height ratio (WHtR), body
mass index (BMI), and MPV or PDW in the participants were analyzed using multiple
logis-tic regressions. There were significantly negative associations between abnormal PDW and
WC or WHtR for both sexes (
p
trend<
0.001 for all), as well as abnormal MPV and WC or
WHtR among female participants
(p
trend<
0.05 for all). In the highest BMI groups, only
fe-males with low MPV or PDW were at greater risk for having low MPV (OR=1.33, 95%
CI=1.10, 1.62
p
trend<
0.001) or PDW (OR=1.34, 95% CI=1.14, 1.58,
p
trend<
0.001) than
those who had low MPV or PDW in the corresponding lowest BMI group. The change of
PDW seems more sensitive than MPV to oxidative stress and hypoxia. Associations
a11111
OPEN ACCESS
Citation:Hou J, Liu C, Yao P, Chen W, He M, Wang
Y, et al. (2015) Association of Adiposity Indices with Platelet Distribution Width and Mean Platelet Volume in Chinese Adults. PLoS ONE 10(6): e0129677. doi:10.1371/journal.pone.0129677
Academic Editor:Shankuan Zhu, School of Public
Health, Zhejiang University, CHINA
Received:December 11, 2014
Accepted:May 12, 2015
Published:June 9, 2015
Copyright:© 2015 Hou et al. This is an open access
article distributed under the terms of theCreative Commons Attribution License, which permits unrestricted use, distribution, and reproduction in any medium, provided the original author and source are credited.
Data Availability Statement:All relevant data are
within the paper.
Funding:This work was supported by research
between reduced PDW and MPV values and WC, WHtR and BMI values in Chinese female
adults may help us to further investigate early changes in human body.
Introduction
Mean platelet volume (MPV) and platelet distribution width (PDW) are quantitative measures
of the variability in platelet size. They can be used in the assessment of platelet function [
1
].
Numerous studies indicated that low PDW and MPV were associated with a range of diseases,
including mild cognitive impairment, vascular dementia, Alzheimer
’
s disease, pulmonary
arte-rial hypertension and osteoporosis [
2
–
5
]. But high PDW and MPV were related to acute
myo-cardial infarction, unstable angina and vascular complications of diabetes [
6
–
8
]. Additionally,
low PDW may be a potential indicator for individuals with a high risk of mortality and 1-year
mortality in the elderly population [
9
]. A recent study suggested that platelet hyper-activation
could accelerate atherothrombosis which may be a result of the interaction among the features
clustering in obesity and metabolic syndrome [
10
]. However, no association was found
be-tween coronary artery disease and PDW or MPV, which may be due to the extent of coronary
artery disease in response to PDW and MPV levels [
11
].
Overweight and obesity are defined as abnormal or excessive fat accumulation. In recent
de-cades overweight and obesity have become critical public health issues in the world [
12
],
partic-ularly, in low-and middle-income countries [
13
]. In China, the prevalence of overweight
fluctuated between 8.0 and 17.1% for males and between 10.7 and 14.4% for females,
respec-tively; the prevalence of abdominal obesity did between 8.5 and 27.8% for males and between
27.8 and 45.9% for females, respectively, during 1993
–
2009 [
14
]. Numerous studies had
showed that individuals with abdominal obesity (clinically as central obesity) had greater risk
for type 2 diabetes mellitus, hypertension, cardiovascular disease and cancer than those with
general obesity [
15
], and platelet hyper-activation linked to central obesity in addition to
pro-moting oxidative stress and chronic inflammation in the body [
16
–
18
]. Waist circumference
(WC) as a simple and accurate anthropometric marker of abdominal obesity was easy to
per-form among subjects [
19
]. Waist-to-height ratio (WHtR) of a person is defined as the person's
waist circumference, divided by the person's height. It has been proposed as an alternative
an-thropometric index for assessing of central obesity with the exception for effects of age, sex and
race. The indicator of adiposity has recently emerged as an important marked to assess risk for
cardiometabolic diseases, because it avoided potential influences of confounding factors [
20
].
Thus, WHtR is thought to be more likely to give an accurate assessment of health, since core
body fat (abdominal obesity) is the most dangerous kind of body fat.
Accumulative evidence shows that obesity is associated with oxidative stress and chronic
inflammation in the body [
4
], while hypoxia is a prominent characteristic of adipose tissue
caused adipocyte dysfunction during obesity-related inflammation. Hypoxia linked to low
ox-ygen or hypoxia-mediated an inflammatory phenotype in perivascular adipose tissue and a
loss of the anticontractile properties [
21
], and increased in the multaneous consumption of
large platelets [
22
]. Involvement of obesity-related reactive oxygen species generation in the
regulations of proliferation, differentiation and maturation of megakaryocytes affected
plate-let production from megakaryocyte and plateplate-let activation state [
23
,
24
]. Weight loss reduced
oxidative stress and chronic inflammation in central obesity individuals who had lost about
10% of their initial body weight may be due to reduction of platelet activation and restoration
of sensitivity to the physiological antiaggregating agents [
18
,
21
], indicating that platelet
Corporation only provided support in the form of salaries for authors [J Zhu, XL Li, and HD Yang], but did not have any additional role in the study design, data collection and analysis, decision to publish, or preparation of the manuscript. The specific roles of these authors are articulated in the author contributions section.
Competing Interests:Co-authors Jiang Zhu, Xiulou
indices linked to overweight or obesity. The present study aimed to investigate associations
between adiposity indices and platelet indices using baseline data from the Dongfeng-Tongji
Cohort Study.
Methods
Ethics Statement
The study was approved by the Medical Research Ethics Committee of Tongji Medical College,
Huazhong University of Science and Technology. All participants provided written informed
consent.
Study population
Among participants (n = 27009) from the Dongfeng-Tongji (DFTJ) Cohort Study [
25
], 2893
individuals with missing data on the variables (including education, marital status, smoking
and drinking status, physical activity, doing housework, values of WC, height, weight, blood
pressure, PDW and MPV as well as personal diabetes mellitus, coronary heart disease, stroke
and myocardial infarction), as well as 6789 individuals with diabetes mellitus, coronary heart
disease, cancer and myocardial infarction were excluded from this study. Finally, a total of
17327 individuals (7677 males and 9650 females) were included in this study.
Data collection and variables
All participants were interviewed face-to-face with semi-structured questionnaires by the
trained interviewers; Data collection included personal socio-demographics (such as age,
gen-der, education and marital status), lifestyle factors (smoking status, passive smoke exposure,
drinking status, physical activity, doing housework) and personal medical history.
Anthropo-metric measurements such as height, weight and WC were taken in participants with light
in-door clothing and without shoes and physical examination (systolic and diastolic blood
pressures as well as heart rate) according to the standard methods during the healthy
examina-tion. Body mass index (BMI) was calculated by dividing weight in kilograms by height in
me-ters squared. Additionally, peripheral venous blood samples from individuals were obtained in
the vacutainer tubes containing an anticoagulant (ethylenediaminetetraacetic acid and sodium
citrate). PDW and MPV were measured using a fully automated analyzer (CELL-DYN 3700,
Abbott, USA). The PDW and MPV reference intervals for Chinese adults range from 15.0 to
17.0% and from 7 to 11 femtolitre (fl), respectively [
26
]. Central obesity was defined as WHtR
0.5 or WC
90 cm for men and
80 cm for women according to the international diabetes
foundation criteria published by the Internatdeional Diabetes Federation in 2005 [
27
,
28
].
Ac-cording to body mass index (BMI) classification reference intervals for overweight and obesity
Chinese adults, a BMI
<
24 kg/m
2is defined as non-obese, a BMI of 24
–
27.9 kilogram (kg)/m
2as overweight and a BMI of
28 kg/m
2as obese [
29
]. Hypertension was defined as a systolic
blood pressure
>
140 mmHg and/or a diastolic blood pressure
>
90 mmHg, or self-reported
hy-pertension history and taking antihypertensive medicine.
Statistical analysis
All data from the study participants were anonymized and de-identified prior to the analysis.
According to the reference intervals of PDW and MPV for Chinese adults, the participants
were classified into low (
<
15.0% for PDW and
<
7 fl for MPV), normal (15.0
–
17.0% for PDW
and 7
–
11 fl for MPV) and high (
>
17.0% for PDW and
>
11 fl for MPV) subgroups. To describe
for continuous variables and categorical variables, respectively. Chi-square test was used to
compare distributions of selected categorical variables. Kruskal-Wallis test was used to
com-pare abnormally distributed data including BMI, systolic and diastolic blood pressures.
Multi-variable logistic regression models were used to analyze associations between selected Multi-variables
and PDW or MPV in the subgroups. Participants were classified into the subgroups of males
and females by either WCs (males:
<
90, 90
–
, 95
–
,
100 cm; females:
<
80, 80
–
, 85
–
,
90 cm),
or WHtRs (
<
0.50, 0.50
–
, 0.55
–
,
0.60) or BMIs (
<
24, 24
–
, 26
–
,
28 kg/m
2). Statistical
signifi-cance was defined as
p
<
0.05. All statistic tests were performed using SPSS 12.0 software (SPSS,
Chicago, IL, USA).
Results
General characteristics
To judge whether there was a potential sample selection bias in this analysis, the comparisons
of basic characteristics between included and excluded populations were conducted prior to
the present analysis. The results showed that there was significant differences in certain
vari-ables between the included and excluded populations: age, education, smoking status, passive
smoke exposure, drinking status and doing housework, although the proportions are close
be-tween the populations (
p
<
0.01 for all).
As shown in Tables
1
and
2
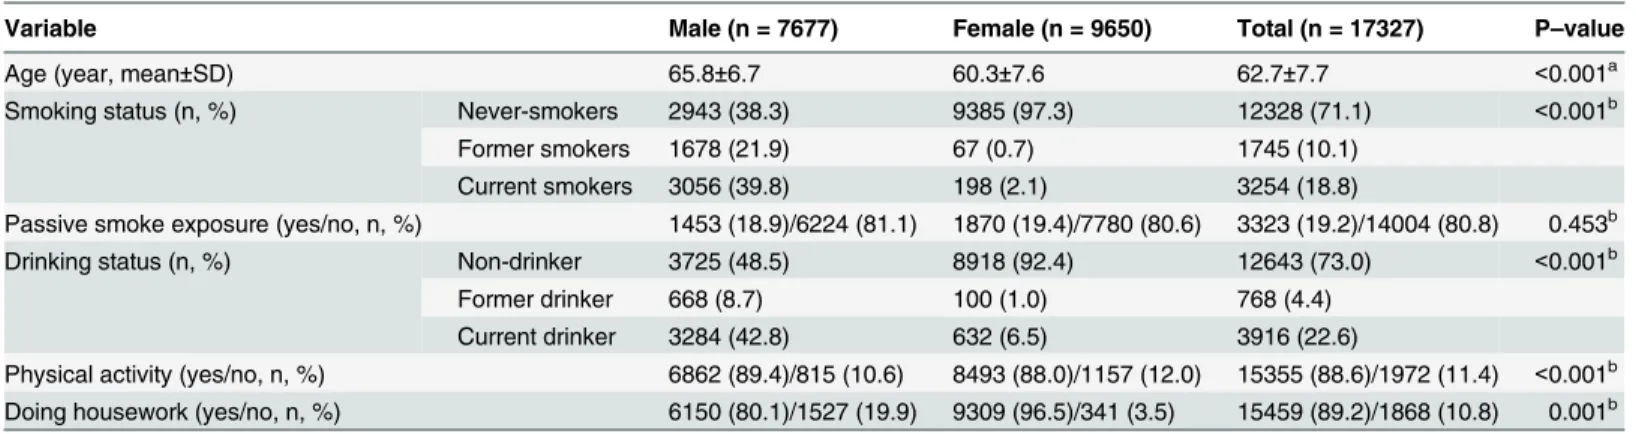
, the mean age of participants was 65.8 years for men and 60.3
years for women (
p
<
0.05). With the exception of passive smoke exposure, differences in the
proportions of smoking status, drinking status, physical activity, doing housework, WC,
WHtR, BMI, MPV, PDW as well as hypertension and hyperlipemia were found between the
two sexes (
p
<
0.01 for all).
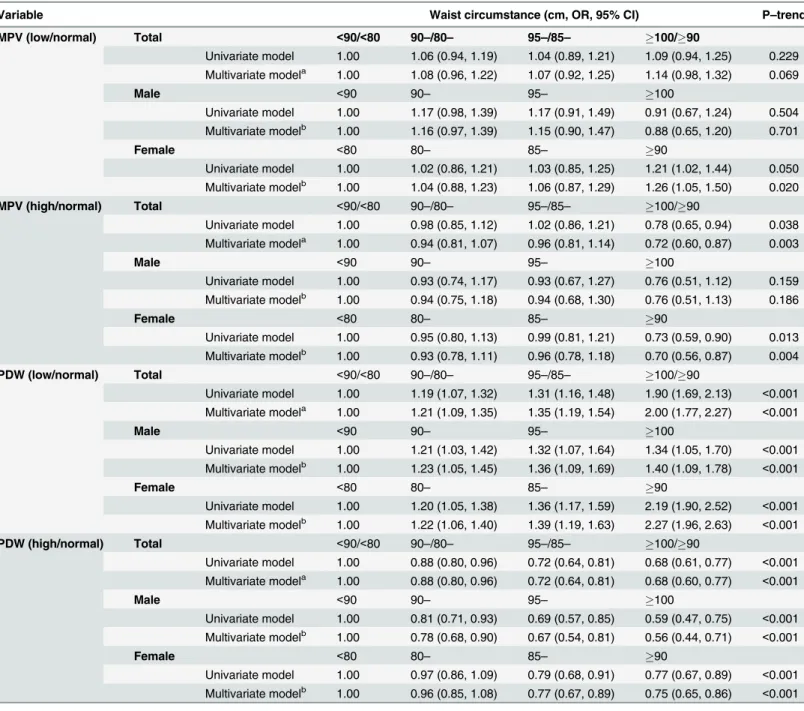
PDW, MPV and WC
As shown in
Table 3
, participants were classified into the subgroups based on gender and the
WC cut
–
off points of
<
90, 90
–
, 95
–
and
100 cm for males and
<
80, 80
–
, 85
–
,
90 cm for
fe-males. In the crude model, participants with low MPV or PDW in the highest WC group were
at a greater risk of having low MPV (odds ratio (OR): 1.09, 95% confidence interval (CI): 0.94,
1.25,
p
trend= 0.229) or PDW (OR: 1.90, 95%CI: 1.69, 2.13,
p
trend<
0.001) than those who had
low MPV or PDW in the corresponding lowest WC group; participants with high MPV or
Table 1. The socio-demographic and personal characteristics of participants.
Variable Male (n = 7677) Female (n = 9650) Total (n = 17327) P–value
Age (year, mean±SD) 65.8±6.7 60.3±7.6 62.7±7.7 <0.001a
Smoking status (n, %) Never-smokers 2943 (38.3) 9385 (97.3) 12328 (71.1) <0.001b
Former smokers 1678 (21.9) 67 (0.7) 1745 (10.1)
Current smokers 3056 (39.8) 198 (2.1) 3254 (18.8)
Passive smoke exposure (yes/no, n, %) 1453 (18.9)/6224 (81.1) 1870 (19.4)/7780 (80.6) 3323 (19.2)/14004 (80.8) 0.453b
Drinking status (n, %) Non-drinker 3725 (48.5) 8918 (92.4) 12643 (73.0) <0.001b
Former drinker 668 (8.7) 100 (1.0) 768 (4.4)
Current drinker 3284 (42.8) 632 (6.5) 3916 (22.6)
Physical activity (yes/no, n, %) 6862 (89.4)/815 (10.6) 8493 (88.0)/1157 (12.0) 15355 (88.6)/1972 (11.4) <0.001b
Doing housework (yes/no, n, %) 6150 (80.1)/1527 (19.9) 9309 (96.5)/341 (3.5) 15459 (89.2)/1868 (10.8) 0.001b aStudent
’s t–test was used to compare the mean values of continuous variables.
bThe Chi
PDW in the highest WC group were at a lower risk of having high MPV (OR: 0.78, 95%CI:
0.65, 0.94,
p
trend= 0.038) or PDW (OR: 0.68, 95%CI: 0.61, 0.77,
p
trend<
0.001) than those who
had low MPV or PDW in the corresponding lowest WC groups. After adjusting for gender,
age, smoking status, passive smoke exposure, drinking status, physical activity, doing
house-work, hypertension and self-reported hyperlipemia, participants with low MPV or PDW in the
highest WC group were at a greater risk of having low MPV (OR: 1.14, 95% CI: 0.98, 1.32,
p
trend= 0.069) or PDW (OR: 2.00, 95% CI: 1.77, 2.27,
p
trend<
0.001) than those who had low MPV or
PDW in the corresponding lowest WC group; participants with high MPV (OR: 0.72, 95% CI:
0.60, 0.87,
p
trend= 0.02) or PDW (OR: 0.68, 95% CI: 0.60, 0.77,
p
trend<
0.001) in the highest
WC group were at a lower risk for having high MPV or PDW than those who had high MPV
or PDW in the corresponding lowest WC groups. Both sexes with low PDW in the highest WC
groups were at a greater risk of having high PDW (OR: 1.40, 95% CI: 1.09, 1.78 for males,
p
trend<
0.001; OR: 2.27, 95% CI: 1.96, 2.63 for females,
p
trend<
0.001) than those who had low
PDW in the corresponding lowest WC groups; whereas female participants with high MPV or
PDW in the highest WC groups were at a lower risk of having high MPV (OR: 0.70, 95% CI:
0.56, 0.87,
p
trend= 0.003) or PDW (OR: 0.75, 95% CI: 0.65, 0.86,
p
trend<
0.001) than those who
had high MPV or PDW in the corresponding lowest WC groups. Additionally, in the highest
WC groups only female participants with low MPV were at a greater risk of having low MPV
(OR: 1.26, 95% CI: 1.05, 1.50,
p
trend= 0.004) than those who had low MPV in the
correspond-ing lowest WC groups.
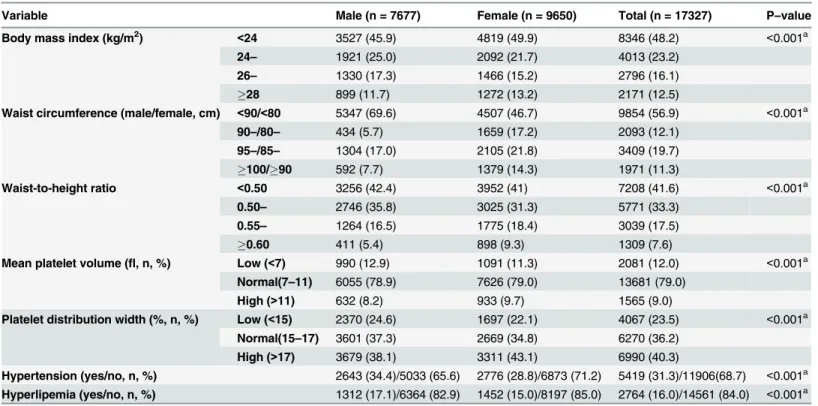
Table 2. Distributions of clinical variables of participants.
Variable Male (n = 7677) Female (n = 9650) Total (n = 17327) P–value
Body mass index (kg/m2)
<24 3527 (45.9) 4819 (49.9) 8346 (48.2) <0.001a
24– 1921 (25.0) 2092 (21.7) 4013 (23.2)
26– 1330 (17.3) 1466 (15.2) 2796 (16.1)
28 899 (11.7) 1272 (13.2) 2171 (12.5)
Waist circumference (male/female, cm) <90/<80 5347 (69.6) 4507 (46.7) 9854 (56.9) <0.001a
90–/80– 434 (5.7) 1659 (17.2) 2093 (12.1)
95–/85– 1304 (17.0) 2105 (21.8) 3409 (19.7)
100/90 592 (7.7) 1379 (14.3) 1971 (11.3)
Waist-to-height ratio <0.50 3256 (42.4) 3952 (41) 7208 (41.6) <0.001a
0.50– 2746 (35.8) 3025 (31.3) 5771 (33.3)
0.55– 1264 (16.5) 1775 (18.4) 3039 (17.5)
0.60 411 (5.4) 898 (9.3) 1309 (7.6)
Mean platelet volume (fl, n, %) Low (<7) 990 (12.9) 1091 (11.3) 2081 (12.0) <0.001a
Normal(7–11) 6055 (78.9) 7626 (79.0) 13681 (79.0)
High (>11) 632 (8.2) 933 (9.7) 1565 (9.0)
Platelet distribution width (%, n, %) Low (<15) 2370 (24.6) 1697 (22.1) 4067 (23.5) <0.001a
Normal(15–17) 3601 (37.3) 2669 (34.8) 6270 (36.2)
High (>17) 3679 (38.1) 3311 (43.1) 6990 (40.3)
Hypertension (yes/no, n, %) 2643 (34.4)/5033 (65.6) 2776 (28.8)/6873 (71.2) 5419 (31.3)/11906(68.7) <0.001a
Hyperlipemia (yes/no, n, %) 1312 (17.1)/6364 (82.9) 1452 (15.0)/8197 (85.0) 2764 (16.0)/14561 (84.0) <0.001a
fl= femtolitre.
Subjects were divided into three subgroups according to the reference ranges for Chinese adults: low (<15%), normal (15–17%) and high (>17%) for
platelet distribution width value, as well as low (<7fl), normal (7–11fl) and high (>11fl) for mean platelet volume value, respectively.
aThe Chi
Table 3. Association between waist circumstance values and platelet indices among 17327 participants.
Variable Waist circumstance (cm, OR, 95% CI) P–trend
MPV (low/normal) Total <90/<80 90–/80– 95–/85– 100/90
Univariate model 1.00 1.06 (0.94, 1.19) 1.04 (0.89, 1.21) 1.09 (0.94, 1.25) 0.229 Multivariate modela 1.00 1.08 (0.96, 1.22) 1.07 (0.92, 1.25) 1.14 (0.98, 1.32) 0.069
Male <90 90– 95– 100
Univariate model 1.00 1.17 (0.98, 1.39) 1.17 (0.91, 1.49) 0.91 (0.67, 1.24) 0.504 Multivariate modelb 1.00 1.16 (0.97, 1.39) 1.15 (0.90, 1.47) 0.88 (0.65, 1.20) 0.701
Female <80 80– 85– 90
Univariate model 1.00 1.02 (0.86, 1.21) 1.03 (0.85, 1.25) 1.21 (1.02, 1.44) 0.050 Multivariate modelb 1.00 1.04 (0.88, 1.23) 1.06 (0.87, 1.29) 1.26 (1.05, 1.50) 0.020
MPV (high/normal) Total <90/<80 90–/80– 95–/85– 100/90
Univariate model 1.00 0.98 (0.85, 1.12) 1.02 (0.86, 1.21) 0.78 (0.65, 0.94) 0.038 Multivariate modela 1.00 0.94 (0.81, 1.07) 0.96 (0.81, 1.14) 0.72 (0.60, 0.87) 0.003
Male <90 90– 95– 100
Univariate model 1.00 0.93 (0.74, 1.17) 0.93 (0.67, 1.27) 0.76 (0.51, 1.12) 0.159 Multivariate modelb 1.00 0.94 (0.75, 1.18) 0.94 (0.68, 1.30) 0.76 (0.51, 1.13) 0.186
Female <80 80– 85– 90
Univariate model 1.00 0.95 (0.80, 1.13) 0.99 (0.81, 1.21) 0.73 (0.59, 0.90) 0.013 Multivariate modelb 1.00 0.93 (0.78, 1.11) 0.96 (0.78, 1.18) 0.70 (0.56, 0.87) 0.004
PDW (low/normal) Total <90/<80 90–/80– 95–/85– 100/90
Univariate model 1.00 1.19 (1.07, 1.32) 1.31 (1.16, 1.48) 1.90 (1.69, 2.13) <0.001
Multivariate modela 1.00 1.21 (1.09, 1.35) 1.35 (1.19, 1.54) 2.00 (1.77, 2.27) <0.001
Male <90 90– 95– 100
Univariate model 1.00 1.21 (1.03, 1.42) 1.32 (1.07, 1.64) 1.34 (1.05, 1.70) <0.001
Multivariate modelb 1.00 1.23 (1.05, 1.45) 1.36 (1.09, 1.69) 1.40 (1.09, 1.78) <0.001
Female <80 80– 85– 90
Univariate model 1.00 1.20 (1.05, 1.38) 1.36 (1.17, 1.59) 2.19 (1.90, 2.52) <0.001
Multivariate modelb 1.00 1.22 (1.06, 1.40) 1.39 (1.19, 1.63) 2.27 (1.96, 2.63) <0.001
PDW (high/normal) Total <90/<80 90–/80– 95–/85– 100/90
Univariate model 1.00 0.88 (0.80, 0.96) 0.72 (0.64, 0.81) 0.68 (0.61, 0.77) <0.001
Multivariate modela 1.00 0.88 (0.80, 0.96) 0.72 (0.64, 0.81) 0.68 (0.60, 0.77) <0.001
Male <90 90– 95– 100
Univariate model 1.00 0.81 (0.71, 0.93) 0.69 (0.57, 0.85) 0.59 (0.47, 0.75) <0.001
Multivariate modelb 1.00 0.78 (0.68, 0.90) 0.67 (0.54, 0.81) 0.56 (0.44, 0.71) <0.001
Female <80 80– 85– 90
Univariate model 1.00 0.97 (0.86, 1.09) 0.79 (0.68, 0.91) 0.77 (0.67, 0.89) <0.001
Multivariate modelb 1.00 0.96 (0.85, 1.08) 0.77 (0.67, 0.89) 0.75 (0.65, 0.86) <0.001 95%CI: 95% confidence interval;fl= femtolitre; MPV: mean platelet volume; PDW: platelet distribution width; OR: odds ratio.
Subjects were divided into three subgroups according to the reference ranges for Chinese adults: low (<15%), normal (15–17%) and high (>17%) for
platelet distribution width value, and mean platelet volume is low (<7fl), normal (7–11fl) and high (>11fl) for mean platelet volume value, respectively.
Subjects were divided into four subgroups according to waist circumstance levels in sex-based groups. The cut-off points of waist circumstance were<90,
90–, 95—and100 cm for male, and<80, 80–, 85—and90 cm for female, respectively.
aAdjusted for age (continuous), gender, smoking status, passive smoke exposure, drinking status, physical activity, doing housework, hyperlipemia and hypertension
bAdjusted for age (continuous), smoking status, passive smoke exposure, drinking status, physical activity, doing housework, hyperlipemia and hypertension.
PDW, MPV and WHtR
As shown in
Table 4
, participants were classified into the subgroups based on gender and the
WHtR cut
–
off points of
<
0.50, 0.50
–
, 0.55
—
and
0.60. In the crude model, participants with
low MPV or PDW in the highest WHtR groups were at a greater risk of having low MPV (OR:
1.38, 95% CI: 1.17, 1.64,
p
trend<
0.001) or PDW (OR: 2.32, 95%CI: 2.01, 2.68,
p
trend<
0.001) than
those who had low MPV or PDW in the corresponding lowest WHtR groups; participants with
high MPV or PDW in the highest WHtR group were at a lower risk of having high MPV (OR:
0.75, 95% CI: 0.60, 0.94,
p
trend= 0.022) or PDW (OR: 0.64, 95% CI: 0.55, 0.74,
p
trend<
0.001) than
those who had high MPV or PDW in the corresponding lowest WHtR groups. After adjusting
for gender, age, marital status, education levels, smoking status, passive smoke exposure,
drink-ing status, physical activity, dodrink-ing housework, hypertension and self-reported hyperlipemia, in
Table 4. Association between waist—to—height ratio and platelet indices among 17327 participants.
Variable Waist-to-height ratio (OR, 95% CI) P–trend
<0.50 0.50– 0.55– 0.60
MPV (low/normal) Total Univariate model 1.00 1.06 (0.95, 1.19) 1.24 (1.09, 1.41) 1.38 (1.17, 1.64) <0.001
Multivariate modela 1.00 1.06 (0.95, 1.18) 1.26 (1.10, 1.43) 1.42 (1.19, 1.70) <0.001 Male Univariate model 1.00 1.04 (0.89, 1.22) 1.40 (1.16, 1.68) 1.17 (0.86, 1.58) 0.004 Multivariate modelb 1.00 1.04 (0.89, 1.22) 1.37 (1.14, 1.66) 1.12 (0.82, 1.52) 0.011
Female Univariate model 1.00 1.08 (0.92, 1.25) 1.13 (0.95, 1.36) 1.54 (1.25, 1.90) <0.001
Multivariate modelb 1.00 1.11 (0.95, 1.29) 1.21 (1.00, 1.46) 1.68 (1.34, 2.09) <0.001
MPV (high/normal) Total Univariate model 1.00 1.02 (0.91, 1.15) 0.91 (0.78, 1.06) 0.75 (0.60, 0.94) 0.022
Multivariate modela 1.00 1.02 (0.90, 1.15) 0.89 (0.76, 1.04) 0.72 (0.57, 0.91) <0.001 Male Univariate model 1.00 1.06 (0.88, 1.27) 0.93 (0.73, 1.20) 0.86 (0.58, 1.28) 0.495 Multivariate modelb 1.00 1.06 (0.88, 1.27) 0.95 (0.74, 1.22) 0.86 (0.58, 1.30) 0.557
Female Univariate model 1.00 1.00 (0.86, 1.18) 0.88 (0.73, 1.07) 0.68 (0.51, 0.90) 0.011
Multivariate modelb 1.00 0.98 (0.84, 1.15) 0.84 (0.69, 1.03) 0.65 (0.48, 0.87) 0.004
PDW (low/normal) Total Univariate model 1.00 1.20 (1.09, 1.32) 1.48 (1.33, 1.65) 2.32 (2.01, 2.68) <0.001
Multivariate modela 1.00 1.22 (1.11, 1.34) 1.53 (1.36, 1.71) 2.46 (2.12, 2.85) <0.001 Male Univariate model 1.00 1.15 (1.00, 1.33) 1.32 (1.12, 1.56) 1.86 (1.45, 2.39) <0.001
Multivariate modelb 1.00 1.17 (1.01, 1.35) 1.37 (1.15, 1.62) 1.97 (1.52, 2.54) <0.001
Female Univariate model 1.00 1.23 (1.09, 1.40) 1.61 (1.39, 1.86) 2.60 (2.18, 3.10) <0.001
Multivariate modelb 1.00 1.27 (1.11, 1.44) 1.69 (1.46, 1.97) 2.82 (2.34, 3.39) <0.001
PDW (high/normal) Total Univariate model 1.00 0.93 (0.86, 1.00) 0.72 (0.66, 0.80) 0.64 (0.55, 0.74) <0.001
Multivariate modela 1.00 0.89 (0.83, 0.97) 0.69 (0.62, 0.76) 0.61 (0.52, 0.71) <0.001 Male Univariate model 1.00 0.93 (0.83, 1.04) 0.62 (0.53, 0.72) 0.59 (0.46, 0.76) <0.001
Multivariate modelb 1.00 0.89 (0.79, 1.00) 0.57 (0.49, 0.67) 0.54 (0.42, 0.70) <0.001
Female Univariate model 1.00 0.91 (0.82, 1.01) 0.82 (0.72, 0.94) 0.69 (0.57, 0.84) <0.001
Multivariate modelb 1.000 0.89 (0.80, 0.99) 0.79 (0.68, 0.90) 0.65 (0.54, 0.79) <0.001 95%CI: 95% confidence interval;fl= femtolitre; MPV: mean platelet volume; PDW: platelet distribution width; OR: odds ratio.
Subjects were divided into three subgroups according to the reference ranges for Chinese adults: low (<15%), normal (15–17%) and high (>17%) for
platelet distribution width, as well as low (<7fl), normal (7–11fl), high (>11fl) for mean platelet volume, respectively.
The subjects were divided into four groups according to waist—to—height ratios:<0.50, 0.50–, 0.55—and0.60.
aAdjusted for age (continuous), gender, smoking status, passive smoke exposure, drinking status, physical activity, doing housework, hyperlipemia and hypertension.
bAdjusted for age (continuous), smoking status, passive smoke exposure, drinking status, physical activity, doing housework, hyperlipemia and hypertension.
the highest WHtR groups, participants with low MPV or PDW were at a greater risk of having
low MPV (OR: 1.42, 95% CI: 1.19, 1.70,
p
trend<
0.001) or PDW (OR: 2.46, 95% CI: 2.12, 2.85,
p
trend<
0.001) than those who had low MPV or PDW in the corresponding lowest WHtR groups,
whereas participants with high MPV or PDW were at a lower risk of having high MPV (OR:
0.72, 95% CI: 0.57, 0.91,
p
trend<
0.001) or PDW (OR: 0.61, 95% CI: 0.52, 0.71,
p
trend<
0.001) than
those who had high MPV or PDW in the corresponding lowest WHtR groups, both sexes with
low PDW were at a greater risk of having low PDW (OR: 1.97, 95% CI: 1.52, 2.54,
p
trend<
0.001
for males; OR: 2.82, 95% CI: 2.54, 3.39,
p
trend<
0.001 for females) than those who had low PDW
in the corresponding lowest WHtR groups. In the highest WHtR groups, only female
partici-pants with high MPV or PDW were found to be at a lower risk of having high MPV (OR: 0.65,
95% CI: 0.48, 0.87,
p
trend= 0.004) or PDW (OR: 0.65, 95% CI: 0.54, 0.79,
p
trend<
0.001) compared
with those who had high MPV or PDW in the corresponding lowest WHtR groups, whereas,
only female participants with low MPV were at a greater risk of having low MPV (OR: 1.68,
95% CI: 1.34, 2.09,
p
trend<
0.001) than those who had low MPV in the corresponding lowest
WHtR groups.
PDW, MPV and BMI
As shown in
Table 5
, participants were classified into two subgroups based on gender and the
BMI cut
–
off points of
<
24, 24
–
, 26
–
, and
28 kg/m
2. In crude model, in the highest BMI
group, participants with low MPV or PDW were at a greater risk of having low MPV (OR:
1.21, 95% CI: 1.05, 1.39,
p
trend= 0.002) or PDW (OR: 1.25, 95% CI: 1.10, 1.41,
p
trend<
0.001)
than those who had low MPV or PDW in the corresponding lowest BMI group, but
partici-pants with high PDW were at a greater risk for having high PDW (OR: 1.34, 95% CI: 1.14,
1.57,
p
trend<
0.001) than those who had high PDW in the corresponding the lowest BMI group.
No significant change was observed, after adjusting for gender, age, marital status, education
levels, smoking status, passive smoke exposure, drinking status, physical activity, doing
house-work, hypertension and self-reported hyperlipemia. In the highest BMI groups only females
with low MPV or PDW were at a greater risk for having low MPV (OR: 1.33, 95% CI: 1.10,
1.62,
p
trend<
0.001) or PDW (OR: 1.34, 95% CI: 1.14, 1.58,
p
trend<
0.001) than those who had
low MPV in the corresponding lowest BMI groups.
Discussion
Previous studies had reported that MPV and PDW could predict activation of coagulation
more efficiently [
1
], moreover, central obesity (the principal symptom of metabolic syndrome)
individuals could be at higher risk of obesity-related chronic diseases compared with those
who had general obesity [
15
], moreover, MPV was inversely associated with metabolic
syn-drome [
30
]. The findings showed that participants with higher BMI were at a greater risk of
having low MPV and PDW values, and participants with higher WHtR or WC had abnormal
MPV and PDW values, implying that WHtR or WC may be a sensitive indicator for reflecting
obesity-related chronic diseases in relation to abnormal platelet activity. Further the results
from the multiple linear regression analysis indicated that in female participants, the values of
MPV and PDW were reduced 1.9% amd 2.9%, every increase in BMI of 10kg/m
2, 1.3% and
3.6% every increase in WC of 10cm and 2.4% and 6.3% every increase in WHtR of 10% (data
not shown).
from the study, obesity in relation to reduced MPV and PDW values may attribute to a
physio-logical change of platelet counts.
Multiple studies suggested that reduced MPV and PDW may result from induced
inflam-mation involved in certain diseases such as mild cognitive impairment and AD [
3
]. Multiple
factors including Interleukin-1 alpha, interleukin-3, epidermal growth factor, tumor necrosis
factor-alpha and granulocyte colony-stimulating factor had a high accuracy (96%) to predict
clinical AD [
32
]. In this study, more than 90% of the participants aged 45 and over, which may
contribute to increase risk of overweight or obesity, because increased obesity among the
mid-dle and old aged people (40
–
59 years) was obviously contributed to the prevalences of AD and
dementia [
33
]. Thus, the possible reasons for reduced MPV and PDW relating to inflammation
may be that adiposity tissue secreted a variety of adipokines, cytokines (such as leptin,
adipo-nectin, interleukin-6, interleukin-1, and tumor necrosis factor- alpha) and pro-inflammatory
Table 5. Association between body index mass and platelet indices among 17327 participants.
Variable Body mass index (kg/m2, OR, 95% CI)) P–trend
<24 24– 26– 28
MPV (low/normal) Total Univariate model 1.00 0.94 (0.83, 1.06) 1.17 (1.03, 1.33) 1.21 (1.05, 1.39) 0.002
Multivariate modela 1.00 0.93 (0.82, 1.04) 1.16 (1.01, 1.32) 1.20 (1.04, 1.39) 0.004 Male Univariate model 1.00 0.83 (0.70, 0.98) 1.04 (0.86, 1.25) 1.10 (0.89, 1.36) 0.420 Multivariate modelb 1.00 0.83 (0.70, 0.99) 1.05 (0.87, 1.27) 1.08 (0.87, 1.35) 0.456
Female Univariate model 1.00 1.03 (0.87, 1.22) 1.28 (1.07, 1.53) 1.31 (1.08, 1.58) 0.001
Multivariate modelb 1.00 1.04 (0.88, 1.23) 1.30 (1.08, 1.56) 1.33 (1.10, 1.62) <0.001
MPV (high/normal) Total Univariate model 1.00 1.02 (0.89, 1.16) 1.00 (0.86, 1.17) 1.08 (0.92, 1.28) 0.447
Multivariate modela 1.00 1.02 (0.89, 1.16) 1.00 (0.85, 1.16) 1.07 (0.91, 1.27) 0.523 Male Univariate model 1.00 1.03 (0.84, 1.26) 1.10 (0.87, 1.38) 1.23 (0.95, 1.59) 0.123 Multivariate modelb 1.00 1.01 (0.82, 1.24) 1.10 (0.87, 1.40) 1.23 (0.95, 1.61) 0.119
Female Univariate model 1.00 1.04 (0.87, 1.25) 0.95 (0.78, 1.17) 1.00 (0.81, 1.23) 0.845
Multivariate modelb 1.00 1.02 (0.85, 1.21) 0.93 (0.75, 1.14) 0.98 (0.79, 1.22) 0.647
PDW (low/normal) Total Univariate model 1.00 1.07 (0.97, 1.18) 1.14 (1.02, 1.28) 1.25 (1.10, 1.41) <0.001
Multivariate modela 1.00 1.06 (0.96, 1.18) 1.14 (1.02, 1.28) 1.26 (1.11, 1.43) <0.001 Male Univariate model 1.00 1.00 (0.86, 1.16) 0.98 (0.83, 1.17) 1.13 (0.92, 1.37) 0.429 Multivariate modelb 1.00 1.00 (0.86, 1.17) 1.00 (0.84, 1.19) 1.16 (0.94, 1.42) 0.615
Female Univariate model 1.00 1.12 (0.98, 1.29) 1.28 (1.10, 1.49) 1.34 (1.14, 1.57) <0.001
Multivariate modelb 1.00 1.12 (0.97, 1.28) 1.26 (1.08, 1.47) 1.34 (1.14, 1.58) <0.001
PDW (high/normal) Total Univariate model 1.00 1.07 (0.98, 1.17) 1.08 (0.98, 1.19) 1.15 (1.03, 1.28) 0.006
Multivariate modela 1.00 1.04 (0.95, 1.14) 1.05 (0.95, 1.16) 1.13 (1.01, 1.26) 0.043 Male Univariate model 1.00 1.06 (0.94, 1.21) 1.07 (0.93, 1.24) 1.11 (0.94, 1.32) 0.150 Multivariate modelb 1.00 1.02 (0.90, 1.16) 1.02 (0.88, 1.18) 1.05 (0.88, 1.24) 0.299
Female Univariate model 1.00 1.05 (0.93, 1.18) 1.06 (0.93, 1.22) 1.18 (1.02, 1.36) 0.028
Multivariate modelb 1.00 1.06 (0.94, 1.19) 1.07 (0.93, 1.22) 1.19 (1.02, 1.37) 0.027 95%CI: 95% confidence interval;fl= femtolitre; MPV: mean platelet volume; PDW: platelet distribution width; OR: odds ratio.
Subjects were divided into three subgroups according to the reference ranges for Chinese adults: low (<15%), normal (15–17%) and high (>17%) for
platelet distribution width value, as well as low (<7fl), normal (7–11fl) and high (>11fl) for mean platelet volume value, respectively.
The subjects were divided into four groups according to body mass index:<24 kg/m2, 24 kg/m2–, 26 kg/m2–,28 kg/m2.
aAdjusted for age (continuous), gender, smoking status, passive smoke exposure, drinking status, physical activity, doing housework, hyperlipemia and hypertension.
bAdjusted for age (continuous), smoking status, passive smoke exposure, drinking status, physical activity, doing housework, hyperlipemia and hypertension.
cytokines, which could lead to chronic low
—
grade inflammation [
16
]. Furthermore, reduced
MPV and PDW were related to increased consumption of large platelets, which was probably
due to vasculature inflammation [
2
,
22
]. In obese individuals, adipose tissue hypoxia may
in-duce dysregulate adipocytokines production involved in excessive ROS generation and vascular
inflammation [
21
,
23
,
24
]. A few studies have recently reported that hypoxia and ROS were
re-lated to platelet activation or platelet generation and thereby may affect proliferation and
dif-ferentiation of megakaryocytes [
24
,
34
]. Platelet formation is the consequence of caspase
activation within megakaryocytes [
24
]. Chronic hypoxia accelerated the proliferation and
dif-ferentiation of megakaryocytes in bone marrow and increased their functional activity [
34
],
probably thereby reduced MPV and PDW values. Moreover, ROS increased platelet activation
and aggregation with vascular endothelial layer damaged and caused increase in impaired
pro-duction of platelets, whereas, low MPV was associated with impaired propro-duction rather than
increased destruction of platelet [
35
]. Our results indicated that obesity individuals had an
ob-vious abnormal change in PDW rather than MPV, in addition to PDW as a reliable indicator
to identify hyperdestructive and hypoproductive thrombocytopenia [
36
]. With the addition of
certain diseases relating to abnormal MPV and PDW, genetic factor was also a major
determi-nant for MPV and PDW values, because genetic variation accounted for 69.0% for MPV and
34% for PDW, respectively [
37
].
The combined measurement of BMI and WC is the simple and inexpensive anthropometric
measurement. It is well known that physical indices of obesity related to risk of certain diseases
including hypertension, type-2 diabetes, and/or dyslipidema. A previous study reported that
BMI and WC are important predictors for obesity in Chinese in addition to WHtR [
38
].
Addi-tionally, studies showed that mean body weight has increased dramatically in older people
ei-ther in Western conturies or in Asia [
39
], whereas increased central body fat was inversely
associated with bone mineral density relating to reduced PDW and MPV values [
5
,
40
]. Thus,
weight is one of osteoporosis risk factors in obese people. However, we did not know whether
there is difference in adverse biological effects in response to these indices between both sexes.
The present study implied that females with higher BMI (greater than or equal to 26) seem to
be at greater risk for abnormal values of platelet indices rather than males, which may link to
potential differences in metabolic, behavioral and psychosocial factors between both sexes.
WHtR or WC is more accuracy than BMI in response to adipose tissue accumulation in the
upper body (abdominal obesity). We found strong associations between WC, WHtR or BMI
and abnormal MPV or PDW among women rather than men. A possible reason for gender
dif-ferences in obesity is that Chinese women may tend to have a higher fat percentage than
Chi-nese men [
41
]. Furthermore, abdominal obesity in Chinese adults has been given greater
concern rather than general obesity. Changes in dietary patterns, nutritional status and
physi-cal activity may be the major reasons for increased risk for general overweight, obesity and
ab-dominal obesity in Chinese adults [
14
,
42
]. Thus, public health prevention strategies in China
are required to modify health behaviors in order to control obesity-related outcomes, to
de-crease risk for obesity-related diseases including AD, mild cognitive impairment and dementia
[
33
,
43
].
excluded individuals were higher than those in former smokers (16.3%) and drinkers (17.7%)
in the included ones (data not shown). Thus, it should be cautious for us to explain the results.
Conclusions
WC and WHtR were more sensitive rather than BMI to reflect changes of MPV and PDW
val-ues, the pattern of change in WC and WHtR may imply the occurrence of subclinical
symp-toms. The females with high BMI values along with reduced MPV or PDW values may have a
potential risk of developing certain diseases.
Acknowledgments
The authors would like to thank the participants of the DFTJ-Cohort Study for their
coopera-tion and the staff of the Health Examinacoopera-tion Center of the Dongfeng Central Hospital and the
Medical Insurance Center of Dongfeng Motor Corporation for their assistance and support in
data collection.
Author Contributions
Conceived and designed the experiments: HY FBH TCW WHC JY. Performed the
experi-ments: MAH YJW PY WMF YL XPM SW TX JZ XLL JY. Analyzed the data: JH CYL PY TX
JY. Contributed reagents/materials/analysis tools: HDY JZ XLL. Wrote the paper: JH CYL PY
HDY JY.
References
1. Vagdatli E, Gounari E, Lazaridou E, Katsibourlia E, Tsikopoulou F, Labrianou I, et al. Platelet distribu-tion width: a simple, practical and specific marker of activadistribu-tion of coaguladistribu-tion. Hippokratia 2010; 14: 28–32. PMID:20411056
2. Arslan D, Cimen D, Guvenc O, Kaya F, Sert A, Oran B. Platelet distribution width and mean platelet vol-ume in children with pulmonary arterial hypertension secondary to congenital heart disease with left-to-right shunt: new indices of severity? Pediatr Cardiol. 2013; 34: 1013–1016. doi: 10.1007/s00246-012-0600-5PMID:23254645
3. Wang RT, Jin D, Li Y, Liang QC. Decreased mean platelet volume and platelet distribution width are as-sociated with mild cognitive impairment and Alzheimer's disease. J Psychiatr Res. 2013; 47: 644–649.
doi:10.1016/j.jpsychires.2013.01.014PMID:23395109
4. Liang QC, Jin D, Li Y, Wang RT. Mean platelet volume and platelet distribution width in vascular de-mentia and Alzheimer's disease. Platelets. 2014; 25: 433–438. doi:10.3109/09537104.2013.831064
PMID:24175580
5. Akbal A, Gökmen F, Gencer M,İnceer B, Kömürcü E. Mean platelet volume and platelet distribution width can be related to bone mineralization. Osteoporos Int. 2014; 25: 2291–2295. doi:10.1007/ s00198-014-2764-8PMID:24923794
6. Gupta S, Saxena SK, Lalchandani A, Chandra R, Gupta AC, Mishra MP, et al. Significance of Platelet Volume Indices in Patients of Coronary Artery Diseases (Cad) and Acute Myocardial Infarction (MI): A New Predictor For Ihd. Indian J Cardiol 2012; 15: 22–25
7. Khode V, Sindhur J, Kanbur D, Ruikar K, Nallulwar S. Mean platelet volume and other platelet volume indices in patients with stable coronary artery disease and acute myocardial infarction: A case control study. J Cardiovasc Dis Res. 2012; 3: 272–275. doi:10.4103/0975-3583.102694PMID:23233769 8. Jindal S, Gupta S, Gupta R, Kakkar A, Singh HV, Gupta K, et al. Platelet indices in diabetes mellitus:
in-dicators of diabetic microvascular complications. Hematology. 2011; 16: 86–89. doi:10.1179/ 102453311X12902908412110PMID:21418738
9. de Gonzalo-Calvo D, de Luxán-Delgado B, Rodríguez-González S, García-Macia M, Suárez FM, Solano JJ, et al. Platelet distribution width is associated with 1-year all-cause mortality in the elderly population. Journal of Clinical Gerontology and Geriatrics. 2012; 4: 12–16.
11. De Luca G, Secco GG, Verdoia M, Cassetti E, Schaffer A, Coppo L, et al. Combination between mean platelet volume and platelet distribution width to predict the prevalence and extent of coronary artery disease: results from a large cohort study. Blood Coagul Fibrinolysis. 2014; 25: 86–91. doi:10.1097/ MBC.0b013e32836577a8PMID:24126247
12. Finucane MM, Stevens GA, Cowan MJ, Danaei G, Lin JK, Paciorek CJ, et al. National, regional, and global trends in body-mass index since 1980: systematic analysis of health examination surveys and epidemiological studies with 960 country-years and 9.1 million participants. Lancet. 2011; 377: 557–
567. doi:10.1016/S0140-6736(10)62037-5PMID:21295846
13. Popkin BM, Slining MM. New dynamics in global obesity facing low—and middle—Income countries.
Obes Rev 2013; 14: 11–20. doi:10.1111/obr.12102PMID:24102717
14. Xi B, Liang Y, He T, Reilly K, Hu Y, Wang Q, et al. Secular trends in the prevalence of general and ab-dominal obesity among Chinese adults, 1993–2009. Obes Rev. 2012; 13: 287–296. doi:10.1111/j. 1467-789X.2011.00944.xPMID:22034908
15. Gutiérrez-Fisac JL, Guallar-Castillón P, León-Muñoz LM, Graciani A, Banegas JR, Rodríguez-Artalejo
F, et al. Prevalence of general and abdominal obesity in the adult population of Spain, 2008–2010: the
ENRICA study. Obes Rev. 2012; 13: 388–392. doi:10.1111/j.1467-789X.2011.00964.xPMID: 22151906
16. Fernández-Sánchez A, Madrigal-Santillán E, Bautista M, Esquivel-Soto J, Morales-González Á, Esqui-vel-Chirino C, et al. Inflammation, oxidative stress, and obesity. Int J Mol Sci. 2011; 12: 3117–3132. doi: 10.3390/ijms12053117PMID:21686173
17. Samad F, Ruf W. Inflammation, obesity, and thrombosis. Blood. 2013; 122: 3415–3422. doi:10.1182/ blood-2013-05-427708PMID:24092932
18. Anfossi G, Russo I, Trovati M. Platelet dysfunction in central obesity. Nutr Metab Cardiovasc Dis. 2009; 19: 440–449. doi:10.1016/j.numecd.2009.01.006PMID:19346117
19. Nurjono M, Lee J. Waist Circumference is a Potential Indicator of Metabolic Syndrome in Singaporean Chinese. Ann Acad Med Singapore. 2013; 42: 241–245. PMID:23771112
20. Li WC, Chen IC, Chang YC, Loke SS, Wang SH, Hsiao KY, et al. Waist-to-height ratio, waist circumfer-ence, and body mass index as indices of cardiometabolic risk among 36,642 Taiwanese adults. Eur J Nutr. 2013; 52: 57–65. doi:10.1007/s00394-011-0286-0PMID:22160169
21. Trayhurn P. Hypoxia and adipose tissue function and dysfunction in obesity. Physiol Rev. 2013; 93: 1–
21. doi:10.1152/physrev.00017.2012PMID:23303904
22. Öztürk Z, Dag MS, Kuyumcu ME, Cam H, Yesil Y, Yilmaz N, et al. Could platelet indices be new bio-markers for inflammatory bowel diseases? Eur Rev Med Pharmacol Sci. 2013; 17: 334–341. PMID: 23426536
23. Bondia-Pons I, Ryan L, Martinez JA. Oxidative stress and inflammation interactions in human obesity. J Physiol Biochem. 2012; 68: 701–711. doi:10.1007/s13105-012-0154-2PMID:22351038
24. Chen S, Su Y, Wang J. ROS-mediated platelet generation: a microenvironment-dependent manner for megakaryocyte proliferation, differentiation, and maturation. Cell Death Dis. 2013; 4: e722. doi:10. 1038/cddis.2013.253PMID:23846224
25. Wang F, Zhu J, Yao P, Li X, He M, Liu Y, et al. Cohort profile: The Dongfeng-Tongji cohort study of re-tired workers. Int J Epidemiol. 2013; 42: 731–740. doi:10.1093/ije/dys053PMID:22531126
26. Chen WB, Pan XL, Wan XH, Lu XF, Liu YC, et al. Diagnostics. Beijing, China: People's Medical Pub-lishing House.2013.
27. Ware LJ, Rennie KL, Kruger HS, Kruger IM, Greeff M, Fourie CM, et al. Evaluation of waist-to-height ratio to predict 5 year cardiometabolic risk in sub-Saharan African adults. Nutr Metab Cardiovasc Dis. 2014; 24: 900–907. doi:10.1016/j.numecd.2014.02.005PMID:24675009
28. Alberti KG, Zimmet P, Shaw J. The metabolic syndrome-a new worldwide definition. Lancet. 2005; 366: 1059–1062. PMID:16182882
29. Bei-Fan Z. Predictive values of body mass index and waist circumference for risk factors of certain relat-ed diseases in Chinese adults: study on optimal cut-off points of body mass index and waist circumfer-ence in Chinese adults. Asia Pac J Clin Nutr. 2002; 11: S685–S693.
30. Park BJ, Shim JY, Lee HR, Jung DH, Lee JH, Lee YJ. et al. The relationship of platelet count, mean platelet volume with metabolic syndrome according to the criteria of the American Association of Clini-cal Endocrinologists: A focus on gender differences. Platelets. 2012; 23: 45–50. doi:10.3109/ 09537104.2011.589014PMID:21736420
31. Gasparyan AY, Ayvazyan L, Mikhailidis DP, Kitas GD. Mean platelet volume: a link between thrombo-sis and inflammation? Curr Pharm Des. 2011; 17: 47–58. PMID:21247392
33. Loef M, Walach H. Midlife obesity and dementia: meta-analysis and adjusted forecast of dementia prev-alence in the United States and China. Obesity 21: E51–55. doi:10.1002/oby.20037PMID:23401370
34. Lebedeva EV, Yushkov BG, Chereshnev VA. Megakaryocytopoiesis under hypoxic conditions. Bull Exp Biol Med. 2003; 136: 554–556. PMID:15500069
35. Qadri S, Holman S, Dehovitz J, Crystal H, Minkoff H, Lazar JM, et al. Mean platelet volume is de-creased in HIV-infected women. HIV Med. 2013; 14: 549–555. doi:10.1111/hiv.12048PMID: 23738819
36. Kaito K, Otsubo H, Usui N, Yoshida M, Tanno J, Kurihara E, et al. Platelet size deviation width, platelet large cell ratio, and mean platelet volume have sufficient sensitivity and specificity in the diagnosis of immune thrombocytopenia. Br J Haematol. 2005; 128: 698–702. PMID:15725092
37. Santimone I, Di Castelnuovo A, De Curtis A, Spinelli M, Cugino D, Gianfagna F, et al. White blood cell count, sex and age are major determinants of heterogeneity of platelet indices in an adult general popu-lation: results from the MOLI-SANI project. Haematologica. 2011; 96: 1180–1188. doi:10.3324/ haematol.2011.043042PMID:21546503
38. Yang F, Lv JH, Lei SF, Chen XD, Liu MY, Jian WX, et al. Receiver-operating characteristic analyses of body mass index, waist circumference and waist-to-hip ratio for obesity: Screening in young adults in central south of China. Clin Nutr. 2006; 25: 1030–1039. PMID:16884832
39. Nielson CM, Srikanth P, Orwoll ES. Obesity and fracture in men and women: an epidemiologic perspec-tive. J Bone Miner Res. 2012; 27: 1–10. doi:10.1002/jbmr.1486PMID:23348758
40. Zhang J, Jin Y, Xu S, Zheng J, Zhang Q, Chen J, et al. Associations of Fat Mass and Fat Distribution With Bone Mineral Density in Chinese Obese Population. J Clin Densitom. 2015; 18: 44–49. doi:10. 1016/j.jocd.2014.03.001PMID:24815308
41. Zhang ZQ, He LP, Xie XY, Ling WH, Deng J, Su YX, et al. Association of simple anthropometric indices and body fat with early atherosclerosis and lipid profiles in Chinese adults. PloS One. 2014; 9: e104361. doi:10.1371/journal.pone.0104361PMID:25090639
42. Popkin BM. Synthesis and implications: China's nutrition transition in the context of changes across other low-and middle-income countries. Obes Rev. 2014; 15: 60–67. doi:10.1111/obr.12120PMID: 24341759