Seroprevalence of Infections with Dengue,
Rift Valley Fever and Chikungunya Viruses in
Kenya, 2007
Caroline Ochieng1*, Petronella Ahenda1, Amy Y. Vittor3, Raymond Nyoka2, Stella Gikunju1, Cyrus Wachira1, Lilian Waiboci6, Mamo Umuro4, Andrea A. Kim2, Leonard Nderitu7, Bonventure Juma2, Joel M. Montgomery2, Robert F. Breiman2,5, Barry Fields2
1Center for Global Health Research, Kenya Medical Research Institute, Nairobi, Kenya,2Global Disease Detection Program, United States Center for Disease Control and Prevention, Nairobi, Kenya,3Division of Infectious Diseases and Global Medicine, Emerging Pathogens Institute, University of Florida, Gainesville, Florida, United States of America,4Ministry of Public Health and Sanitation, Nairobi, Kenya,5Emory University, Atlanta, Georgia, United States of America,6University of Nairobi, Nairobi, Kenya,7Africa Biomedical Laboratories, Nairobi, Kenya
Abstract
Arthropod-borne viruses are a major constituent of emerging infectious diseases worldwide, but limited data are available on the prevalence, distribution, and risk factors for transmis-sion in Kenya and East Africa. In this study, we used 1,091 HIV-negative blood specimens from the 2007 Kenya AIDS Indicator Survey (KAIS 2007) to test for the presence of IgG antibodies to dengue virus (DENV), chikungunya virus (CHIKV) and Rift Valley fever virus (RVFV).The KAIS 2007 was a national population-based survey conducted by the Govern-ment of Kenya to provide comprehensive information needed to address the HIV/AIDS epi-demic. Antibody testing for arboviruses was performed on stored blood specimens from KAIS 2007 through a two-step sandwich IgG ELISA using either commercially available kits or CDC-developed assays. Out of the 1,091 samples tested, 210 (19.2%) were positive for IgG antibodies against at least one of the three arboviruses. DENV was the most common of the three viruses tested (12.5% positive), followed by RVFV and CHIKV (4.5% and 0.97%, respectively). For DENV and RVFV, the participant’s province of residence was sig-nificantly associated (P.01) with seropositivity. Seroprevalence of DENV and RVFV increased with age, while there was no correlation between province of residence/age and seropositivity for CHIKV. Females had twelve times higher odds of exposure to CHIK as opposed to DENV and RVFV where both males and females had the same odds of expo-sure. Lack of education was significantly associated with a higher odds of previous infection with either DENV or RVFV (p<0.01). These data show that a number of people are at risk of arbovirus infections depending on their geographic location in Kenya and transmission of these pathogens is greater than previously appreciated. This poses a public health risk, especially for DENV.
OPEN ACCESS
Citation:Ochieng C, Ahenda P, Vittor AY, Nyoka R, Gikunju S, Wachira C, et al. (2015) Seroprevalence of Infections with Dengue, Rift Valley Fever and Chikungunya Viruses in Kenya, 2007. PLoS ONE 10(7): e0132645. doi:10.1371/journal.pone.0132645
Editor:Kylene Kehn-Hall, George Mason University, UNITED STATES
Received:March 25, 2015
Accepted:June 16, 2015
Published:July 15, 2015
Copyright:This is an open access article, free of all copyright, and may be freely reproduced, distributed, transmitted, modified, built upon, or otherwise used by anyone for any lawful purpose. The work is made available under theCreative Commons CC0public domain dedication.
Data Availability Statement:All relevant data are within the paper and its Supporting Information files.
Funding:This study was funded by the United States Department of Defense, Defense Threat Reduction Agency (DTRA), grant number KE 02. The funders had no role in study design, data collection and analysis, decision to publish, or preparation of the manuscript.
Introduction
Arthropod-borne viruses (arboviruses) are classified into three main families; Togaviridae (e.g., chikungunya virus (CHIK)), Flaviviridae (e.g., dengue virus (DENV)) and the Bunyaviridae (e.g., Rift Valley Fever virus (RVFV)). They cause a range of clinical syndromes in humans ranging from a self-limiting, febrile illness to life-threatening encephalitis or hemorrhagic fever. Arboviruses are a major cause of morbidity in sub-Saharan Africa [1]; however, most infections caused by arboviruses remain undiagnosed or misdiagnosed as malaria, typhoid, dysentery, or bacterial meningitis due to the nonspecific nature of the clinical signs and the lack of readily available laboratory testing [2–4][2–4]. Hence, the incidence of arboviral dis-eases and the public health burden are likely greatly underestimated. The World Health Orga-nization (WHO) estimates that DENV causes more than 50 million clinical cases globally each year [5]. In the United States, eastern equine encephalitis virus (familyTogaviridae, genus
Alphavirus), St. Louis encephalitis virus and West Nile virus (both in the familyFlaviviridae, genusFlavivirus) are important causes of viral encephalitis.
In East Africa, multiple arbovirus epidemics have occurred in the past two decades. In 1982, the first outbreak of dengue was reported along the Kenyan Coast [6]. Approximately 30 years later, in 2011, a dengue outbreak occurred in North Eastern Kenya [7]. Dengue virus activity continued in this region, and in early 2013 a dengue outbreak was detected in Mombasa, Ken-yan Coast [7]. These recent dengue outbreaks involved three different dengue serotypes (DEN-1, DEN-2 and DEN-3). Dengue appears to occur as an endemic disease in Kenya with periodic outbreaks primarily occurring along the coast. DENV infection causes a spectrum of symp-toms, from mild, non-specific symptoms to classic dengue fever, with high fevers and severe arthralgia. Reinfection with a new serotype can lead to dengue hemorrhagic fever or dengue shock syndrome, which is a severe form of dengue fever.
CHIKV infection is endemic in Africa and Asia, where numerous outbreaks have been reported since the 1950s.There are three genotypes of CHIKV, which are the West African, Central/East African (CEA) and Asian genotypes [8]. Since 2005, CHIKV of the CEA genotype has spread worldwide from initial outbreaks on Lamu in 2004 [9], Mombasa in 2004 [10], Comorros Island in 2005 [11] and in India affecting millions [8]. The onset of CHIK epidemics is rapid, often with high attack rates as seen in the 2005–2006 on La Réunion outbreak [12]. Concurrent epidemics of DEN and CHIK have been reported from Asia [13] and Africa [14]. In 2006, a combined outbreak of dengue fever and chikungunya fever occurred near the Mada-gascan city. The coastal region of Kenya was shown to be greatly affected in the recent outbreak of CHIK fever [15,9].There have also been sporadic imported cases and occasional outbreaks of CHIK fever in other regions outside Africa and Asia such as Italy in 2007 [16] and in France in 2010 [17,18]. In late 2013, autochthonous transmission of the Asian genotype of CHIKV was reported for the first time in the Caribbean. By December 2014, over one million suspected cases were reported from this region, with local transmission established in 41 countries or ter-ritories in the Americas (CDC:http://www.cdc.gov/chikungunya/geo/americas.html). This lat-est outbreak in the Americas underscores the importance of CHIKV infection as a global health threat.
household survey of persons aged 15–64 years, was used to test for Immunoglobulin G (IgG) antibodies against Rift Valley Fever virus, Chikungunya virus and Dengue virus. This was to assess the magnitude and geographic distribution of exposure to these arboviruses and the risk factors associated with these arboviral agents. This study also sought to identify the populations most-at-risk of infection and acute outbreaks due to these arboviruses in order to target public health interventions.
Materials and Methods
Study Design
Specimens were collected through the KAIS 2007, described in detail elsewhere [25]. This study was a population-based cross-sectional house hold survey of persons aged 15–64 years with an aim to provide representative information on the status of HIV/AIDS in Kenya. The survey used a stratified, two stage cluster sample, designed to generate representative estimates of HIV prevalence at the national and provincial level. The first stage of sampling involved selecting 415 clusters from a national sampling frame, the National Sample Survey and Evalua-tion Programme IV (NASSEP IV), and the second stage involved a selecEvalua-tion of households per cluster with equal probability of selection in the rural‐urban strata within each district country-wide. Household members were interviewed to collect information on demographics, behav-iors, and access to services. Blood specimens were collected to test for HIV infection. Remnant specimens from respondents who consented to future unspecified testing of their blood sam-ples were stored at -80°C. None of the stored HIV-positive samsam-ples were available at the time of arbovirus testing. Therefore, a sub-sample of HIV-negative samples was randomly selected to determine IgG antibody titers to RVFV, CHIKV and DENV. Sample sizes necessary to establish representative seroprevalence by province were calculated for each of the three arbo-viral infections, taking into account the design effect and intracluster correlation (ρ, assumed
to be 0.2) with a precision of 0.025 [26].
Laboratory
Sera from the study subjects were tested by enzyme immunoassays for IgG antibody to DEN, CHIK and RVF viruses. Briefly, DENV IgG was detected using a“two-step”sandwich-type immunoassay. This was done according to the manufacturer’s instructions using the InBios DENV DetectIgG ELISA kit. The DENV IgG negative control which represents a non-reactive serum, DENV IgG positive and the test serum samples were first diluted with sample dilution buffer for DENV IgG. Thereafter, these were incubated in micro-titre plates pre-coated by the manufacturer with monoclonal antibody bound to recombinant DENV antigen. After subse-quent incubation and washing, the wells were treated with specific conjugate and thereafter with substrate. A stop solution was then added and the absorbance measurement read at 450nm using the ELx800 absorbance microplate reader to determine the optical density.
Data Analysis
All analyses were conducted using survey procedures in Statistical Analysis Software (SAS) ver-sion 9.3 (SAS Institute Inc, Cary North Carolina, USA). The calculation of seroprevalence was adjusted to account for the variation in sampling of the study population. Sampling weights for households, individual interviews, blood draws and pathogen testing were used to correct for unequal probability of selection and to adjust for non-response to the questions asked during the survey [26]. These were used to represent the larger population from which the sample was drawn. A cluster was required to have a minimum of 3 samples on sampling and when this was not achieved due to the small sample size of negative HIV blood samples, non-positive sam-pling weights were obtained and were therefore excluded from analysis. Frequency distribu-tions were calculated for the three arboviruses. Bivariate and multivariate logistic regression models were used to test the association between the outcome variables with sex, age, education level, wealth and province. In bivariate analysis, variables that were associated with the out-come at a significance level of p-value<0.05 were considered to be statistically significant,
while those with p-value<0.1 were considered in the multivariate logistic regression model.
This is helpful in identifying variables that, by themselves, are not significantly related to the outcome but make an important contribution in the presence of other variables. Traditional levels such as 0.05 can fail to identify variables known to be important [27–28] and that’s why any variable that was significant at the 0.1 level was put in the model.
Ethical Statement
This study was approved by the Scientific Steering Committee (SSC) and the Ethical Review Committee at the Kenya Medical Research Institute (KEMRI) (SSC # 1209) and by the Institu-tional Review Board (IRB) at the U.S. Centers for Disease Control and Prevention (CDC) (IRB Protocol # 5169). The analysis was conducted on a sub-sample of stored serum specimens from survey participants who consented to storage of specimens for future testing of other infectious diseases. All the specimens that were used for this analysis were unlinked from per-sonal identifiers. There was no contact with participants and no new data collection was required for the purpose of this activity.
Results
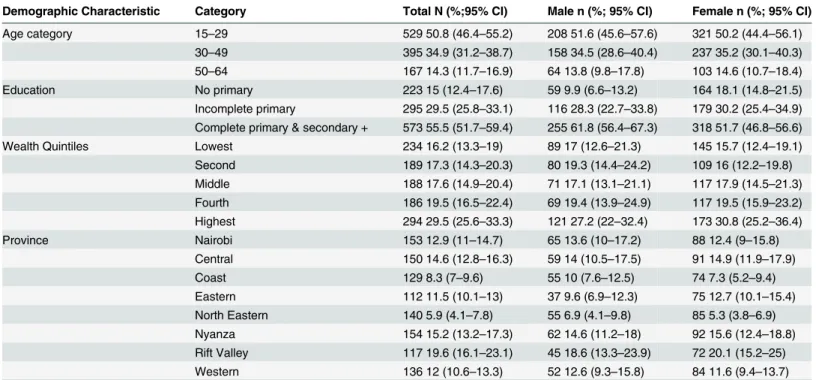
A total of 17,970 persons participated in the survey, of whom 15,853 (88.4%) provided blood samples for HIV testing. Of these, 14,984 (94.5%) serum samples were stored and available for future testing, including 943 HIV-positive and 14,041 HIV-negative serum samples. Of the HIV-negative serum samples available, we randomly selected 1,091 (7.8%) specimens for test-ing. All eight provinces were represented in this study to ensure an equal distribution of study subjects. Out of the 1,091 participants who provided blood samples which were tested, half (50.8%) were aged 15–29 years. There were more females sampled as compared to males in all categories (Table 1). All socioeconomic classes were represented with the lowest and highest quintiles of wealth being the most sampled groups. Over half of the participants had completed at least their primary and secondary education (55.5%). There was a higher number of KAIS participants whose samples were tested for the current study from Rift Valley Province (19.6%) compared to other provinces of Kenya (Table 1).
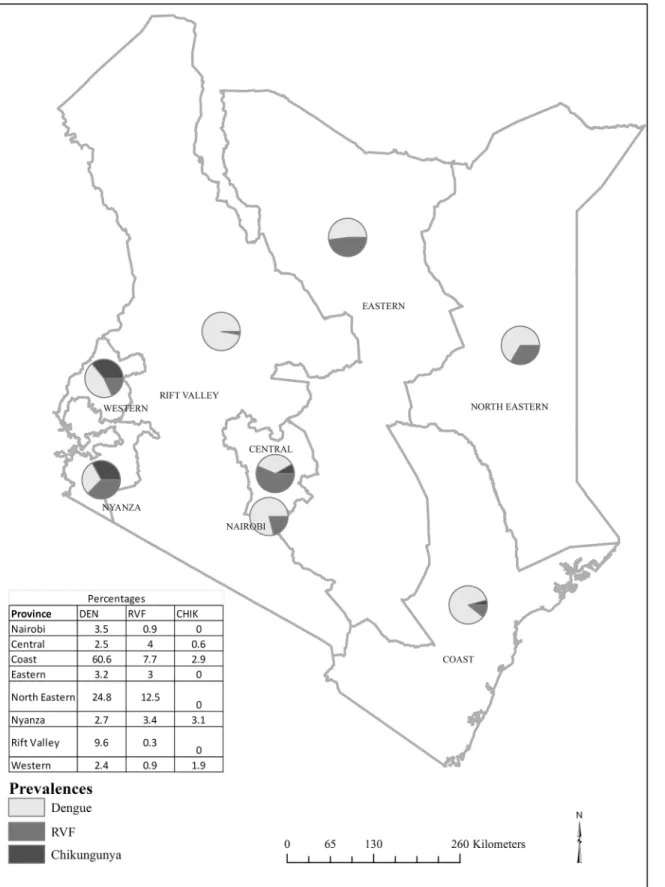
Overall, the seroprevalence of dengue was 12.5% (95% CI 8.7–16.3) in Kenya. Seropositivity varied by province, with the higher seroprevalence in Coast province, at 60.6% (95% CI 51.2–
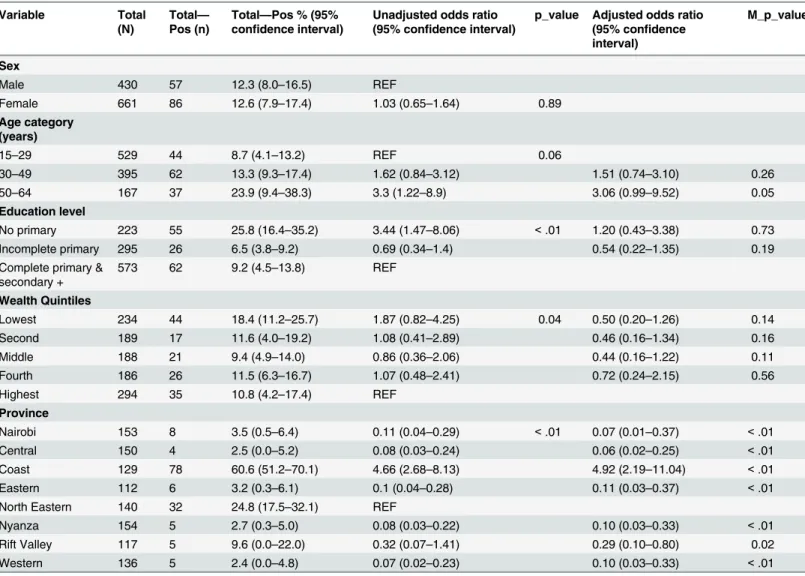
aged 50–69 years had three times higher odds of dengue seropositivity than persons aged 15–
29 years (p = 0.02). After controlling for demographic factors, province of residence remained independently and significantly associated with DENV infection. Compared to North Eastern province, higher adjusted odds of dengue seropositivity was found in Coast province (OR 4.9; 95% CI 2.2–11.0) while lower adjusted odds of dengue seropositivity were found in Nairobi (OR 0.1; 95% CI 0.01–0.4), Central (OR 0.1; 95% CI 0.02–0.3), Eastern (OR 0.1; 0.03–0.4), Nyanza (OR 0.1; 95% CI 0.03–0.3), and Western (OR 0.1; 95% CI 0.03–0.3) provinces.
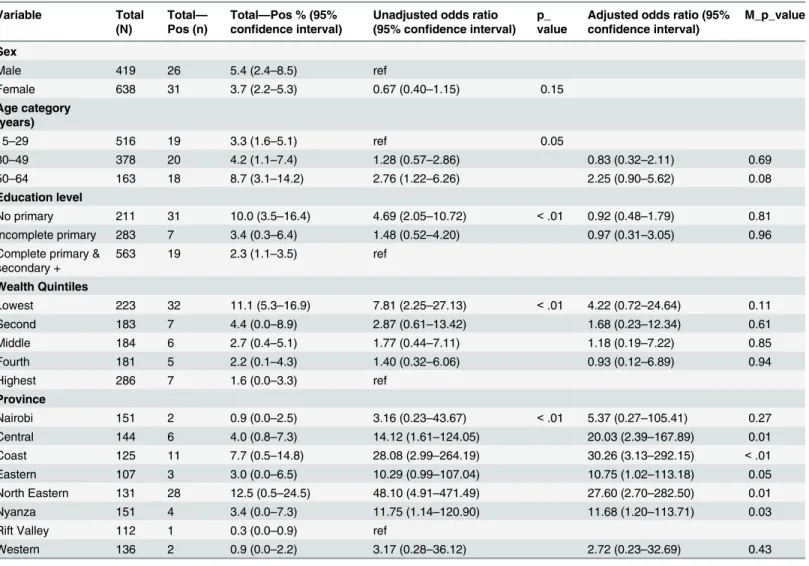
The national seropositivity of antibody to Rift Valley Fever (RVF) virus was 4.5% (95% CI 2.7–6.3). The highest seropositivity of RVF virus infection was in North Eastern (12.5%, 95% CI 0.5–24.5) and Coast provinces (7.7%, 95% CI 0.5–14.8) and the lowest seropositivity was in Rift Valley province (0.3%, 95% CI 0.0–0.9) (Fig 1). The odds of RVF seropositivity was signifi-cantly high in Central (p = 0.02), Coast (p<0.01), North Eastern (p<0.01), and Nyanza
(p = 0.04) provinces (Table 3). In addition, individuals from the lowest wealth quintile had higher odds of RVF seropositivity than those in the highest wealth quintile (Table 3). The elderly (50–64 years) had higher odds of exposure to RVF than the younger group (15–29 years). Lack of education was significantly associated with RVF seropositivity (p<0.01) by
bivariate analysis. In multivariate analysis, the association between dengue seropositivity and age, education level, and wealth index fell out of significance. However, province of residence remained independently and significantly associated with dengue seropositivity. Compared to Rift Valley province, the odds of dengue infection was 20 times higher in Central (OR 20.0; 95% CI 2.4–167.9), 30 times higher in Coast (OR 30.3; 95% CI 3.1, 292.2), 28 times higher in
Table 1. Demographic characteristics of study participants aged 15–64 years who were sampled for serologic survey of DEN, RVF and CHIK viruses, Kenya 2007.
Demographic Characteristic Category Total N (%;95% CI) Male n (%; 95% CI) Female n (%; 95% CI)
Age category 15–29 529 50.8 (46.4–55.2) 208 51.6 (45.6–57.6) 321 50.2 (44.4–56.1) 30–49 395 34.9 (31.2–38.7) 158 34.5 (28.6–40.4) 237 35.2 (30.1–40.3) 50–64 167 14.3 (11.7–16.9) 64 13.8 (9.8–17.8) 103 14.6 (10.7–18.4)
Education No primary 223 15 (12.4–17.6) 59 9.9 (6.6–13.2) 164 18.1 (14.8–21.5)
Incomplete primary 295 29.5 (25.8–33.1) 116 28.3 (22.7–33.8) 179 30.2 (25.4–34.9) Complete primary & secondary + 573 55.5 (51.7–59.4) 255 61.8 (56.4–67.3) 318 51.7 (46.8–56.6) Wealth Quintiles Lowest 234 16.2 (13.3–19) 89 17 (12.6–21.3) 145 15.7 (12.4–19.1) Second 189 17.3 (14.3–20.3) 80 19.3 (14.4–24.2) 109 16 (12.2–19.8) Middle 188 17.6 (14.9–20.4) 71 17.1 (13.1–21.1) 117 17.9 (14.5–21.3) Fourth 186 19.5 (16.5–22.4) 69 19.4 (13.9–24.9) 117 19.5 (15.9–23.2) Highest 294 29.5 (25.6–33.3) 121 27.2 (22–32.4) 173 30.8 (25.2–36.4)
Province Nairobi 153 12.9 (11–14.7) 65 13.6 (10–17.2) 88 12.4 (9–15.8)
Central 150 14.6 (12.8–16.3) 59 14 (10.5–17.5) 91 14.9 (11.9–17.9)
Coast 129 8.3 (7–9.6) 55 10 (7.6–12.5) 74 7.3 (5.2–9.4)
Eastern 112 11.5 (10.1–13) 37 9.6 (6.9–12.3) 75 12.7 (10.1–15.4) North Eastern 140 5.9 (4.1–7.8) 55 6.9 (4.1–9.8) 85 5.3 (3.8–6.9) Nyanza 154 15.2 (13.2–17.3) 62 14.6 (11.2–18) 92 15.6 (12.4–18.8) Rift Valley 117 19.6 (16.1–23.1) 45 18.6 (13.3–23.9) 72 20.1 (15.2–25) Western 136 12 (10.6–13.3) 52 12.6 (9.3–15.8) 84 11.6 (9.4–13.7)
CI- is the confidence interval + = and above
N, n = number of persons
Fig 1. Seroprevalence of dengue, Rift Valley fever and chikungunya virus infections in Kenya.
North Eastern (OR 27.6; 95% CI 2.7–282.5), and 12 times higher in Nyanza (OR 11.7; 95% CI 1.2–113.7).
The overall national CHIKV seropositivity was approximately 1% (95% CI 0.2–1.7). The seropositivity was high from individuals from the Coast and Nyanza Provinces as shown inFig 1.The highest prevalence was in Nyanza (3.1%; 95% CI 0.0–7.9) followed by Coast province (2.9; 95% CI 0.0–6.8) while the lowest seropositivity was in Central province (0.6%; 0.0–1.7). Females were 12 times more likely to have CHIK than the males (p = 0.02) (Table 4). There was no significant association of CHIKV with age, province, education level or socioeconomic status.
Table 2. Prevalence and factors associated with dengue virus among persons aged 15–64 years, Kenya, 2007.
Variable Total
(N)
Total— Pos (n)
Total—Pos % (95% confidence interval)
Unadjusted odds ratio (95% confidence interval)
p_value Adjusted odds ratio (95% confidence interval)
M_p_value
Sex
Male 430 57 12.3 (8.0–16.5) REF
Female 661 86 12.6 (7.9–17.4) 1.03 (0.65–1.64) 0.89
Age category (years)
15–29 529 44 8.7 (4.1–13.2) REF 0.06
30–49 395 62 13.3 (9.3–17.4) 1.62 (0.84–3.12) 1.51 (0.74–3.10) 0.26
50–64 167 37 23.9 (9.4–38.3) 3.3 (1.22–8.9) 3.06 (0.99–9.52) 0.05
Education level
No primary 223 55 25.8 (16.4–35.2) 3.44 (1.47–8.06) <.01 1.20 (0.43–3.38) 0.73
Incomplete primary 295 26 6.5 (3.8–9.2) 0.69 (0.34–1.4) 0.54 (0.22–1.35) 0.19
Complete primary & secondary +
573 62 9.2 (4.5–13.8) REF
Wealth Quintiles
Lowest 234 44 18.4 (11.2–25.7) 1.87 (0.82–4.25) 0.04 0.50 (0.20–1.26) 0.14
Second 189 17 11.6 (4.0–19.2) 1.08 (0.41–2.89) 0.46 (0.16–1.34) 0.16
Middle 188 21 9.4 (4.9–14.0) 0.86 (0.36–2.06) 0.44 (0.16–1.22) 0.11
Fourth 186 26 11.5 (6.3–16.7) 1.07 (0.48–2.41) 0.72 (0.24–2.15) 0.56
Highest 294 35 10.8 (4.2–17.4) REF
Province
Nairobi 153 8 3.5 (0.5–6.4) 0.11 (0.04–0.29) <.01 0.07 (0.01–0.37) <.01
Central 150 4 2.5 (0.0–5.2) 0.08 (0.03–0.24) 0.06 (0.02–0.25) <.01
Coast 129 78 60.6 (51.2–70.1) 4.66 (2.68–8.13) 4.92 (2.19–11.04) <.01
Eastern 112 6 3.2 (0.3–6.1) 0.1 (0.04–0.28) 0.11 (0.03–0.37) <.01
North Eastern 140 32 24.8 (17.5–32.1) REF
Nyanza 154 5 2.7 (0.3–5.0) 0.08 (0.03–0.22) 0.10 (0.03–0.33) <.01
Rift Valley 117 5 9.6 (0.0–22.0) 0.32 (0.07–1.41) 0.29 (0.10–0.80) 0.02
Western 136 5 2.4 (0.0–4.8) 0.07 (0.02–0.23) 0.10 (0.03–0.33) <.01
cut off point to include factors in multivariate is pvalue<0.1 p value is the global p value for the bivariate variable M_OR_CI is the multivariate odds ratio
M_p_value is the category multivariate p value REF- reference
+ = and above
N, n = number of persons
Discussion
While arboviruses are considered a major public health problem in tropical countries, most infections go undetected or misdiagnosed [24]. Arboviral infections are non-specific in their clinical presentations and are often not easily clinically distinguishable from other commonly occurring infections in tropical settings, such as malaria and typhoid, and most clinical facili-ties are not equipped with rapid diagnostic tests for these pathogens. The findings of this study suggest that during a lifetime exposure to arboviruses like DENV, CHIKV and RVF virus is not unusual in Kenya. Bivariate analysis of factors associated with anti-DENV seropositivity dem-onstrated an association between exposure to DENV with the participant’s province of
Table 3. Prevalence and factors associated with RVF virus among persons aged 15–64 years, Kenya, 2007.
Variable Total
(N)
Total— Pos (n)
Total—Pos % (95% confidence interval)
Unadjusted odds ratio (95% confidence interval)
p_ value
Adjusted odds ratio (95% confidence interval)
M_p_value
Sex
Male 419 26 5.4 (2.4–8.5) ref
Female 638 31 3.7 (2.2–5.3) 0.67 (0.40–1.15) 0.15
Age category (years)
15–29 516 19 3.3 (1.6–5.1) ref 0.05
30–49 378 20 4.2 (1.1–7.4) 1.28 (0.57–2.86) 0.83 (0.32–2.11) 0.69
50–64 163 18 8.7 (3.1–14.2) 2.76 (1.22–6.26) 2.25 (0.90–5.62) 0.08
Education level
No primary 211 31 10.0 (3.5–16.4) 4.69 (2.05–10.72) <.01 0.92 (0.48–1.79) 0.81
Incomplete primary 283 7 3.4 (0.3–6.4) 1.48 (0.52–4.20) 0.97 (0.31–3.05) 0.96
Complete primary & secondary +
563 19 2.3 (1.1–3.5) ref
Wealth Quintiles
Lowest 223 32 11.1 (5.3–16.9) 7.81 (2.25–27.13) <.01 4.22 (0.72–24.64) 0.11
Second 183 7 4.4 (0.0–8.9) 2.87 (0.61–13.42) 1.68 (0.23–12.34) 0.61
Middle 184 6 2.7 (0.4–5.1) 1.77 (0.44–7.11) 1.18 (0.19–7.22) 0.85
Fourth 181 5 2.2 (0.1–4.3) 1.40 (0.32–6.06) 0.93 (0.12–6.89) 0.94
Highest 286 7 1.6 (0.0–3.3) ref
Province
Nairobi 151 2 0.9 (0.0–2.5) 3.16 (0.23–43.67) <.01 5.37 (0.27–105.41) 0.27
Central 144 6 4.0 (0.8–7.3) 14.12 (1.61–124.05) 20.03 (2.39–167.89) 0.01
Coast 125 11 7.7 (0.5–14.8) 28.08 (2.99–264.19) 30.26 (3.13–292.15) <.01
Eastern 107 3 3.0 (0.0–6.5) 10.29 (0.99–107.04) 10.75 (1.02–113.18) 0.05
North Eastern 131 28 12.5 (0.5–24.5) 48.10 (4.91–471.49) 27.60 (2.70–282.50) 0.01
Nyanza 151 4 3.4 (0.0–7.3) 11.75 (1.14–120.90) 11.68 (1.20–113.71) 0.03
Rift Valley 112 1 0.3 (0.0–0.9) ref
Western 136 2 0.9 (0.0–2.2) 3.17 (0.28–36.12) 2.72 (0.23–32.69) 0.43
cut off point to include factors in multivariate is pvalue<0.1 p value is the global p value for the bivariate variable M_OR_CI is the multivariate odds ratio
M_p_value is the category multivariate p value Ref- reference
+—and above
N, n = number of persons
residence, age and literacy level. Prevalence of antibodies to DENV was highest in the Coast followed by North Eastern province. This could be due to the abundance ofAedesmosquito vectors that transmit this virus in these regions [29]. The previous outbreak of dengue (1982 outbreak) in the Coast [6] could also have contributed to high seroprevalence, since older adults (50–64 years) showed the highest seropositivity to DENV IgG antibodies. The location of the Mombasa port which facilitates shipping traffic between Asia (which experiences Den-gue outbreaks) and E. Africa may also be an important contributing factor to the high sero-prevalence observed in the region. The frequent movement of people between N. Eastern province and Somalia (where dengue outbreaks have occurred) may also contribute to the high seroprevalence of Dengue in N. Eastern province. There was also a significant association between DENV seropositivity and lack of formal education. One of the predisposing factors might be a high frequency of outdoor activities because many residents in the area are pastoral-ists, often with limited formal education, who are highly mobile as they move with their live-stock for grazing. These activities conceivably increase exposure to day feedingAe.aegypti
mosquitoes, the principal vectors of DENV. The movement of pastoralists between the Coast
Table 4. Prevalence and factors associated with chikungunya virus among persons aged 15–64 years, Kenya, 2007.
Variable Total
(N)
Total-Pos (n)
Total—Pos % (95% confidence interval)
Unadjusted odds ratio (95% confidence interval)
p_value Adjusted odds ratio (95% confidence interval)
M_p_value
Sex
Male 355 1 0.1 (0.0–0.4) ref
Female 554 9 1.5 (0.3–2.6) 11.54 (1.40–95.38) 0.02 12.09 (1.46–99.86) 0.02
Age(years)
15–29 452 8 1.5 (0.3–2.6) 3.37 (0.80–14.15) 0.1 3.57 (0.84–15.21) 0.09
30–49 457 2 0.4 (0.0–1.1) ref
Education level
No primary & incomplete primary
433 8 1.6 (0.2–3.1) 4.38 (0.75–25.49) 0.1
Complete primary & secondary +
476 2 0.4 (0.0–0.9) ref
Wealth Quintiles
Lowest 194 2 0.7 (0.0–1.9) 1.87 (0.20–17.13) 0.47
Second 164 2 1.3 (0.0–3.1) 3.37 (0.40–28.07)
Middle 158 2 0.9 (0.0–2.3) 2.41 (0.31–18.96)
Fourth 154 2 2.3 (0.0–5.5) 5.98 (0.77–46.60)
Highest 239 2 0.4 (0.0–0.9) ref
Province
Central 121 1 0.6 (0.0–1.7) ref 0.52
Coast 108 2 2.9 (0.0–7.9) 5.06 (0.35–72.76)
Nyanza 134 4 3.1 (0.0–6.8) 5.51 (0.54–56.56)
Western 122 3 1.9 (0.0–4.0) 3.21 (0.32–32.09)
cut off point to include factors in multivariate is pvalue<0.1 p value is the global p value for the bivariate variable M_OR_CI is the multivariate odds ratio
M_p_value is the category multivariate p value Ref- reference
+—and above
N, n = number of persons
province and N. Eastern province may also have contributed to the high seropositivity to DENV IgG antibodies in these two provinces. However, multivariate analysis showed that there was no significant association between DENV exposure and education level. There was also no association between DENV and the socioeconomic status of the population that was sampled in this study by both bivariate and multivariate model. Thus, when controlling for geography, education and socioeconomic status are not associated with seroprevalence of den-gue infection. In addition both males and females stood equal chances of contracting denden-gue virus infection.
RVFV was most prevalent in North Eastern and Coast provinces in Kenya. In 2006/2007, Kenya experienced a major RVFV outbreak affecting North Eastern and Coastal provinces [19]. There is also abundance of the RVF mosquito vectors in these regions thus acting as a pre-disposing factor to the population that resides here [20–21]. Animal slaughter is common in these regions—slaughtering infected livestock has been shown to be strongly associated with RVFV infection [20]. The intense practice of pastoralism by the N. Eastern people and move-ment of animals between N. eastern and Coast provinces are also possible factors that could have led to exposure to RVF infections. The prevailing climatic conditions such as high tem-peratures in the two provinces and occasional flooding also favour the emergence and survival of RVF infected mosquitoes in the areas. We demonstrated a significant association of RVF seropositivity with age, level of formal education, geographical location and socioeconomic sta-tus of the population under study by bivariate analysis. The odds of RVF seropositivity in the elderly was twice that of the younger age group and those who had no education background were also the most likely to be seropositive. On the other hand, multivariate analysis showed that age, level of education and socioeconomic status had no significant relationship with RVF seropositivity. Seropositivity for RVFV IgG was significantly associated with geographic regions which had experienced outbreaks previously on bivariate and multivariate analyses (P.05).
IgG antibodies to CHIKV were found in people from the Coastal and Nyanza provinces of Kenya. The Coast region experienced an outbreak of CHIKV in 2004 which would have exposed the population to the virus [9], and CHIKV is also transmitted byAedesmosquitoes which might explain some overlap with geographic distribution of DENV exposure.Ae.aegypti
mosquitoes have adapted to more urban domestic habitats, they have exploited a wide range of artificial containers such as vases, water tanks and tires that are often associated with human habitations [30]. The vectors also prefer mammalian hosts [31] and will preferentially feed on humans, even in the presence of alternative hosts [32]. The presence of IgG antibodies to CHIKV from individuals from Nyanza likely indicates circulation of the virus after the 1970 outbreak [33]. These findings confirm reports by Sutherland and others [24]. Overall, there was limited CHIKV seropositivity in Kenya compared to the other two arboviruses. Given the low CHIK seroprevalence, the study may have been underpowered to detect significant associa-tions. Since DENV and CHIKV utilize the same vectors, the risk factors for disease acquisition should be the same, but we could not demonstrate this. The North Eastern and Coast provinces of Kenya seemed to be most affected by arboviruses. This confirms the findings of an earlier vector survey [34] that most arboviruses were isolated from mosquitoes from the N. Eastern province of Kenya. This was associated with the abundance of mosquito vectors and the envi-ronmental conditions in the region which support their survival. The principal vector for DEN and CHIK viruses (Ae.aegypti) is abundant in the Coast province [29] and this may also explain the IgG seropositivity to these arboviruses in this region.
cross reactivity especially for flaviviruses and alphaviruses. In this paper, we report CHIK sero-positivity of 1% as opposed to 34% that was reported from a serosurvey in Kenya by Mease et al. [22]. The reasons for this discrepancy could be due to the differences in the sampling sites and the method of sampling. In the Mease et al study, sampling was conducted in three districts while in the current study, sampling occurred in all the eight provinces in Kenya. The former study also included individuals regardless of their HIV status while in the later, only a subset of HIV negative samples were used due to unavailability of HIV positive samples. The younger age groups (below 15 years) were also not represented in this study and yet they also play an important role in the epidemiology of the three arbovirus infections. The information gener-ated from this study has identified areas of disease foci in Kenya that require further investiga-tion to determine the burden of disease through active surveillance and might suggest
geographically and risk targeted strategies for prevention and reducing the burden of arbovi-rus-associated diseases.
Conclusion
The findings of this study suggest that Kenyans, especially in certain geographic locations, are highly likely to be exposed to arboviruses over the course of their lifetime. These arboviral dis-eases may represent significant public health concerns in Kenya, worthy of further study and potentially of more active interventions to prevent and control these infections.
Acknowledgments
The authors wish to recognize the KAIS Study Group for their contribution to design of the survey, collection of data, and availing the samples for this study: Michael Arnold, Godfrey Bal-tazar, Isack Baya, John Bore, Rebecca Bunnell, Sufia Dadabhai, Helen Dale, Jared Ichwara, Allen Hightower, Tura Galgalo, Catherine Gichimu, Anthony Gichangi, Reinhard Kaiser, Timothy Kellogg, George Kichamu, Evelyn Kim, Samuel Kipruto, George K’opiyo, Ernest Makokha, Barbara Marston, Lawrence Marum, Margaret Mburu, Jonathan Mermin, Joy Mirja-hangir, Rex Mpazanje, Ibrahim Mohamed, Patrick Muriithi, James Muttunga, Mary Mwangi, Carol Ngare, Linus Odawo, Samuel Ogola, Christopher Omolo, Tom Oluoch, Ray Shiraishi, John Wanyungu, and Anthony Waruru.
In addition, we wish to thank the CDC Arbovirus Branch, Ft. Collins and Viral Special Path-ogens Branch, Atlanta, NCEZID for providing the ELISA reagents. This study was funded by the Defense Threat Reduction Agency (DTRA). The findings and conclusions in this report are those of the authors and do not necessarily represent the official position of the Centers for Disease Control and Prevention.
Author Contributions
Conceived and designed the experiments: BF JMM RFB AAK LW MU. Performed the experi-ments: SG CW AYV LN. Analyzed the data: AYV RN. Contributed reagents/materials/analysis tools: RN. Wrote the paper: CO PA BF BJ. Reviewed the manuscript: JMM RFB AAK LW AYV RN SG CW.
References
1. Kuniholm MH, Wolfe ND, Huang CY-H, Mpoudi-Ngole E, Tamoufe U, Burke DS, et al. Seroprevalence and distribution of flaviviridae, togaviridae and bunyaviridae arboviral infections in rural Cameroonian adults. Am J Trop Med Hyg. 2006 June 1; 74:1078–1083. PMID:16760524
3. Maher-Sturgess SL, Forrester NL, Wayper PJ, Gould EA, Hall RA, Barnard RT, et al. Universal primers that amplify RNA from all three flavivirus subgroups. Virol J. 2008; 5: 16. doi:10.1186/1743-422X-5-16 PMID:18218114
4. Pincus LB, Grossman ME, Fox LP. The exanthem of dengue fever: clinical features of two US tourists traveling abroad. J Am Acad Dermatol. 2008; 58: 308–316. PMID:17959270
5. World Health Organization. Fact sheet N°117: Dengue and Dengue Hemorrhagic Fever. Geneva, Swit-zerland: World health Organization; 2002.
6. Johnson BK, Ochieng D, Gichogo A, Okiro M, Libondo D, Kinyanjui P, et al. Epidemic dengue fever caused by dengue type 2 virus in Kenya: preliminary results of human virological and serological stud-ies. E Afr Med J. 1982; 59:781–784.
7. Kenya Ministry of Health, Department of Disease prevention and control. Dengue Fever outbreak response. The East Africa Public Health Lab Network Newsletter, Quarterly Bulletin, Kenya chapter, June 2013, issue 07: , pp. 1–2.
8. Said MA, Li Rong L, Yoke FC, Ahmad H, Noran NH, Asiah A, et al. Seroprevalence Survey of Chikun-gunya Virus in Bagan Panchor, Malaysia. Am. J. Trop. Med. Hyg. 2010; 83(6): 1245–1248. doi:10. 4269/ajtmh.2010.10-0279PMID:21118929
9. Sergon K, Njuguna C, Kalani R, Ofula V, Onyango C, Konongoi LS, et al. Seroprevalence of Chikungu-nya Virus (CHIKV) Infection on Lamu Island, KeChikungu-nya, October 2004. Am J Trop Med Hyg 2008; 78: 333–
337. PMID:18256441
10. Sang RC, Ahmed O, Faye O, Kelly CLH, Yahaya AA, Mmadi I, et al. Entomologic Investigations of a Chikungunya Virus Epidemic in the Union of the Comoros, 2005.Am J Trop Med Hyg January 2008; 78 (1): 77–82.
11. Sergon K, Yahaya AA, Brown J, Bedja SA, Mlindasse M, Agata N, et al. Seroprevalence of Chikungu-nya Virus Infection on Grande Comore Island, Union of the Comoros, 2005. Am J Trop Med Hyg 2007; 76: 1189–1193. PMID:17556634
12. Renault P, Solet JL, Sissoko D, Balleydier E, Larrieu S, Filleul L, et al. A major epidemic of chikungunya virus infection on Réunion Island, France, 2005–2006. Am J Trop Med Hyg. 2007; 77: 727–31. PMID: 17978079
13. Kularatne SA, Gihan MC, Weerasinghe SC, Gunasena S. Concurrent outbreaks of Chikungunya and dengue fever in Kandy, Sri Lanka, 2006–07: a comparative analysis of clinical and laboratory features. Postgrad Med J. 2009; 85: 342–6. Available:http://dx.doi.org/10.1136/pgmj.2007.066746. doi:10. 1136/pgmj.2007.066746PMID:19581242
14. Leroy EM, Nkoghe D, Ollomo B, Nze-Nkogue C, Becquart P, Grard G, et al. Concurrent chikungunya and dengue virus infections during simultaneous outbreaks, Gabon, 2007. Emerg Infect Dis. 2009; 15: 591–3. Available:http://dx.doi.org/10.3201/eid1504.080664. doi:10.3201/eid1504.080664PMID: 19331740
15. Chretien JP, Anyamba A, Bedno SA, Breiman RF, Sang R, Sergon K, et al. Drought associated chikun-gunya emergence along coastal East Africa. Am J Trop Med Hyg 2007; 76: 405–407. PMID:17360859 16. Rezza G, Nicoletti L, Angelini R, Romi R, Finarelli C, Panning M, et al. Infection with chikungunya virus
in Italy: an outbreak in a temperate region. Lancet 2007; 370: 1840–1846. PMID:18061059
17. La Ruche G, Souarès Y, Armengaud A, Peloux-Petiot F, Delaunay P, Desprès P, et al. First two autoch-thonous dengue virus infections in metropolitan France, September 2010. Eurosurveillance2010; 15 (39).
18. Grandadam M, Caro V, Plumet S, Thiberge M, Souarès Y, Failloux AB, et al. Chikungunya virus, south-eastern France. Emerging Infectious Diseases 2011; 17(5): 910–913. doi:10.3201/eid1705.101873 PMID:21529410
19. Nguku PM, Sharif SK, Mutonga D, Amwayi S, Omolo J, Mohammed O, et al. An investigation of a major outbreak of Rift Valley fever in Kenya: 2006–2007. Am J Trop Med Hyg. 2010 Aug; 83(2 Suppl): 5–13. doi:10.4269/ajtmh.2010.09–0288PMID:20682900
20. Anyangu AS, Hannah Gould L, Sharif SK, Nguku PM, Omolo JO, Mutonga D, et al. Risk Factors for Severe Rift Valley Fever Infection in Kenya, 2007. Am J Trop Med Hyg. 2010; 83(2 Suppl): 14–21. doi: 10.4269/ajtmh.2010.09–0293PMID:20682901
21. Sang R, Kioko E, Lutomiah J, Warigia M, Ochieng C, O'Guinn M, et al. Rift Valley Fever Virus Epidemic in Kenya, 2006/2007: The Entomologic Investigations. Am J Trop Med Hyg. 2010; 83(2 Suppl): 28–37. doi:10.4269/ajtmh.2010.09-0319PMID:20682903
23. Blaylock JM, Maranich A, Bauer K, Nyakoe N, Waitumbi J, Martinez LJ et al. The seroprevalence and seroincidence of dengue virus infection in Western Kenya. Travel Med Infect Di. 2011; 9: 246–248.
24. Sutherland LJ, Cash AA, Huang Y-JS, Sang RC, Malhotra I, Moormann AM, et al. Serologic Evidence of Arboviral Infections among Humans in Kenya. Am J Trop Med Hyg. 2011; 85(1): 158–161. doi:10. 4269/ajtmh.2011.10-0203PMID:21734142
25. Maina WK, Kim AA, Rutherford GW, Harper M, K'Oyugi BO, Sharif S, et al. Kenya AIDS Indicator Sur-veys 2007 and 2012: implications for public health policies for HIV prevention and treatment. J Acquir Immune Defic Syndr. 2014; 66(Suppl 1): S130–7. doi:10.1097/QAI.0000000000000123PMID: 24732817
26. Bennet S, Woods T, Liyanage WM, Smith DL. A simplified general method for cluster-sample surveys of health in developing countries. Wld hlth statist quart 1991; 44: 98–106.
27. Bendel RB, Afifi AA. Comparison of stopping rules in forward regression. Journal of the American Sta-tistical Association. 1977; 72: 46–53. doi:10.2307/2286904
28. Mickey J, Greenland S. A study of the impact of confounder-selection criteria on effect estimation. American Journal of Epidemiology. 1989; 129: 125–137. PMID:2910056
29. Lutomiah J, Bast J, Clark J, Richardson J, Yalwala S, Oullo D, et al. Abundance, diversity, and distribu-tion of mosquito vectors in selected ecological regions of Kenya: public health implicadistribu-tions. J Vector Ecol. 2013; 38(1): 134–42. doi:10.1111/j.1948-7134.2013.12019.xPMID:23701618
30. Gould EA, Higgs S. Impact of climate change and other factors on emerging arbovirus diseases. Trans R Soc Trop Med Hyg. 2009 Feb; 103(2):109–21. doi:10.1016/j.trstmh.2008.07.025PMID:18799177 31. Turell MJ, Dohm DJ, Sardelis MR, Oguinn ML, Andreadis TG, Blow JA. An update on the potential of
north American mosquitoes (Diptera: Culicidae) to transmit West Nile Virus. J Med Entomol. 2005; 42 (1): 57–62. PMID:15691009
32. Saifur RG, Dieng H, Hassan AA, Salmah MR, Satho T, Miake F, et al. Changing domesticity of Aedes aegypti in northern peninsular Malaysia: reproductive consequences and potential epidemiological implications. PLOS ONE. 2012; 7(2): e30919. doi:10.1371/journal.pone.0030919PMID:22363516 33. Powers AM, Logue CH. Changing patterns of chikungunya virus: re-emergence of a zoonotic arbovirus.
J Gen Virol. 2007; 88:363–2377.