Chikungunya versus Dengue Infections in Adults
Vernon J. Lee1,2*, Angela Chow1, Xiaohui Zheng3, Luis R. Carrasco3,4, Alex R. Cook2,3,5, David C. Lye6, Lee-Ching Ng7, Yee-Sin Leo6
1Department of Clinical Epidemiology, Tan Tock Seng Hospital, Singapore, Singapore,2Saw Swee Hock School of Public Health, National University of Singapore, Singapore, Singapore,3Department of Statistics and Applied Probability, National University of Singapore, Singapore, Singapore,4Department of Biological Sciences, National University of Singapore, Singapore, Singapore,5Program in Health Services and Systems Research, Duke-NUS Graduate Medical School, Singapore, Singapore, 6Department of Infectious Diseases, Tan Tock Seng Hospital, Singapore, Singapore,7Environmental Health Institute, National Environment Agency, Singapore, Singapore
Abstract
Background: Dengue and chikungunya are co-circulating vector-borne diseases with substantial overlap in clinical presentations. It is important to differentiate between them during first presentation as their management, especially for dengue hemorrhagic fever (DHF), is different. This study compares their clinical presentation in Singapore adults to derive predictors to assist doctors in diagnostic decision-making.
Methods:We compared 117 patients with chikungunya infection diagnosed with reverse transcription-polymerase chain reaction (RT-PCR) with 917 dengue RT-PCR-positive adult patients (including 55 with DHF). We compared dengue fever (DF), DHF, and chikungunya infections by evaluating clinical characteristics of dengue and chikungunya; developing classification tools via multivariate logistic regression models and classification trees of disease etiology using clinical and laboratory factors; and assessing the time course of several clinical variables.
Findings:At first presentation to hospital, significantly more chikungunya patients had myalgia or arthralgia, and fewer had a sore throat, cough (for DF), nausea, vomiting, diarrhea, abdominal pain, anorexia or tachycardia than DF or DHF patients. From the decision trees, platelets ,1186109/L was the only distinguishing feature for DF versus chikungunya with an overall correct classification of 89%. For DHF versus chikungunya using platelets,1006109/L and the presence of bleeding, the overall correct classification was 98%. The time course analysis supported platelet count as the key distinguishing variable.
Interpretation:There is substantial overlap in clinical presentation between dengue and chikungunya infections, but simple clinical and laboratory variables can predict these infections at presentation for appropriate management.
Citation:Lee VJ, Chow A, Zheng X, Carrasco LR, Cook AR, et al. (2012) Simple Clinical and Laboratory Predictors of Chikungunya versus Dengue Infections in Adults. PLoS Negl Trop Dis 6(9): e1786. doi:10.1371/journal.pntd.0001786
Editor:Ann M. Powers, Centers for Disease Control and Prevention, United States of America
ReceivedMarch 30, 2012;AcceptedJuly 5, 2012;PublishedSeptember 27, 2012
Copyright:ß2012 Lee et al. This is an open-access article distributed under the terms of the Creative Commons Attribution License, which permits unrestricted use, distribution, and reproduction in any medium, provided the original author and source are credited.
Funding:This work was supported by the National Medical Research Council (grants NMRC/H1N1R/005/2009 to ARC and LRC, and NMRC/TCR/005/2008 to DCL and YSL). The funders had no role in study design, data collection and analysis, decision to publish, or preparation of the manuscript.
Competing Interests:The authors read the journal’s policy and have the following conflicts: VJL received unrelated research funding from GSK. Yee-Sin Leo is a consultant to Sanofi-Pasteur.
* E-mail: vernonljm@hotmail.com
Introduction
Dengue and chikungunya are vector-borne diseases that have been circulating in the tropical regions of Africa and Asia for decades [1,2]. Many factors influence the geographical spread of both viruses, including vector distribution (both are spread byAedes mosquitoes), human travel, urbanization, and climatic changes [1,2]. These two diseases now co-circulate in many countries [3,4] and pose a challenge to clinicians because they may require different clinical management even though their manifestations can be similar. Dengue fever (DF) cases can develop into severe dengue [5], dengue hemorrhagic fever (DHF) or dengue shock syndrome (DSS) [6], which may lead to adverse outcomes including death, especially in children. A previous Singapore study found that of the DF cases presenting to hospital, 6% subsequently developed DHF and 0.5% DSS [7]. The possibility
of these complications necessitates early identification, close monitoring for plasma leakage and possible institution of fluid therapy for dengue cases [5,6,8]. At the same time, a substantial proportion of dengue cases are mild and do not require hospitalization – only regular outpatient monitoring and symp-tomatic treatment [7,9]. Most chikungunya cases do not result in severe complications and treatment is symptomatic unlike DHF or DSS cases, although atypical presentations sometimes occur including organ failures which can be fatal especially in elderly with co-morbidities [10].
while leukopenia, neutropenia, thrombocytopenia and abdominal pain [13–17] were more prominent in dengue cases.
Although knowing the diagnosis of dengue and chikungunya cases early is important, in resource-limited settings, sophisticated laboratory tests to distinguish these infections may be unavailable or costly, necessitating epidemiological and symptom-based approaches to diagnosis.
In Singapore, all four dengue serotypes co-circulate and the number of cases and occurrence of major outbreaks have increased since the 1990s, despite an effective vector control program since the 1970s [18,19]. Unlike many other Southeast Asian countries where dengue is primarily a pediatric disease, most notified infections are in adults in Singapore [18]. Although outbreaks of chikungunya were recorded in South and Southeast Asian countries since the 1960s, indigenous transmission of chikungunya in Singapore was only reported in 2008 after the wave of Indian Ocean outbreaks starting in 2005 [20,21].
This study compares the clinical manifestations of dengue and chikungunya in adults in Singapore, and aims to derive predictors of chikungunya versus dengue in the presence and absence of laboratory tests, to assist doctors in both well-resourced and resource-limited settings in diagnostic decision-making. It builds on our previous studies performed in Singapore on a 2004 dengue cohort to derive predictive algorithms for DHF for doctors to determine need for hospitalization among patients presenting with dengue [7,22].
Methods
We conducted a retrospective case-control study on 117 patients confirmed with chikungunya infection on reverse transcription-polymerase chain reaction (RT-PCR) during the August 2008 outbreak, and hospitalized at Tan Tock Seng Hospital, Singapore, the national outbreak response center. These were compared with 917 dengue-PCR positive adult patients (including 55 with DHF) hospitalized at the same center during the large 2004 dengue outbreak in Singapore. The methods and performance of the dengue [23] and chikungunya [24] PCR tests we used have been previously documented and used for routine diagnosis. Specific
information on possible co-infections of chikungunya cases in this cohort was not available. However, the risk of co-infection was low, demonstrated by tests of 900 chikungunya-positive cases from January to August 2008 for dengue at the Environmental Health Institute, Singapore, which yielded no evidence of co-infection. This is likely due to the fact that the chikungunya outbreak in August 2008 was driven byAedes albopictusin less-urbanized parts of Singapore, [24], in contrast to dengue which is usually transmitted byAedes aegyptiin highly urbanised areas [18].
For the two cohorts, medical records were reviewed for all hospitalized patients during the study periods (31 July to 11 November 2008 for chikungunya, and 1 January to 31 December 2004 for dengue) with positive chikungunya and dengue PCR results respectively. Demographic, epidemiological, serial clinical and laboratory, radiological, treatment and outcome data were extracted and anonymized. In Tan Tock Seng Hospital, dengue patients are managed using a standardized care path which ensures that clinical and laboratory data are uniformly observed. A similar care path was developed for chikungunya, ensuring that similar clinical data were collected. The criteria for DF, DHF and DSS are in accordance with the World Health Organization 1997 dengue guideline [6].
Statistical analyses
We performed three analyses comparing dengue and chikun-gunya infections. In all three, DF and DHF (including DSS) were treated separately, i.e. DF and chikungunya were compared to provide clinicians with an understanding of key differences between the two diseases with similar expressions, while DHF and chikungunya were contrasted because DHF requires addi-tional clinical management. In the first of the three analyses, we compared clinical characteristics of dengue and chikungunya using univariate chi-squared and Wilcoxon tests to quantify differences between diseases for dichotomous and continuous variables, respectively, using data from the entire hospitalization. In the second analysis, we developed classification tools via multivariate logistic regression models and classification trees of disease etiology using clinical and laboratory factors that might guide clinical decisions before laboratory confirmation was available: we therefore only used data available at the time of hospital presentation, considering clinical data only for resource-limited settings, and clinical and laboratory data for well-resourced settings. In the third analysis, we assessed the time course of several clinical variables using Bayesian hierarchical modelling.
Multivariate logistic regression
The data exhibited separation [25,26] which prevented finite estimates of (adjusted) odds ratios and consequently had delete-rious effects on Wald-derived confidence intervals [25]. To address this, we used Firth’s modified score procedure to estimate odds ratios and derived confidence intervals using the profile-penalized likelihood function [26]. We fit a multivariate model, i.e. accounting for confounding, with the following variables: age, gender, hypertension, time since onset (in days), duration of fever (in days), presence of fever, headache, myalgia/athralgia, rash, any bleeding, sore throat, cough, nausea, vomiting, diarrhea, abdom-inal pain, anorexia, maximum temperature (uC), tachycardia (pulse .100/minute), leukocyte count, hemoglobin, serum hematocrit, platelet count, lymphocyte/neutrophil/monocyte/ atypical lymphocyte proportion, serum sodium, potassium, urea, creatinine, bilirubin, alanine (ALT) and aspartate aminotransfer-ase (AST), alkaline phosphataminotransfer-ase (ALP), protein and albumin, as measured on the day of hospital presentation. Missing values for continuous variables were imputed using the mean over all
non-Author Summary
missing records. Terms not statistically significantly different from 0 were removed from the multivariate model sequentially, starting with the one with the highestp-value. In secondary analysis, we extended the time horizon to the entire duration of hospitalization, replacing laboratory variables with either maximum or minimum recorded value depending on clinical significance.
Classification trees
Predictive tools to distinguish between DF or DHF and chikungunya at presentation were constructed using classification
and regression trees [27]. Classification and regression tree models are machine learning non-parametric techniques to classify categorical or continuous dependent variables as a function of multiple explanatory variables. The classification trees were constructed using a binary recursive partitioning algorithm for the elicitation of the rules using the tree package in R [28]. The trees were fitted to resourced-limited (clinical data only) and well-resourced settings (clinical and laboratory data) and then pruned using a cost-complexity measure to obtain the lowest cross-validated error. Leave-one-out cross-validation was employed to
Figure 1. Univariate anaylsis of variables at first presentation to hospital.The analysis compared between Dengue fever (DF), dengue hemorraghic fever (DHF), and chikungunya (Chik). For binomial variables (first column on the left), bars denote mean percentage with whiskers denoting 95% confidence intervals. For continuous variables (right 2 columns), the box shows the median values (in white) with the interquartile ranges, while the whiskers denote the central 95thpercentiles. The red brackets to the left of the bars denote statistically significant comparisons between DF and chikungunya (upper brackers), and DHF and chikungunya (lower brackets). Uniformly distributed jitter of up to612 h has been added to the days since onset and duration of fever for graphical purposes. Five DF patients with no temperature measurement are excluded from the maximum temperature panel.
validate the decision trees and to estimate their predictive power [28]. The correct classification percentages for chikungunya and DF/DHF were then computed based on the classification as represented in the decision trees over the actual number of cases.
Time course analysis
To quantify mean changes in temperature, serum hematocrit, platelet and leukocyte counts, while accounting for between patient variability, we used hierarchical modelling within the Bayesian framework. We used a Markov model for the daily means with homoskedastic stochastic innovations, homoskedastic errors, with random effects assumed to act multiplicatively on the grand mean. The data model isyi tj
*N bibj,s2
, whereyi tj
is the measurement of quantityytaken of individualiat timetj(if measured). The parameter model is bi*logN 0,sb2
,
bj*N bj-1,sb 2
for j.1, bj*N 0,1002 for j= 1 and
s{2,s
b{2,sb{2*Cð0:01,0:01Þ. The model was fitted in open-BUGS [29] using 100 000 iterations following 1000 iterations discarded as burn-in and with every tenth draw exported for subsequent analysis. Parameter estimates were then transformed to yield estimates and 95% credible intervals of the dynamic average values of the four covariates for both infections.
All statistical analyses were performed in the R statistical environment [29] or using openBUGS [30].
Ethics approval
This study was approved by Domain Specific Review Board, National Healthcare Group, Singapore (DSRB-B/05/115 and DSRB-E/08/567).
Results
Differences in clinical expression between DF, DHF and chikungunya
Differences between DF, DHF and chikungunya at presentation are shown in figure 1 (results over the course of hospitalization are similar and not presented). Not all chikungunya patients were febrile, although all dengue cases were. Statistically significantly more chikungunya patients had myalgia or arthralgia, and fewer had a sore throat, cough (for DF), nausea, vomiting, diarrhea, abdominal pain, anorexia or tachycardia than patients with DF or DHF. Notably, chikungunya patients had significantly higher leukocyte counts than either DF or DHF patients, with 76% of chikungunya cases having a leukocyte count of 3.66109/L or more, and 76–78% of DF and DHF patients having a leukocyte count of 3.66109/L or less. Stronger still was the difference between platelet counts with 92% of DHF and 77% of DF having a platelet count at presentation of,1006109/L versus only 2% of chikungunya patients with similar degree of thrombocytopenia.
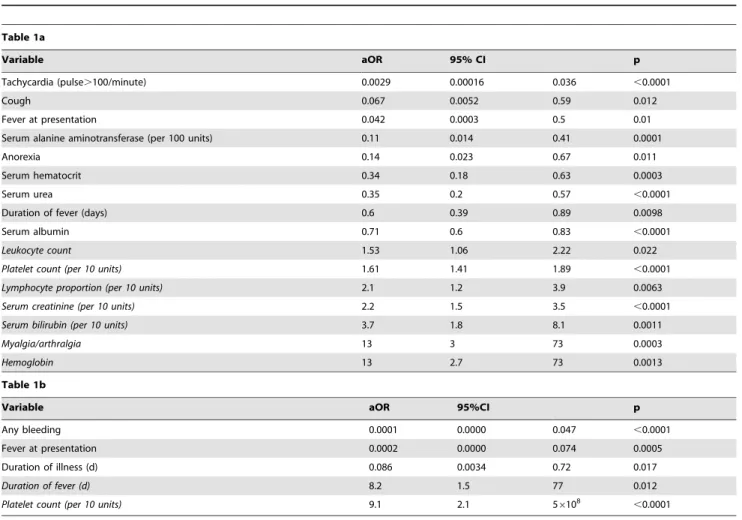
Table 1.Multivariate logistic regression of dengue fever versus chikungunya infection (Table 1a); and dengue hemorrhagic fever versus chikungunya (Table 1b) at presentation among in-patients Tan Tock Seng Hospital, Singapore.
Table 1a
Variable aOR 95% CI p
Tachycardia (pulse.100/minute) 0.0029 0.00016 0.036 ,0.0001
Cough 0.067 0.0052 0.59 0.012
Fever at presentation 0.042 0.0003 0.5 0.01
Serum alanine aminotransferase (per 100 units) 0.11 0.014 0.41 0.0001
Anorexia 0.14 0.023 0.67 0.011
Serum hematocrit 0.34 0.18 0.63 0.0003
Serum urea 0.35 0.2 0.57 ,0.0001
Duration of fever (days) 0.6 0.39 0.89 0.0098
Serum albumin 0.71 0.6 0.83 ,0.0001
Leukocyte count 1.53 1.06 2.22 0.022
Platelet count (per 10 units) 1.61 1.41 1.89 ,0.0001
Lymphocyte proportion (per 10 units) 2.1 1.2 3.9 0.0063
Serum creatinine (per 10 units) 2.2 1.5 3.5 ,0.0001
Serum bilirubin (per 10 units) 3.7 1.8 8.1 0.0011
Myalgia/arthralgia 13 3 73 0.0003
Hemoglobin 13 2.7 73 0.0013
Table 1b
Variable aOR 95%CI p
Any bleeding 0.0001 0.0000 0.047 ,0.0001
Fever at presentation 0.0002 0.0000 0.074 0.0005
Duration of illness (d) 0.086 0.0034 0.72 0.017
Duration of fever (d) 8.2 1.5 77 0.012
Platelet count (per 10 units) 9.1 2.1 56108 ,0.0001
Estimates are derived using Firth’s modified score procedure, and confidence intervals using profile penalised likelihoods, as described in the text. Adjusted odds ratios (aOR) are in favour of chikungunya infection: variables associated with chikungunya are indicated in italic type.
However, there was substantial overlap in most signs, symptoms and laboratory measurements.
Predicting chikungunya versus DF or DHF
The multivariate logistic regression analysis comparing DF versus chikungunya and DHF versus chikungunya at first presentation to hospital are shown in Tables 1a and 1b respectively. Tachycardia, cough, fever at presentation and duration, anorexia, and higher ALT, hematocrit, urea, and albumin levels were indicative of DF, while higher platelet count, hemoglobin, lymphocyte proportion, creatinine, bilirubin, and more myalgia/arthralgia were predictive of chikungunya. Bleed-ing, presence of fever and longer duration of illness at presentation were indicative of DHF, while a longer duration of fever and a higher platelet count increased the odds that the patient had chikungunya.
Over their entire hospital stay (Table 2a), DF patients were more likely to have tachycardia, fever, and higher ALT, urea and albumin levels, while chikungunya patients were more likely to have higher maximum creatinine, minimum neutrophil propor-tion, minimum platelet count, maximum temperature, and maximum bilirubin levels. DHF cases were more likely to have bleeding, fever, and tachycardia, while chikungunya cases were more likely to have higher minimum serum protein (Table 2b).
The decision trees for determining DF versus chikungunya, and DHF versus chikungunya at first presentation to hospital are shown in Figure 2. The tree designed for resource-limited settings without laboratory testing comparing DF and chikungunya (Figure 2A) presented sensitivity of 95% and specificity of 36% in the prediction of dengue fever (Table 3) but was a relatively poor predictor of chikungunya (64% positive predictive value, Table 3). If laboratory variables are incorporated, the sensitivity increases by 4% and the specificity by 16% and 32% for the
prediction of DF and chikungunya respectively (Table 3). The tree comparing DHF and chikungunya in a limited-resource setting (Figure 2C), has high sensitivities and specificities but a positive predictive value of only 76% (Table 3). The tree for DHF versus chikungunya using laboratory variables (Figure 2D) could identify all DHF patients correctly (positive predictive value of 100%) and almost all the chikungunya patients (positive predictive value of 97%, Table 3). The trees could discriminate very well between chikungunya and dengue with a single laboratory variable: the platelet count. Without laboratory variables it is still possible to discriminate reasonably well for DHF (using the rule, bleeding implies DHF). However, the use of this tree as an admission protocol in resource-limited settings might be questionable since 24% of DHF patients would not be hospitalized and this may have severe clinical implications (positive predictive value of 76%, Table 3). The tree we identified as best for distinguishing DF and chikungunya relied on the duration of illness and fever which was not very discriminating, indicating the difficulty in characterizing these two illnesses solely with signs or symptoms (Figure 2A).
Temporal trend of DF, DHF and chikungunya
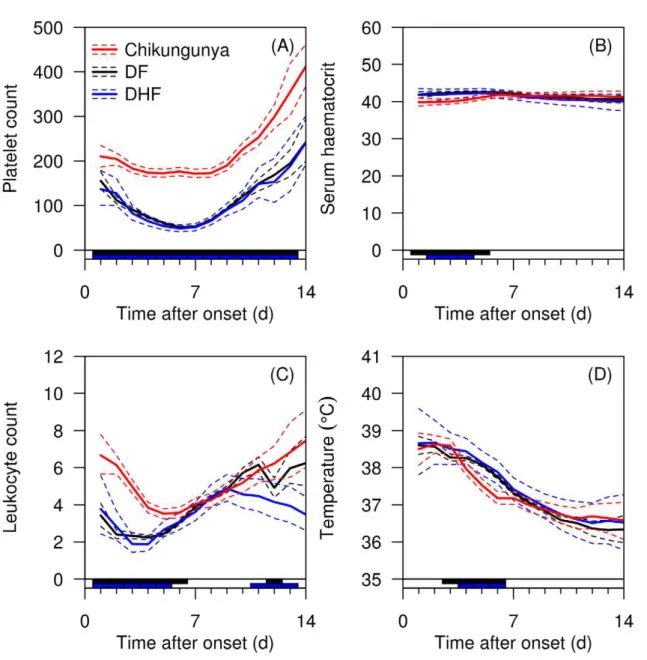
The time course analysis presented in Figure 3 supports platelet count as the key distinguishing variable for chikungunya and dengue infections, with the average platelet count scarcely dropping below 2006109/L in patients with chikungunya, but dropping below 1006109/L in dengue infections. Chikungunya caused a slower drop in leukocyte count than dengue infections. Smaller differences were present for hematocrit and temperature.
Discussion
Chikungunya and dengue share overlapping geographic range and competent vectors [3,31], with chikungunya occurring in
Table 2.Multivariate logistic regression of dengue fever versus chikungunya infection (Table 2a); and dengue hemorrhagic fever versus chikungunya (Table 2b) during entire hospital stay among inpatients at Tan Tock Seng Hospital, Singapore, 2006–8.
Table 2a
Variable aOR 95% CI p
Tachycardia (pulse.100/minute) 0.00073 0.0000 0.027 ,0.0001
Fever ever 0.0009 0.0000 0.048 0.0017
Maximum serum alanine aminotransferase (per 100 units) 0.4 0.018 0.66 0.0003
Maximum serum urea 0.51 0.29 0.8 0.002
Minimum serum albumin 0.65 0.5 0.79 ,0.0001
Maximum serum creatinine (per 10 units) 1.78 1.27 2.69 0.0013
Minimum neutrophil proportion (per 10 units) 2.3 1.1 5.3 0.02
Minimum platelet count (per 10 units) 2.3 1.9 3.3 ,0.0001
Maximum temperature (uC) 3.9 1.3 18 0.0094
Maximum serum bilirubin (per 10 units) 6.1 2 19 0.0022
Table 2b
Variable aOR 95% CI p
Any bleeding ever 0.000053 0.0000 0.0017 ,0.0001
Fever ever 0.009 0.000034 0.34 0.014
Tachycardia (pulse.100/minute) ever 0.029 0.0009 0.46 0.011
Minimum serum protein (per 10 units) 43 4.7 2000 0.0003
Estimates are derived using Firth’s modified score procedure, and confidence intervals using profile penalised likelihoods, as described in the text. Adjusted odds ratios (aOR) are in favour of chikungunya infection: variables associated with chikungunya are indicated in italic type.
epidemics in Africa, India, Sri Lanka and Southeast Asia [3], and dengue in most tropical and subtropical regions of the world [32]. Both have caused autochthonous outbreaks in non-endemic areas, namely dengue in Hawaii and Texas-Mexico border [33] and metropolitan France [34], and chikungunya in Italy [35] and metropolitan France [34]. Notably, serological surveys in South-east Asia documented the presence of both dengue and chikungunya [36]; and similar findings were present among German aid workers returning from Benin, Burkina Faso, Cameroon and Thailand [37]. Concurrent dengue and chikungu-nya may also occur, as proven by PCR in 10 of 38 patients in Madagascar [38] and in a traveller to Singapore [39].
While chikungunya has occurred in localized epidemics in in Africa, South and Southeast Asia since the 1950’s, a molecular mutation A226V resulting in more efficient viral replication and transmission inAedes albopictushas enabled rapid expansion of its geographical range in the Indian Ocean since 2006 [40–42]. The overlapping geographic range and clinical manifestations of chikungunya and dengue, often in resource-limited countries, has made a diagnostic tool utilizing simple clinical criteria relevant and potentially useful.
In our study, there was substantial overlap in the symptoms and signs for dengue and chikungunya infections although key significant differences existed. Many of these differences have
substantial overlap and there is substantial variability between individuals with the same illness, rendering their utility in diagnostic differentiation limited (Figure 1). Similar to previous studies [11–17], the differences that are most apparent at presentation are leukocytosis and myalgia/arthralgia which were more likely to be present in chikungunya cases, while thrombo-cytopenia were more likely to be present in dengue cases. In addition, during the entire course of illness, thrombocytopenia and neutropenia were more likely to be present in dengue cases. To assist doctors in differentiating between these two infections for appropriate triaging for site of care and clinical management, diagnostic and prognostic algorithms that are highly sensitive with high negative predictive values are desirable. Specifically, there is a need to identify patients with DHF as they require meticulous follow up and clinical management in hospital, while uncompli-cated dengue and chikungunya can be managed on an outpatient basis.
The decision trees shown in Figure 2 will provide doctors with the necessary tools to identify DF versus chikungunya and more importantly DHF versus chikungunya. These simple tools can also supplement other laboratory tools such as the rapid immunochro-matographic NS-1 tests for dengue which are now available and can provide additional differentiation between these two diseases [43]. Using only clinical variables of fever, duration of fever and
Figure 2. Decision tree models for discrimination.Models discriminate between dengue fever (DF) or dengue hemorrhagic fever (DHF) and chikungunya (Chik) for well-resourced (laboratory data included) and resource-limited (laboratory data excluded) settings. A and B discriminate between chikungunya and DF in a resource-limited and well-resourced setting respectively. C and D discriminate between chikungunya and DHF in a resource-limited and well-resourced setting respectively. Final classifications as chikungunya are shaded in grey, while classifications for DF/DHF are unshaded.
Table 3.Sensitivity (sens.), specificity (spec.), positive predictive value (PPV) and area under the receiver operating curve (AUC) for decision tree models to discriminate between dengue fever (DF) or dengue hemorrhagic fever (DHF) versus chikungunya, using data at presentation.
Model
Suitable for less resourced settings?
Sens. detect DF/DHF
Spec. detect DF/DHF
PPV detect DF/DHF
Sens. detect chikungunya
Spec. detect chikungunya
PPV detect
chikungunya AUC
chikungunya vs DF Yes 0.95 0.36 0.84 0.36 0.95 0.64 0.59
chikungunya vs DF No 0.99 0.52 0.88 0.52 0.99 0.95 0.91
chikungunya vs DHF Yes 0.95 0.90 0.76 0.90 0.95 0.98 0.91
chikungunya vs DHF No 0.93 1.00 1.00 1.00 0.93 0.97 0.99
doi:10.1371/journal.pntd.0001786.t003
Figure 3. Time course analysis of selected variables.Analysis shows platelet counts (A), serum hematocrit (B), leukocyte (C), and temperature (D) for dengue fever (DF), dengue hemorrhagic fever (DHF) and chikungunya. Individual data are indicated in semi-transparent red (chikungunya), black (DF), and blue(DHF) lines. Overall means are indicated as solid lines, with 95% credible intervals as dashed lines. The bar on X-axis indicates in black days with a ‘significant’ difference (defined as 95% credible interval for the difference between the two disease means not crossing zero) between chikungunya and DF, and the blue bar between chikungunya and DHF.
illness (Figure 2A, likely to be only parameters available in resource-limited settings) is not as discriminating as the single laboratory variable of platelet count (Figure 2B) for DF versus chikungunya (Table 3). Similarly, the decision trees comparing DHF versus chikungunya in resource-limited settings (using bleeding only, Figure 2C) would incorrectly classify 24% of DHF cases which may lead to inappropriate case management. In well-resourced (using platelet count and bleeding, Figure 2D) settings, discrimination for DHF is 100%. For both DF and DHF versus chikungunya, decision trees using clinical variables only performed less well compared with clinical and laboratory variables (area under the receiver operating curve [AUC] for DF versus chikungunya, 0.59 versus 0.91, and for DHF versus chikungunya, 0.91 versus 0.99).
While it is useful to examine these variables at a static time point especially at hospital presentation, it may be helpful to understand the development of key clinical variables across time as the time of presentation to healthcare settings may vary in different settings. From our time course analysis, it is evident that DF and DHF had significantly lower platelet count across the entire hospitalization while the mean platelet count in chikungunya was within the normal range. Notably, DF and DHF had significantly higher hematocrit and temperature in the first week of illness, as rising hematocrit represents plasma leakage, a hallmark of DHF [5,6]. Interestingly DF and DHF had significantly lower leukocyte count in the first week of illness, noted in similar work in Vietnam and Singapore [44]; this recovered during the start of the second week. There are some limitations to our study. The dengue virus predominant in 2004 was serotype 1, and our cohorts comprised adult patients. There is a need to validate our findings in different settings with different dengue serotypes and children for better generalization. In addition, our dengue and chikungunya cohorts
were from different time periods. Although the management protocol for dengue did not change substantially from 2004 to 2008, our chikungunya cases occurred during the first ever large-scale outbreak in Singapore with heightened national alert for clinical case detection. This would affect time from illness onset to presentation (days since onset, Figure 1). The clinical and laboratory data for chikungunya were collected prospectively during the outbreak, while the data for dengue were retrospec-tively collected. However, all our dengue cases were managed by doctors experienced in dengue treatment in the Department of Infectious Diseases with a standardized care path, which mitigated somewhat potential data inaccuracy in a retrospective study. The number of chikungunya and DHF cases in this study was relatively small, and although key variables could still be estimated accurately, future studies should be performed with larger datasets in different settings to validate these findings. In addition, while the 1997 WHO criteria was used to classify dengue cases, future studies should also consider the 2009 WHO criteria for severe dengue classification for comparison.
Dengue and chikungunya infections continue to co-exist in many tropical countries. Our study has shown that there is indeed substantial overlap in clinical presentation between these infec-tions. At the same time, we have also shown that it is possible for clinicians to use simple clinical and laboratory variables to predict these infections for appropriate management.
Author Contributions
Conceived and designed the experiments: VJL AC DCL YSL. Performed the experiments: VJL AC DCL. Analyzed the data: VJL AC XZ LRC ARC. Contributed reagents/materials/analysis tools: VJL AC XZ LRC ARC. Wrote the paper: VJL AC XZ LRC ARC DCL LCN YSL.
References
1. World Health Organization (2009) Fact sheet number 117. Dengue and dengue haemorraghic fever. Available: http://www.who.int/mediacentre/factsheets/ fs117/en/index.html
2. World Health Organization (2008) Fact sheet number 327. Chikungunya. Available: http://www.who.int/mediacentre/factsheets/fs327/en/
3. Pialoux G, Gau¨ze`re BA, Jaure´guiberry S, Strobel M (2007) Chikungunya, an epidemic arbovirosis. Lancet Infect Dis 7:319–327.
4. Staples JE, Breiman RF, Powers AM (2009) Chikungunya fever: an epidemiological review of a re-emerging infectious disease. Clin Infect Dis 49:942–948.
5. WHO (2009) Dengue: guidelines for diagnosis, treatment, prevention and control. World Health Organization, Geneva.
6. WHO (1997) Dengue haemorrhagic fever: diagnosis, treatment, prevention and control. 2ed. World Health Organization, Geneva.
7. Lee VJ, Lye DCB, Sun Y, Fernandez G, Ong A, Leo YS (2008) Predictive value of simple clinical and laboratory variables for dengue hemorrhagic fever in adults. J Clin Virol 42:34–39.
8. Wills BA, Nguyen MD, Ha TL, Dong TH, Tran TN, et al. (2005) Comparison of three fluid solutions for resuscitation in dengue shock syndrome. N Engl J Med 353:877–889
9. Ingram PR, Mahadevan M, Fisher DA (2009) Dengue management: practical and safe hospital-based outpatient care. Trans R Soc Trop Med Hyg 103:203–205. 10. Economopoulou A, Dominguez M, Helynck B, Sissoko D, Wichmann O, et al.
(2009) Atypical Chikungunya virus infections: clinical manifestations, mortality and risk factors for severe disease during the 2005–2006 outbreak on Re´union. Epidemiol Infect 137:534–541.
11. Halstead SB, Nimmannitya S, Margiotta MR (1969) Dengue and chikungunya virus infection in man in Thailand, 1962–1964. II. Observations on disease in outpatients. Am J Trop Med Hyg 18:972–983
12. Nimmannitya S, Halstead SB, Cohen SN, Margiotta MR (1969) Dengue and chikungunya virus infection in man in Thailand, 1962–1964. I. Observations on hospitalized patients with hemorrhagic fever. Am J Trop Med Hyg 18:954–971. 13. Halstead SB, Udomsakdi S, Singharaj P, Nisalak A (1969) Dengue chikungunya virus infection in man in Thailand, 1962–1964. 3. Clinical, epidemiologic, and virologic observations on disease in non-indigenous white persons. Am J Trop Med Hyg 18:984–996.
14. Hochedez P, Canestri A, Guihot A, Brichler S, Bricaire F, et al. (2008) Management of travelers with fever and exanthema, notably dengue and chikungunya infections. Am J Trop Med Hyg 78:710–713.
15. Kularatne SA, Gihan MC, Weerasinghe SC, Gunasena S (2009) Concurrent outbreaks of Chikungunya and Dengue fever in Kandy, Sri Lanka, 2006–07: a comparative analysis of clinical and laboratory features. Postgrad Med J 85:342–346. 16. Taraphdar D, Sarkar A, Mukhopadhyay BB, Chatterjee S (2012) A comparative study of clinical features between monotypic and dual infection cases with Chikungunya virus and dengue virus in West Bengal, India. Am J Trop Med Hyg 86:720–723.
17. Laoprasopwattana K, Kaewjungwad L, Jarumanokul R, Geater A (2012) Differential diagnosis of Chikungunya, dengue viral infection and other acute febrile illnesses in children. Pediatr Infect Dis J 31:459–463.
18. Ooi EE, Goh KT, Gubler DJ (2006) Dengue prevention and 35 years of vector control in Singapore. Emerg Infect Dis 12:887–893.
19. Lee KS, Lai YL, Lo S, Barkham T, Aw P, et al. (2010) Dengue virus surveillance for early warning, Singapore. Emerg Infect Dis 16:847–949.
20. Leo YS, Chow AL, Tan LK, Lye DC, Lin L, et al. (2009) Chikungunya outbreak, Singapore, 2008. Emerg Infect Dis 15:836–837.
21. Win MK, Chow A, Dimatatac F, Go CJ, Leo YS (2010) Chikungunya fever in Singapore: acute clinical and laboratory features, and factors associated with persistent arthralgia. J Clin Virol 49:111–114.
22. Lee VJ, Lye DC, Sun Y, Leo YS (2009) Decision tree algorithm in deciding hospitalization for adult patients with dengue haemorrhagic fever in Singapore. Tropical Medicine & International Health 14:1154–1159
23. Barkham TM, Chung YK, Tang KF, Ooi EE (2006) The performance of RT-PCR compared with a rapid serological assay for acute dengue fever in a diagnostic laboratory. Trans R Soc Trop Med Hyg 100:142–148.
24. Ng LC, Tan LK, Tan CH, Tan SS, Hapuarachchi HC, et al. (2009) Entomologic and virologic investigation of Chikungunya, Singapore. Emerg Infect Dis 15:1243–1249.
25. Heinze G, and Schemper M A (2002) Solution to the Problem of Separation in logistic regression. Statistics in Medicine 21:2409–2419.
26. Heinze G (2006) A comparative investigation of methods for logistic regression with separated or nearly separated data. Statistics in Medicine 25:4216–4226. 27. Breiman L (1984) Classification and regression trees. Belmont, Calif: Wadsworth
International Group. X:358.
28. Ripley BD (1996) Pattern recognition and neural networks. Cambridge: Cambridge University Press. xi:403.
30. Lunn D, Spiegelhalter D, Thomas A, Best N (2009) The BUGS project: Evolution, critique, and future directions, Statistics in Medicine 28:3049–3067. 31. Gubler DJ (1998) Dengue and dengue hemorrhagic fever.Clin Microbiol Rev
11:480–496.
32. Guzman MG, Halstead SB, Artsob H, Buchy P, Farrar J, et al. (2010) Dengue: a continuing global threat. Nat Rev Microbiol 8:S7–S16.
33. Morens DM, Fauci AS (2008) Dengue and hemorrhagic fever: a potential threat to public health in the United States. JAMA 299:214–216.
34. Gould EA, Gallian P, De Lamballerie X, Charrel RN (2010) First cases of autochthonous dengue fever and chikungunya fever in France: from bad dream to reality! Clin Microbiol Infect 16:1702–1704.
35. Rezza G, Nicoletti L, Angelini R, Romi R, Finarelli AC, et al. (2007) CHIKV study group. Infection with chikungunya virus in Italy: an outbreak in a temperate region. Lancet 370:1840–1846.
36. Rao TR (1971) Immunological surveys of arbovirus infections in South-East Asia, with special reference to dengue, chikungunya, and Kyasanur Forest disease. Bull World Health Organ 44:585–591.
37. Eisenhut M, Schwarz TF, Hegenscheid B (1999) Seroprevalence of dengue, chikungunya and Sindbis virus infections in German aid workers. Infection 27:82–85.
38. Ratsitorahina M, Harisoa J, Ratovonjato J, Biacabe S, Reynes JM, et al. (2008) Outbreak of dengue and Chikungunya fevers, Toamasina, Madagascar, 2006. Emerg Infect Dis 14:1135–1137.
39. Chang SF, Su CL, Shu PY, Yang CF, Liao TL, et al. (2010) Concurrent isolation of chikungunya virus and dengue virus from a patient with coinfection resulting from a trip to Singapore. J Clin Microbiol 48:4586–4589.
40. Schuffenecker I, Iteman I, Michault A, Murri S, Frangeul L, et al. (2006) Genome microevolution of chikungunya viruses causing the Indian Ocean outbreak. PLoS Med 3:e263
41. Vazeille M, Moutailler S, Coudrier D, Rousseaux C, Khun H, et al. (2007) Two Chikungunya isolates from the outbreak of La Reunion (Indian Ocean) exhibit different patterns of infection in the mosquito, Aedes albopictus. PLoS One 2:e1168.
42. Tsetsarkin KA, Vanlandingham DL, McGee CE, Higgs S (2007) A single mutation in chikungunya virus affects vector specificity and epidemic potential. PLoS Pathog 3:e201.
43. Tricou V, Vu HT, Quynh NV, Nguyen CV, Tran HT, et al (2010) Comparison of two dengue NS1 rapid tests for sensitivity, specificity and relationship to viraemia and antibody responses. BMC Infect Dis 10:142.