1
Making Ends Meet: Hmong Socioeconomic Trends in the U.S.
By
Chia Youyee Vang, Ph.D. University of Wisconsin-Milwaukee
Hmong Studies Journal, Volume 13(2), 2010 Census Issue, 20 Pages
Abstract
This article examines Hmong socioeconomic trends from 1990 to 2010. A review of economic indicators across states and in relation to the U.S. population reveals that on an aggregate level, the Hmong American population’s socioeconomic status has improved significantly. The increases in income and earnings have, however, been shortchanged by external factors brought about partially by the financial crisis and its aftermath. Consequently, this begs us to question the extent to which such developments contribute to the overall economic wellbeing of Hmong Americans.
Keywords: Hmong Americans, socioeconomic status, income, poverty
Introduction
Today Hmong Americans are found throughout the United States. Internal migrations
have resulted in the establishment of large and small communities, and the Hmong seem to thrive
in certain locations more than others (Vang, 2010). Although they are a small proportion of the
U.S. population, the exponential growth of the Hmong American community and their
concentration in a few states makes them stand out. What factors have contributed to differences
in socioeconomic status of Hmong Americans in the various communities? To what extent has
the U.S. economic recession impacted Hmong Americans? Given their concentration in certain
industries, how has their employment status been affected by significant job losses in those
2
social and economic characteristics over the last few decades to attain a snapshot of how the
Hmong American community is faring at the beginning of the twenty-first century.
Methodology
Using Census data from 1990, 2000, and 2010,1 this study examined indicators of
socioeconomic status across geographic locations and in relation to the overall U.S. population.2 Greater attention is given to developments in the three states with the largest Hmong
populations: California, Minnesota, and Wisconsin. When information is available, comparisons
are made with states that have smaller population sizes.
Indicators of Economic Wellbeing
Education, income and occupation are commonly used to measure socioeconomic status.
Since the majority of foreign-born Hmong Americans arrived in the U.S. with little or no formal
education, few have been able to access high paying jobs. The situation is exacerbated by the
recent economic recession. Similar to other Americans, it is difficult for many Hmong
Americans to be optimistic about the U.S. economy when they are faced with limited job
opportunities at the local level, and gloom often dominates state and national employment
forecasts. In his August 26, 2011 speech at the Federal Reserve Bank of Kansas City Economic
Symposium, Federal Reserve Bank Chairman Ben S. Bernanke asserted:
[It] is clear that the recovery from the crisis has been much less robust than we had hoped. From the latest comprehensive revisions to the national accounts as well as the most recent estimates of growth in the first half of this year, we have learned that the recession was even deeper and the recovery even weaker than we had thought; indeed, aggregate output in the United States still has not returned to the level that it attained before the crisis. Importantly, economic growth has for the most part been at rates insufficient to achieve sustained reductions in unemployment, which has recently been fluctuating a bit above 9 percent.
The Organization of Economic Cooperation and Development (OECD) further contends in its
3
spending during the first half of 2011, real Gross Domestic Product (GDP) growth in the U.S.
was projected to increase only gradually in 2012 and 2013. The housing demand had increased
noticeably, but the overhang of unsold homes and the tide of foreclosures will restrain the revival
in residential investment (2012). Such assessments result from the fact that job creation has not
kept up with labor demands. Despite many Americans’ willingness to work, the number and types of jobs that they seek continues to dwindle.
Employment Status
The United States Department of Labor defines people with jobs as employed while
people who are jobless, looking for jobs, and available for work are considered unemployed.
People who are neither employed nor unemployed are not in the labor force. The sum of the
employed and the unemployed population (16 years and over) constitute the civilian labor force.3 When examining Hmong labor force participation, notable increases in the percentage of those
who are employed are evident. The gap between Hmong employment and that of the U.S.
population narrowed from 1990 to 2010, as shown in Table 1. In 1990, there was a 40%
difference, but by 2000, it had decreased to 15%, and then to 9% in 2010.
Table 1. Labor Force Participation4 Year Percent civilian
Employed
1990 60% (24%)
2000 62% (47%)
2010 65% (56%)
Table 2 shows marked differences in labor force participation in the three states that have
the largest Hmong populations. The percentage of Wisconsin’s employed Hmong population
most closely mirrors the state’s overall population (from 2% in 2000 to 1% in 2010). The gap
between Hmong and state populations in California and Minnesota are much higher, but it is
4
2000 and 2010. Employment rate variations are found when comparing Hmong populations
across the country. Data from 2010 shows that the highest percentage of employment is found in
Georgia (79%) followed by Colorado (76%), North Carolina (74%), and Arkansas (74%). The
lowest employment rate is in Oregon (57%),5 while Hmong civilian labor force rates in
California, Minnesota and Wisconsin are 49%, 59% and 63%, respectively.6 Table 2: Labor Force Participation in Large Population Concentrations
State % Civilian Employed 2000 State (Hmong)
% Civilian Employed 2010 State (Hmong)
CA 58% (38%) 58% (49%)
MN 68% (48%) 66% (59%)
WI 66% (64%) 64% (63%)
Industry
Industries that dominated Hmong employment over the course of the last three decades
include: manufacturing; education services, health care, and social assistance; and retail trade.
Hmong Americans have gravitated toward manufacturing jobs at a significantly higher rate than
the U.S. population. Whereas the U.S. population’s participation in the manufacturing industry
was 18% in 1990, 37% of employed Hmong worked in this industry. In 2000, 43% of Hmong
men worked in this industry. Although the manufacturing industry maintained its highest rate of
Hmong participation, the percentage in 2010 had decreased to 29% compared to 11% for the U.S.
population. When examining 2010 state data closely, significant differences are apparent. In
Wisconsin, 18% of the state’s population is employed in manufacturing jobs, while 40% of the
Hmong population works in this industry. Minnesota is similar to Wisconsin, with 30% of its
Hmong population working in manufacturing, compared to 14% of the state’s total population.
In contrast, 10% of California’s total population and 15% of the Hmong in California work in manufacturing. In North Carolina and Oregon, 50% of the Hmong populations work in this
5
The educational services, health care and social assistance industries are the second
largest in which Hmong work (19%).7 This should not come as a surprise, since the service
industry was the driving force behind job growth throughout the 1990s (Hatch & Clinton, 2000).
Home health care workers and social service providers added millions of jobs during that time.
An increase in formal education led many former refugees and second-generation Hmong to
work as teachers, nurses and other health care professionals, and within a multitude of social
service positions. Employers who serve Hmong families often hire bilingual staff. Whereas
many Hmong Americans work in the education services, health care and social assistance
industries in states with large Hmong populations, few do so in states such as Arkansas (2%) and
Oregon (5%).8 Occupations
As mentioned earlier, important obstacles prevented Hmong Americans from pursuing
some occupations. The most common jobs in 1990 were operators, fabricators and laborers
(32%); followed by service (20%); technical, sales, and administrative support (19%); and
precision production, craft and repair (14%). Few working Hmong Americans held managerial
and professional specialty positions (13%). Table 3 shows that Hmong occupations diversified
from 2000 and 2010. Clearly the longer the Hmong live in the U.S., the broader their occupation
distribution. More men and women had management, business, science, and arts occupations in
2000 and 2010 than in 1990. Although comparison of a few occupations is not straightforward
due to label changes, the data shows that Hmong Americans had diversified their occupations by
2010. Sales and office occupations increased for Hmong women. Occupations in management,
business, science and arts increased for both. Interestingly, the number of women in 2010 in
6
(2%) work in natural resources, construction, and maintenance occupations when compared to
Hmong men (7%).
Table 3: Hmong Occupational Distribution9
Occupations 1990 2000
Male (female)
2010
Male (female) Production, transportation & material
moving
-- 46% (37%) 38% (22%)
Sales & office -- 15% (28%) 20% (32%)
Management, business, sci. & arts -- 18% (17%) 19% (21%)
Service 20% 14% (17) 16% (23%)
Nat. resources, construction & maintenance
-- 7% (1%) 7% (2%)
Operators, fabricators & laborers 32% -- --
Precision production, craft & repair 14% -- --
Technical, sales & administrative support
19% -- --
Managerial & professional specialty 13% -- --
Hmong occupations seem to be dictated by the types of employment opportunities
available in different geographic locations; thus, certain occupations are more common in some
states than others. When comparing Hmong occupations in different locations in 2010, the
highest percentage of Hmong in management, business, science, and arts occupations was seen
in Oregon (27%). Southern states had fewer people in these types of jobs, illustrated by
Arkansas, North Carolina and Oklahoma each having only 9%. Alaska had the highest
percentage participating in service occupations (33%) when compared to all other states with
Hmong populations over 2,000, while the lowest was seen in Colorado (6%). The Hmong
population in Alaska population also had the highest percentage of residents working in sales and
office occupations (47%), but was the lowest in production, transportation, and material moving
occupations (11%). Whereas 31% of the US population had production, transportation, and
7
much higher in multiple states: Arkansas (53%), North Carolina (49%), Colorado (46%),
Oklahoma (44%), Wisconsin (43%), Michigan (40%) and Oregon (40%).10
Income
In households with low earnings, it often requires multiple wage earners to make ends
meet. According to the Census Bureau, household income includes the income of the head of
household, as well as all other individuals over 15 years old in the household, whether they are
related to the householder or not. Family income consists of the incomes of all members over 15
years old who are related to the householder.11 The fact that some households have higher percentages of earnings does not necessarily translate into higher income. For example, 91% of
Hmong American households in 2010 had earnings, which was higher than the 79% of U.S.
households with earnings, but as seen in Table 4, Hmong household income lagged dramatically
behind the U.S. population. Since 1990, the gap in household income has narrowed, but the
difference between the U.S. population per capita and Hmong per capita income has widened.
Larger family size and lower income help to explain the latter.
Table 4: Hmong Household and Per Capita Income
Year Household U.S. (Hmong)
Per Capita U.S. (Hmong) 1990 $30,056 ($14,276) $14,387 ($2,692) 2000 $41,994 ($32,076) $21,587 ($6,600) 2010 $51,200 ($47,200) $26,279 ($11,766)
The most recent Census found that among the three states with large Hmong populations,
the biggest difference in median household income is seen in California. Whereas the state
median household income is $60,000, the Hmong median household income is $43,400. In
Minnesota, it is $56,500 compared to $49,400. The Hmong median household income in
8
Hmong median family income, it is $15,000 lower than the total U.S. population ($62,100
compared to $47,400). The family income differences in California and Minnesota are even
greater by $25,000 ($67,800 compared to $42,600) and $22,000 ($70,400 compared to $48,200),
respectively. The difference in Wisconsin is $14,000 ($64,000 compared to $50,000).12 The
highest Hmong median household and family incomes are not found in the three states with large
Hmong populations –Colorado’s Hmong population leads in both, with a median household income of $65,100 and a median family income of $73,300, followed by Georgia with a median
household income of $54,000 and median family income of $58,600. The lowest is found in
Alaska with $23,700 as the median household income, and median family income of $24,100.13
Hmong earnings in general are significantly lower than that of the U.S. population. When
gender and household composition are taken into consideration, the differences are even more
significant. In 2000, the median earnings for persons 16 years and over in the U.S. population
was $23,755, while Hmong Americans had median earnings of $15,835. When the Hmong data
is disaggregated, Hmong women have median earnings that are even lower ($13,056 compared
to $18,221 for Hmong men). For 2010, median earnings for Hmong males doing full-time,
year-round work are $15,500 less than males in the U.S. population ($30,900 compared to $46,400).
Although women in the U.S. population earn less than men, their earnings are higher than that of
Hmong men ($36,100 compared to $30,900). Hmong women have median earnings ($27,800)
that are slightly lower than Hmong men.14 Lack of formal education, in addition to employment
concentration in low-paying jobs contributes to this dire condition. Also, a higher percentage of
Hmong households receive supplemental security income (SSI) than the U.S. general population
9 Poverty Status
Given their low earnings and income status, it is understandable that a higher proportion
of the Hmong American population would experience poverty. According to the U.S. Federal
Poverty Guidelines, a family of four making less than $23,050 annually is considered to be living
in poverty.16 Table 5 illustrates the considerable decrease in poverty rate among Hmong
Americans since 1990. Whereas 64% lived below the poverty line in 1990 (compared to 14% in
U.S. population), in 2000 the Hmong poverty rate was reduced to 38% (compared to 12% in U.S.
population), and by 2010, the rate had decreased to 25% (compared to 11% in U.S. population).
Table 5: Poverty Rate
Year Poverty Rate
U.S. (Hmong)
1990 14% (64%)
2000 12% (38%)
2010 11% (25%)
The decreases in poverty rates seen above are notable, but it should not be overlooked
that the Hmong American poverty rate is twice as high as that of the general U.S. population in
2010. Furthermore, 2010 data shows that significant differences exist in poverty levels in the
three states with largest Hmong populations: the population of California has a poverty rate of
11% compared to the Hmong rate of 31%; Minnesota’s general population has a 7% poverty rate while Hmong experiencing poverty is at 26%; and Wisconsin residents have a poverty rate of 8%
compared to Hmong poverty rate of 19%. The most impoverished families in both the U.S. and
Hmong populations are female-headed households (30% and 44%, respectively). Those with
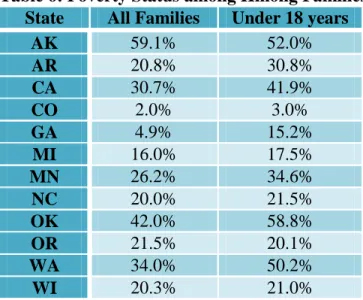
related children under the age of five experience the highest level of poverty (46% in the general
10
poverty than California: Alaska (59%), Oklahoma (42%), and Washington (34%). Georgia and
Colorado have the lowest percentages of Hmong families living in poverty, at 5% and 2%,
respectively.18 This is not surprising, however, given that the Hmong in these two states have the highest median household incomes ($65,100 in Colorado and $54,000 in Georgia).
Table 6: Poverty Status among Hmong Families State All Families Under 18 years
AK 59.1% 52.0%
AR 20.8% 30.8%
CA 30.7% 41.9%
CO 2.0% 3.0%
GA 4.9% 15.2%
MI 16.0% 17.5%
MN 26.2% 34.6%
NC 20.0% 21.5%
OK 42.0% 58.8%
OR 21.5% 20.1%
WA 34.0% 50.2%
WI 20.3% 21.0%
Households with Public Assistance
Studies examining the impoverished lives of the Hmong community have been the norm
for years due to the initial reliance on public assistance.19 The number of Hmong participating in government programs has decreased dramatically since their initial arrival in the late 1970s, but
is still significantly higher than the U.S. population. Whereas less than 3% of the total U.S.
population receives cash public assistance income, slightly more than 12% of Hmong Americans
do. Similar differences exist in California and Minnesota; however, in Wisconsin, where 2% of
the state population relies on public cash assistance, 4% of the state’s Hmong population gets such financial support, as shown in Table 7. It is evident that while some families may not
11
percentage of Hmong in California who use food stamps is 35% while it is 33% in Minnesota
and 21% in Wisconsin.
Table7: Households with Public Assistance
Year Total U.S. (Hmong) CA (Hmong) MN (Hmong) WI (Hmong)
1990 10% (67%) -- -- --
2000 3% (30%) 5% (50%) 3% (28%) 2% (11%)
2010 3% (12%) 4% (19%) 3% (14%) 2% (4%)
Homeownership
Throughout most of the last half of the twentieth century, home ownership in American
society had been considered an asset. Owning one’s home constitutes an important part of the
“American Dream.” Despite having lower income levels than the general U.S. population, many
Hmong families have purchased their own homes. With the average Hmong family size larger
than that of the U.S. population (4.5 compared to 2.5 persons), some Hmong are motivated to
buy rather than rent because of restrictions placed on the number of people permitted in rental
units. While the homeownership rate in the U.S. population remained at 66% from 2000 to 2010,
the percentage of home ownership for Hmong Americans increased from 39% to 46% during this
period. However, the majority of Hmong Americans are renters (54%).
As Table 8 outlines, differences do exist in owner-occupied housing units across Hmong
communities, as 33% of the Hmong in California, 49% in Minnesota, and 55% in Wisconsin
own their homes. The highest rate of owner-occupied housing units is found in Arkansas (81%),
followed by Michigan (76%), Georgia (71%), Oklahoma (66%), and North Carolina (64%).20 It
is important to note that movement of Hmong to southern states was motivated by their ability to
purchase poultry farms, which partially explains the high rates of owner-occupied housing units
12 Table 8: Hmong owner-occupied housing units, 2010
State AK AR CA CO GA MI MN NC OK OR WA WI
Percentage 45% 81% 33% 52% 71% 76% 49% 64% 66% 32% 38% 55%
Discussion
It is frequently pointed out that the recent financial crisis and its aftermath have taken an
enormous toll on American families. Though a reality for those affected, it is equally necessary
to call attention that these economic problems existed before the crisis, and existed for some
more than others. Indeed, income inequality is certainly not a new phenomenon. There is no
doubt that the crisis of joblessness has pervaded urban America and small towns that depended
heavily on certain industries that have either disintegrated or moved overseas. Hmong who live
in areas with distressed labor markets are not immune to economic hardships confronted by other
Americans. The lack of jobs to provide full-time employment to the working age population has
created conditions wherein many are either working for less pay or not at all.
Hmong Americans’ heavy concentration in certain industries that have been impacted by
the U.S. economic crisis has affected multiple aspects of their lives. Their concentration in the
manufacturing industry made them vulnerable to the declining availability of manufacturing jobs
that do not require specialized training. When those with limited formal education lose a
manufacturing or production job, the probability that they will find another at the same pay is
low. As Youngjoo Cha and Stephen L. Morgan (2010) found in their study of displaced U.S.
workers between 2003 and 2008, those who are re-employed suffer from earnings losses in their
new jobs. The losses are larger among those who switch industries, especially among those who
13
Hmong Americans have sought professions in educational services, health care, and
social assistance industries primarily to provide services to members of their ethnic community.
Recent cuts to education and social programs at the state and federal levels have reduced the
number of jobs in these industries. The number of nonprofit organizations established by
Hmong Americans increased tremendously during the 1990s due to funding by philanthropic
institutions and government programs to serve those in need (Vang, 2010). The economy has
also impacted philanthropic institutions’ ability to support social assistance agencies that create
jobs for employees to serve vulnerable populations. Competition between nonprofit
organizations to serve the same population, in addition to the decrease in funding available from
foundations and corporations, have forced many of these organizations to go out of business or
reduce staff drastically. Thus, the employment opportunities in this sector no longer exist at the
rate that they did during the 1990s.
Another area of job growth from which many Hmong Americans have benefited is home
healthcare services. This industry grew the fastest during the 1990s and made the list of the top
20 in terms of number of jobs gained (Hatch & Clinton, 2000). Medicare expanded benefits to
allow more people to be eligible for home healthcare coverage, making the cost associated with
care at home less than at hospitals. Since most elderly and disabled Hmong Americans rely on
SSI and medical assistance, many are eligible for medical treatment as well as personal care
services in the comfort of their home. Minimal requirements at the state level have allowed
Hmong Americans to establish personal care agencies that provide job opportunities to people in
their community. Mainstream personal care agencies also hired bilingual staff to attract Hmong
clients. Often, family members are employed by personal care agencies to assist their elderly
14
intense competition for clients has negatively impacted the profitability of Hmong personal care
agencies. If owners are successful, they often merely break even.
For those who have invested their savings in sales and service businesses, the market has
also forced many to close their doors. For example, in the early 2000s, the real estate market
saw an increase in Hmong real estate brokers and agents in areas with large Hmong
concentrations, such as the Twin Cities and the California Central Valley. Despite record low
interest rates, joblessness and credit problems prevent many from purchasing homes, thus
reducing the need for realtor services. Other businesses established by Hmong to serve members
of their ethnic community were successful when only a few existed. Similar to real estate
brokerage firms and personal care agencies, law offices, chiropractic clinics, and grocery stores
face the challenge of only being able to serve people from the Hmong American community.
Along this same line of establishing entities to serve Hmong Americans is the creation of
Hmong-focused charter schools. Since the opening of HOPE Academy in St. Paul, Minnesota in
2001, eight charter schools are currently in operation. Most are in the Twin Cities and have
grown beyond capacity due to the large Hmong population (Moua, 2008). The first and only
charter school in Wisconsin, Hmong American Peace Academy, opened in 2004 and serves
nearly 1,000 students in Milwaukee, Wisconsin. In 2010, the first Hmong-focused charter
school in California, Yav Pem Suab (Preparing for the Future) Academy, opened in Sacramento.
Much excitement exists from education leaders and their supporters. Parents report feeling more
comfortable in these learning environments than in mainstream schools where they may not be
able to communicate with teachers and administrators. Critics argued against isolation of
Hmong students from opportunities to learn and interact with students of diverse backgrounds,
15
the recent closure of a couple charter schools in Minnesota due to low performance forces us to
rethink the opportunities.
It is evident that Hmong Americans have sought many opportunities available to them to
improve their lives in America. Taking risks to participate in the small farms industry is no
exception. The vast majority of Hmong who reside in southern states (Arkansas, Oklahoma, and
North Carolina) are farmers who contract with various companies to raise animals in large-scale
operations (i.e. chickens, turkey, and cattle). Initially considered by Hmong Americans as a way
to be their own bosses and own land, many flocked to buy poultry and breeder farms in the
Ozarks. By the mid-2000s, enormous problems loomed over their operations (Potts, 2011; Vang,
2004). Inflated appraisals, exaggerated income projection on poultry production operations,
inclusion of projected income from other sources, and underestimated living expenses
contributed to financial crisis for Hmong farmers. The lack of cash flow, high fuel costs and
repairs resulted in some not being able to maintain their operations. Some even resorted to filing
for bankruptcy instead of borrowing more from banks (Speier, 2006). When they lose their
contracts, the Hmong often have no other means of sustaining themselves, since most have
exhausted all of their finances to purchase these farms (Vang, 2010, pp. 65-67). In addition to
their own savings, some also borrowed money from family and friends, so when they fail, the
effect can be extensive.
Income is the most common measurement of wealth, but it is important to note that
wealth can be broadly defined depending on people’s values and perspectives. The decline in
overall poverty in the Hmong population from 40% in 2000 to 25% in 2010 is a sign that they
are doing better. However, income remains a significant issue for the community, as today, the
16
much lower than the general population. The high rate of those living in poverty in states such
as Alaska is troubling. With 80% of Alaska’s Hmong population working service jobs, sales and
office occupations, it suggests that many may be working in low-paying positions, and thus live
in poverty despite being employed.
This dire situation requires many to utilize safety net programs for survival. Since its
inception, social safety net programs have played an important role in U.S. society. As
temporary support until their economic situations improve, government programs have helped to
prevent higher rates of homelessness, and have ensured the health and safety of millions of
Americans. Although Hmong reliance on public assistance has decreased significantly from
their early years in the U.S., a high percentage of Hmong Americans continue to depend on
government programs. Households led by women are more likely to experience poverty than
those led by men. The increase in divorce among Hmong American couples will likely continue
to have a significant impact on female-headed households. Furthermore, the lack of retirement
income suggests that poverty will continue for many Hmong Americans. In 1990, only 3% of
Hmong households had retirement income. No change has occurred, as Hmong households that
had retirement income in 2010 remained at 3%, compared to 17% in the U.S. population. Low
paying jobs and large family sizes are possible factors influencing Hmong Americans’ inability
to save for retirement. If they struggle financially to meet their current basic needs, saving for
the future may not be a priority. If Hmong views on aging are taken into consideration, it also
may be that some expect their adult children to care for them in old age. However, the current
and foreseeable economic challenges do not suggest that Hmong adults will be able to financially
17
CONCLUSION
This review of socioeconomic trends during the last few decades illustrates that the
economic wellbeing of Hmong families varies across the country. While their overall poverty
status has decreased as their earnings and income have increased, like other Americans, the
Hmong American community continues to struggle economically. The outsourcing of both
unskilled and skilled jobs to developing countries has impacted many in the immigrant
generation who lack formal education, as well as recent college graduates. Given the numerous
factors that contribute to socioeconomic status, it is difficult to adequately address the issues
with short-term strategies. Comprehensive efforts at multiple levels are needed to empower and
enable the Hmong to improve their lives. Legislative initiatives at the state and federal level
need to include resources not only for job creation, but also job training. At the individual and
Hmong community level, education programs to guide and train people for industries with
projected job growth will help to ensure that Hmong Americans have the skills needed to meet
18
References Cited
Bernanke, B. S. (2011, August 26). The Near- and Longer-Term Prospects for the U.S. Economy. Federal Reserve Bank of Kansas City Economic Symposium, Jackson Hole, Wyoming.
Bureau of the Census (1993). 1990 Census of Population Social and Economic Characteristics, CP-2-1 (Washington DC: US Department of Commerce, Economics and Statistics Administration).
Cha, Y. and Morgan, S. L (2010). Structural Earnings Losses and Between-industry Mobility of Displaced Workers, 2003-2008. Social Science Research, Vol. 39(6), pp. 1137-1152.
Chung, RC and Bemak, F. (1996). The effects of welfare status on psychological distress among Southeast Asian refugees. The Journal of Nervous and Mental Disease. 184(6): 346-353.
Institute on Race and Poverty. (2008). Failed Promises: Assessing Charter Schools in the Twin Cities. Minneapolis: University of Minnesota Law School. Retrieved December 18, 2012, from http://www.law.umn.edu/metro/school-studies/school-choice.html.
Lapham, S. J. (1993). 1990 Census of Population: Asians and Pacific Islanders in the United States. Washington, D.C.: U.S. Department of Commerce, Economics and Statistics Administration, Bureau of the Census.
Moua, W. (March 25, 2008). Are Hmong Charter Schools Making the Grades. Hmong Today. Retrieved from http://www.tcdailyplanet.net/article/2008/03/19/are-hmong-schools-making-grades.html
Organization of Economic Co-operation and Development (May 2012). United States-Economic forecast summary. Retrieved from
http://www.oecd.org/eco/economicoutlookanalysisandforecasts/unitedsates-economicforecastsummarymay2012.htm
Paisano, E. L. (1993) We the Americans: Asians. Washington, D.C.: U.S. Department of Commerce, Economics and Statistics Administration, Bureau of the Census.
Potts, M. (June 19, 2011). The Serfs of Arkansas. The American Prospect. Retrieved November 12, 2012 from http://prospect.org/article/serfs-arkansas-0.
Sandford, M. (2009). Budget Cuts Spell Bad News for Hmong Charter Schools. Hmong Pages. Retrieved December 15, 2012, from http://www.hmongpages.com/index.php/hmoob/6-hmoob-/160-budget-cuts-spell-bad-news-for-hmong-charter-schools.
Speier, J. A. (2006). Hmong Farmers: In the Market and on the Move. St. Paul, MN. Farmer’s Legal Action Group. Retrieved December 15, 2012, from
www.flaginc.org/topics/pubs/arts/CLE_JAS.pdf
19
Westermeyer, J., Callies, A., Neider, J. (May 1990). Welfare status and psychosocial adjustment among 100 Hmong refugees. Journal of Nervous and Mental Disease, Vol 178(5), 300-306.
About the Author:
20 NOTES
1 Thanks to Yang Sao Xiong and Mark Pfeifer for assisting with gathering data from the Census Bureau, especially
Yang Sao Xiong for taking time to do descriptive runs on the data for 1990 and 2010.
2 This analysis includes American Community Survey (ACS) three- and five-year estimates. Note that three-year
estimates are available only for California, Minnesota and Wisconsin. Data included for states with Hmong populations greater than 2000 are from five-year ACS estimates. In addition to CA, MN, and WI these states include: Alaska, Arkansas, Colorado, Georgia, Michigan, North Carolina, Oklahoma, Oregon, and Washington.
3 Definitions can also be found at the United States Census Bureau, American Community Survey 2010 Subject
Definitions. http://www.census.gov/acs/www/data_documentation/documentation_main/ (Accessed September 5, 2012).
4
See the reports 1990 Census of Population: Asians and Pacific Islanders in the United States, Hmong 2000 Census
Publication: Data and Analysis and 2008-2010 American Community Survey three-year Estimates.
5 U.S. Census Bureau, 2006-2010 ACS 5-year Estimates. Note that total Hmong population 16 years and over by
state varies considerably from 52,323 in California to 663 in Arkansas.
6
U.S. Census Bureau, 2008-2010 ACS 3-year Estimates
7 U.S. Census Bureau, 2008-2010 ACS 3-year Estimates
8 U.S. Census Bureau, 2006-2010 ACS 5-year Estimates
9 Note that the category names changed from 1990 to 2000.
10
U.S. Census Bureau, 2006-2010 ACS 5-year Estimates
11 United States Census Bureau, American Community Survey 2010 Subject Definitions.
http://www.census.gov/acs/www/data_documentation/documentation_main/ (Accessed September 5, 2012).
12 U.S. Census Bureau, 2008-2010, ACS 3-year Estimates
13
U.S. Census Bureau, 2006-2010, ACS 5-year Estimates
14 U.S. Census Bureau, 2008-2010, ACS 3-year Estimates
15 U.S. Census Bureau, 2008-2010, ACS 3-year Estimates. SSI is a federal program for aged, blind, or disabled
people with little or no income. Some Hmong Americans misunderstand this program because many elderly and disabled individuals receive it. They often refer to it as “nyiaj laus”, which is literally translated as money for the elderly. However, SSI is not retirement income.
16 2012 Health and Human Services Poverty Guidelines: http://aspe.hhs.gov/poverty/12poverty.shtml/)
17 U.S. Census Bureau, 2008-2010, ACS 3-year Estimates
18
U.S. Census Bureau, 2006-2010, ACS 5-year Estimates
19 Examples of such studies include, Westermeyer, Joseph; Callies, Allan; Neider, John. “Welfare status and
psychosocial adjustment among 100 Hmong refugees”; Chung, R.C. and Bemak, F. “The effects of welfare status on psychological distress among Southeast Asian refugees.”
20
U.S. Census Bureau, 2008-2010, ACS 3-year Estimates