Normalization of Quantitative RT-PCR in Soybean Tissues
under Various Abiotic Stress Conditions
Dung Tien Le1, Donavan L. Aldrich2., Babu Valliyodan2., Yasuko Watanabe1
, Chien Van Ha1, Rie Nishiyama1, Satish K. Guttikonda2¤a, Truyen N. Quach2¤b, Juan J. Gutierrez-Gonzalez2¤c, Lam-Son Phan Tran1*, Henry T. Nguyen2*
1Signaling Pathway Research Unit, RIKEN Plant Science Center, Yokohama, Kanagawa, Japan,2National Center for Soybean Biotechnology and Division of Plant Sciences, University of Missouri, Columbia, Missouri, United States of America
Abstract
Quantitative RT-PCR can be a very sensitive and powerful technique for measuring differential gene expression. Changes in gene expression induced by abiotic stresses are complex and multifaceted, which make determining stably expressed genes for data normalization difficult. To identify the most suitable reference genes for abiotic stress studies in soybean, 13 candidate genes collected from literature were evaluated for stability of expression under dehydration, high salinity, cold and ABA (abscisic acid) treatments using delta CT and geNorm approaches. Validation of reference genes indicated that the best reference genes are tissue- and stress-dependent. With respect to dehydration treatment, theFbox/ABC,Fbox/60sgene pairs were found to have the highest expression stability in the root and shoot tissues of soybean seedlings, respectively.
Fboxand60sgenes are the most suitable reference genes across dehydrated root and shoot tissues. Under salt stress the
ELF1b/IDEandFbox/ELF1bare the most stably expressed gene pairs in roots and shoots, respectively, while60s/Fboxis the best gene pair in both tissues. For studying cold stress in roots or shoots,IDE/60sandFbox/Act27are good reference gene pairs, respectively. With regard to gene expression analysis under ABA treatment in either roots, shoots or across these tissues,60s/ELF1b,ELF1b/Fboxand60s/ELF1bare the most suitable reference genes, respectively. The expression ofELF1b/ 60s,60s/Fboxand 60s/Fboxgenes was most stable in roots, shoots and both tissues, respectively, under various stresses
studied. Among the genes tested,60swas found to be the best reference gene in different tissues and under various stress
conditions. The highly ranked reference genes identified from this study were proved to be capable of detecting subtle differences in expression rates that otherwise would be missed if a less stable reference gene was used.
Citation:Le DT, Aldrich DL, Valliyodan B, Watanabe Y, Ha CV, et al. (2012) Evaluation of Candidate Reference Genes for Normalization of Quantitative RT-PCR in Soybean Tissues under Various Abiotic Stress Conditions. PLoS ONE 7(9): e46487. doi:10.1371/journal.pone.0046487
Editor:Christian Scho¨nbach, Kyushu Institute of Technology, Japan
ReceivedJanuary 27, 2012;AcceptedSeptember 2, 2012;PublishedSeptember 28, 2012
Copyright:ß2012 Le et al. This is an open-access article distributed under the terms of the Creative Commons Attribution License, which permits unrestricted
use, distribution, and reproduction in any medium, provided the original author and source are credited.
Funding:This project was supported by the National Center for Soybean Biotechnology and the Missouri Soybean Merchandising Council. The funders had no role in study design, data collection and analysis, decision to publish, or preparation of the manuscript.
Competing Interests:The authors have declared that no competing interests exist.
* E-mail: [email protected] (L-SPT); mailto:[email protected] (HTN)
.These authors contributed equally to this work.
¤a Current address: Biotechnology Regulatory Sciences, Regulatory Sciences and Government Affairs, Dow AgroSciences, Indianapolis, Indiana, United States of America
¤b Current address: The Center for Plant Science Innovation, University of Nebraska, Lincoln, Nebraska, United States of America
¤c Current address: USDA-ARS Plant Science Research Unit and Department of Agronomy and Plant Genetics, University of Minnesota, St Paul, Minnesota, United States of America
Introduction
The study of plant adaptive responses to abiotic stresses, such as drought, high salinity and cold stress, is a rapidly growing field of research due largely to its immense impact on global food supply. Abiotic stressors are the adverse environmental conditions which are unfavorable to plant growth and include such circumstances as flooding, extreme temperatures, high soil salinity, and drought. These stressors can have detrimental effects on plants which generally result in major yield losses for the economically important crops, including soybean [1–5]. Understanding the mechanisms plants use to cope with such stresses is crucial for areas of research aimed at the engineering of soybean cultivars with increased stress tolerance [6–9]. Of the various
environmen-tal stresses, drought is one which typically receives much attention due to its pervasiveness as well as the significance of its impact to soybean yields worldwide [3,10].
induced and/or regulated by these factors is one of the most powerful approaches researchers can employ to study stress tolerance [9,12–18]. Consequently, the ability to perform high-throughput profiling sensitive enough to detect subtle changes in the expression levels of a magnitude of target genes is a valuable tool for research focused on abiotic stress-induced gene expression [1,10,19].
Three profiling techniques are currently available to study the changes in gene expression induced by abiotic stress factors. Northern blot is the first technique to have emerged which offered the capability to measure differential gene expression. This technique typically involves using electrophoretically separated RNA which is then transferred to a membrane and hybridized with a detectable complementary probe [20]. But northern blots are both time consuming and labor intensive. And although the sensitivity threshold is quite high, the qualitative nature of the technique limits the ability to accurately quantify expression levels. This, in conjunction with the low throughput aspect of northern blotting, restricts its effectiveness for expression profiling the magnitude of target genes often required for abiotic stress studies. The emergence of DNA microarray hybridization, using either cDNA microarrays or oligonucleotide microarrays [21–23], has enabled the ability to effectively screen a large number of target genes under various conditions, including environmental stimuli [24–29]. This technology uses an arrayed series of microscopic spots of DNA sequences representing individual target genes [30]. For expression profiling studies using two-color microarray, template cDNAs from control and treated samples labeled with different fluorophores are hybridized to the array, and the fluorescent signals from both fluorophores are determined for each probe spot. The differences between signal intensities from each fluorophore are used to determine the changes in gene expression between the control and treatment samples [31]. On the other hand, one-color microarrays provide intensity data for each probe which together indicate a relative level of hybridization with the labeled target [32]. The newly emerging whole-genome tiling arrays covering whole genome sequence of both strands with oligo probes have allowed us to identify many stress-inducible genes and transcripts including non-protein-coding RNAs, which were not able to be unidentified by the use of cDNA microarrays and oligonucleotide microarrays [33,34]. Although all of these microarray platforms enable us to screen thousands of gene probes simultaneously, microarray technology is not sensitive enough for detecting modest changes in gene expression [35]. Additionally, the specificities of the probe oligonucliotides in these arrays are not always high enough to ensure that individual genes are being hybridized.
Quantitative real-time polymerase chain reaction (qRT-PCR) is potentially the most sensitive method developed for detecting the changes in gene expression [36]. This process uses fluorescent dyes or probes to detect the amount of double-stranded DNA amplified from template DNA during a series of sequential PCR reactions using forward and reverse primer sequences designed to amplify a segment of a particular target gene [37,38]. The fractional PCR cycle number at which this fluorescent signal achieves a defined threshold is referred to as the Ct value and is proportional to the abundance of that target gene in the template DNA. Like DNA microarray hybridization, qRT-PCR has the ability to perform screening of a multitude of gene targets. However, unlike DNA microarrays, the nature of the PCR reaction intrinsic to this method allows for both a high sensitivity of detection as well as the use of high specificity primers to ensure that the expression levels of individual genes are being measured. These aspects of qRT-PCR make it an attractive tool for use in research related to
studying the changes in gene expressions induced by abiotic stresses in plants [23,39–42].
However, as powerful and sensitive as qRT-PCR has the potential to be, it is not without its pitfalls. A fundamental constraint on the accurate interpretation of qRT-PCR data is the necessity of a stable, constitutively-expressed reference gene which can be used as a standard measure for comparing one sample to another [43]. This normalization is typically performed in order to compensate for the variability between samples contributed by the multitude of factors which can influence the cycle threshold (CT) value obtained from a qRT-PCR reaction. Ideal reference genes for the normalization of qRT-PCR data are genes which demonstrate a consistent level of expression among control and treated samples, and in the context of studies under stresses, the expression levels of these reference genes would be unaffected by the stress treatments applied and would allow for the accurate normalization of target gene expression levels between samples. The changes of gene expression levels induced by abiotic stresses like drought, high salinity and cold can be complex and multifaceted, often affecting the expression levels of genes which would otherwise be stable and suitable as reference genes in other experimental circumstances. Consequently, it is crucial that the expression stability of potential reference gene be confirmed under abiotic stress conditions before they are utilized for the normalization of qRT-PCR data generated in these studies. For soybean, several reference genes have been available; however, these genes were validated only under normal or biotic stress conditions [44–46]. An extended search in literature identified an article on the journal of Pesquisa Agropecua´ria Brasileiraby Stolf-Moreira and coworkers which described the search for reference genes for use in qRT-PCR analysis of soybean under drought condition only [47]. Therefore, the primary objective of this study was to determine in systematic manner reference genes which demonstrate a high degree of expression stability under various abiotic stress conditions in soybean, to facilitate a more accurate normalization of qRT-PCR assays.
Materials and Methods
Plant materials, growth conditions and treatments Soybean cv. Williams 82 seeds were germinated in 6-litre pots containing vermiculite soil and grown under greenhouse condi-tions (continuous 30uC temperature, photoperiod of 12 h/12 h, 80mmol m22 s21 photon flux density and 40–60% relative
humidity). For non-stress treatment all the plants were watered at regular intervals. For stress treatment, 12-d-old plants were carefully removed from soil, and roots were gently washed to remove soil. Dehydration treatment was performed as described in [40]. For NaCl and ABA (abscisic acid) treatments, 12-d-old seedlings were immersed in a solution containing either 200 mM NaCl and 100mMABA, respectively, for 0, 2, and 10 h. Cold treatment was performed by transferring 12-d-old plants to a container maintained at 4uC for 0, 2 and 10 h. A set of plant samples was also maintained in water at room temperature for the same durations as control. After the treatments, root and shoot samples were separately collected in three biological repeats for expression analyses.
RNA isolation, DNAse treatment, and cDNA synthesis Total RNA was isolated as described by using TRIZOL reagent (Invitrogen) according to the protocol provided by the manufac-turer. RNA concentration and integrity were measured prior to DNase digestion with the NanoDrop UV-Vis spectrophotometer (NanoDrop Technologies). For each sample, 4mg of total RNA
was digested in a volume of 25ml with Turbo DNA-free DNase I
(Ambion). First-strand cDNA synthesis was performed using 1mg
Soybean reference genes for abiotic stress studies
Genes Functions Glyma ID Forward (59R39)a Reverse (5
9R39)a Ampliconlength (nt) Amplificationefficienciesb References
60s 60s Ribosomal protein L30
Glyma17g05270 AAAGTGGACCAAGGCATATCGTCG TCAGGACATTCTCCGCAAGATTCC 125 1.910 [54]
ABC ATP-binding cassette transporter
Glyma12g02310 GATCAGCAATTATGCACAACG CCGCCACCATTCAGATTATGT 106 1.866 [44]
Act11 Actin Glyma18g52780 CGGTGGTTCTATCTTGGCATC GTCTTTCGCTTCAATAACCCTA 142 1.873 [46]
Act27 Actin Glyma19g32990 CTTCCCTCAGCACCTTCCAA GGTCCAGCTTTCACACTCCAT 119 1.858 [46]
CDPK CDPK-related protein kinase
Glyma10g38460 TAAAGAGCACCATGCCTATCC TGGTTATGTGAGCAGATGCAA 97 1.885 [44]
CYP2 Cyclophilin Glyma12g02790 CGGGACCAGTGTGCTTCTTCA CCCCTCCACTACAAAGGCTCG 154 1.855 [46]
ELF1a Eukaryotic elongation factor 1 alpha
Glyma19g07240 GACCTTCTTCGTTTCTCGCA CGAACCTCTCAATCACACGC 195 1.824 [46]
ELF1b Eukaryotic elongation factor 1 beta
Glyma02g44460 GTTGAAAAGCCAGGGGACA TCTTACCCCTTGAGCGTGG 118 1.870 [46]
Fbox F-box protein familyGlyma12g05510 AGATAGGGAAATTGTGCAGGT CTAATGGCAATTGCAGCTCTC 93 1.883 [44]
IDE Insulin-degrading enzyme
AW310136 ATGAATGACGGTTCCCATGTA GGCATTAAGGCAGCTCACTCT 131 1.884 [44]
SUBI2 Ubiquitin Glyma13g17830 AGCTATTCGCAGTTCCCAAAT CAGAGACGAACCTTGAGGAGA 84 1.862 [44]
TUBa Tubulin Glyma05g29000 AGGTCGGAAACTCCTGCTGG AAGGTGTTGAAGGCGTCGTG 159 1.861 [46]
TUBb Tubulin Glyma20g27280 CCTCGTTCGAATTCGCTTTTTG CAACTGTCTTGTCACTTGGCAT 161 1.844 [46]
aThe exact locations of primers on the transcripts are shown in the data set S1. bAs calculated by LinRegPCR software.
doi:10.1371/journal.pone.0046487.t001
Soybean
reference
genes
for
abiotic
stress
ONE
|
www.ploson
e.org
3
September
2012
|
Volume
7
|
Issue
of DNase I-treated RNA with the ReverTra AceHqPCR RT Kit (Toyobo, Japan) in a 20-ml reaction volume according to the
manufacturer’s supplied protocol. All procedures were performed essentially as previously reported [40].
qRT-PCR and data analyses
qRT-PCRs were performed in 96-well plates on a Stratagene MX3000P system (Agilent Technologies, Santa Clara, CA, USA) using ThunderbirdTM SYBRH qPCR Mix (Toyobo, Japan). Primer sets (0.4mM final concentrations for each primer) were
used in a final volume of 10ml per well. The thermal profile of the
qRT-PCRs was at 95uC for 1 min, 40 cycles at 95uC for 15 s and at 60uC for 1 min. Dissociation curves (Figure S1) were obtained using a thermal melting profile performed after the last PCR cycle: 95uC for 15 s followed by a constant increase in the temperature between 60uC and 95uC. Background-corrected raw fluorescence data were exported from the MX3000P system and analyzed in LinRegPCR software with a built-in baseline correction and amplification efficiency calculation [48,49]. Amplicon-based fluo-rescence thresholds were used to obtain the CT values. For confirmation of primer specificity, amplicon length was verified by electrophoresis of products through a 2% agarose gel (data not shown). Delta CT analyses were performed essentially as described by Silver et al. [50]. The mean of standard deviations of delta CTs was used to rank the performance of each candidate reference gene. The lower the values are, the more stable the expression of the candidate genes is (Table S1).
Results and Discussion
Screening of universal candidate reference genes for dehydration, high-salinity, cold and ABA treatments
The strategy conceived for determining effective reference genes in soybean began with a screening of the candidate genes whose expression were commonly stable across the major stressors,
including dehydration, salt and cold stresses, which are often encountered by soybean plants [1,3]. Gene expression in response to abiotic stress has been known to be regulated in ABA-dependent and/or ABA-inABA-dependent manner [39,51–53]; thus, we also included ABA treatment into our study. A qRT-PCR assay was designed to measure the expression stability between control and stress- or ABA-treated samples of thirteen candidate reference genes obtained from published literature related to qRT-PCR expression profiling in soybean (Table 1, Dataset S1, Figure S1). These candidate genes were chosen based on their functional homology to genes that appear to demonstrate high expression stability in other plant systems [44,45,54]. Additionally, candidate genes were chosen which have been previously shown to demonstrate high stability in soybean under biotic stress conditions [46]. The18Sribosomal RNA gene was initially included among candidate reference genes for testing but was later excluded due to its extremely high abundance. Template cDNA for the samples analyzed with 18Sprimers had to be diluted at least 1000-fold relative to all other candidate genes to avoid the signal saturation obtained at low CT values. This dilution introduces a random element of variability which can potentially alter the apparent expression levels of target genes normalized with18S.
To identify reference genes that can be widely used in gene expression analyses under various stresses, the data for all stress treatments were analyzed together for root and shoot tissues of young soybean seedlings by two methods: the delta CT and geNorm. These two types of tissues are preferably used for high-throughput gene expression profiling by qRT-PCR under abiotic stresses [39–41,55–58]. As shown in Table 2, data analysis using the delta CT method suggested that the five most stable genes in both root and shoot tissues under normal and stress conditions were 60s.Fbox.ELF1b.ABC.IDE. When the same datasets were analyzed using geNorm, a method used to determine gene expression stability (M) [59], four of the above five genes were also among the top five most stably expressed genes although the exact order was different (60s/ABC.IDE.Fbox.ELF1a) (Figure 1A).
In real situation, we often study the differential expression of genes in a specific tissue rather than among various tissues. Thus, we subsequently looked for reference genes that performed well in individual tissues (roots or shoots) under various stresses. Analysis of the data using the delta CT method indicated that the most stably expressed genes in the root and shoots tissues are not the same, although they are overlapping (Table 2). For example, we found thatELF1b.60s.ABC.Fbox.CYP2and60s.Fbox. ELF1-b.IDE.Act11constituted the top five most stable genes in the roots and shoots, respectively. By geNorm method, the top five most stable genes for roots and shoots are ABC/60s.ELF1b
.-CYP2.Fbox and Act11/Fbox.IDE.ABC.60s, respectively (Figures 1B and 1C). The gene expression stability (M) of the reference genes determined by geNorm was developed by Vandesompele et al. [59]. This method is based on the assumption that the expression ratio of two ideal reference genes remains constant in all samples and is unaffected by treatment conditions. Genes having the lowest M value are considered to be the most stable, while those with higher M value indicate less expression stability. The two methods of reference gene analysis have provided similar conclusions, thereby strengthening the legitimacy of the results obtained.
Evaluation of reference gene stability in soybean root and shoot tissues under dehydration stress
Since a reference gene which is the most stable in one stress may be highly variable under other stresses, thus we analyzed the data based on individual stresses to search for the most stable reference
Table 2.Cycle thresholds and average of standard deviations (STDEVP) of delta CT obtained from tissues under all stress combinations.
Mean CT STDEVP of CT Average of STDEVP ofDCT
Roots Shoots Roots Shoots Roots Shoots Roots & Shoots
60s 21.31 21.97 0.5507 0.8184 0.4274 0.5112 0.4492
ABC 23.64 24.38 0.5522 0.6079 0.4580 0.5851 0.5238
Act27 21.64 22.03 0.5793 1.0963 0.5325 0.6736 0.5837
Act11 19.11 19.70 0.7787 0.7892 0.5772 0.5761 0.5682
CDPK 25.79 26.35 0.8712 0.8752 0.7810 0.8356 0.8015
CYP2 17.63 17.68 0.5748 0.5359 0.5148 0.5897 0.5987
ELF1a 18.41 18.87 0.5853 0.7598 0.5210 0.5905 0.5541
ELF1b 20.67 21.86 0.5545 0.7702 0.4204 0.5462 0.5233
Fbox 21.09 21.55 0.5217 0.6606 0.4908 0.5115 0.4843
IDE 21.66 22.41 0.7632 0.6132 0.5284 0.5518 0.5333
SUBI2 25.30 26.65 1.1050 0.8995 0.9455 1.1124 1.0802
TUBa 20.12 20.34 0.6796 1.0552 0.8019 1.1125 0.9594
TUBb 20.60 21.16 0.6805 1.0289 0.5258 0.7495 0.6293
Data obtained for the top five genes are shown in bold letters, while those for the top two genes are in italic and bold letters.
doi:10.1371/journal.pone.0046487.t002
Soybean reference genes for abiotic stress studies
gene(s) for each stress treatment. Under dehydration stress, results obtained from delta CT analysis (Table 3) revealed the top five most stably expressed genes for roots and shoots as Fbox.
ABC.Act11.TUBb.Act27 and Fbox.60s.ELF1b.Act11.IDE, respectively. The top five genes that can perform best in both root and shoot tissues are Fbox.60s.IDE.Act11.ABC. We then compared the data with that obtained by geNorm. In the roots, the gene encoding Fbox, ranked first by delta CT method, was not among the top five genes identified by geNorm which areAct11/ Act27.ABC.TUBb.TUBa (Figure 2A). In the shoots, under dehydration stressFboxwas also ranked first by delta CT analysis; however, geNorm ranked 60s/ELF1b as the best reference pair while Fbox was noted as the third best reference gene only
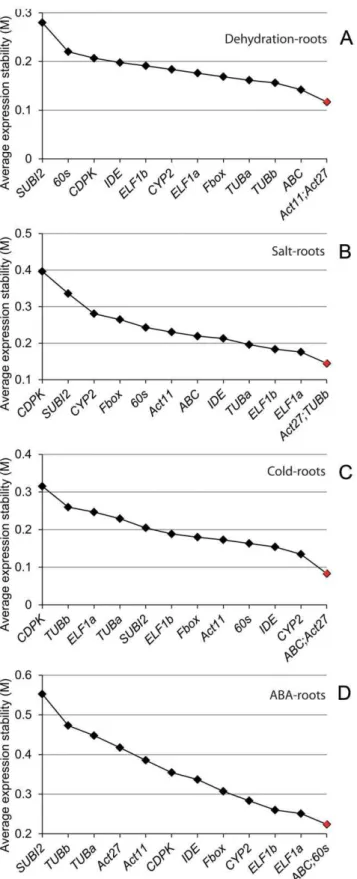
Figure 2. Expression stability and ranking for the candidate reference genes as determined by geNorm in the root tissues under individual stress or hormonal treatment.(A) Dehydration treatment. (B) Salt stress treatment. (C) Cold stress treatment. (D) ABA treatment.
doi:10.1371/journal.pone.0046487.g002 Figure 1. Expression stability of the candidate reference genes
in root and shoot tissues of soybean seedlings under various abiotic stress and hormonal treatments.Soybean seedlings were subjected to dehydration, cold stress, salt stress and ABA treatments, and geNorm was used to assess expression stability in (A) treated roots and shoots; (B) treated roots; (C) treated shoots.
(Figure 3A). The top five genes that perform best in both dehydrated roots and shoots determined by geNorm areABC/ Act11.Fbox.60s.ELF1a(Figure 4A).
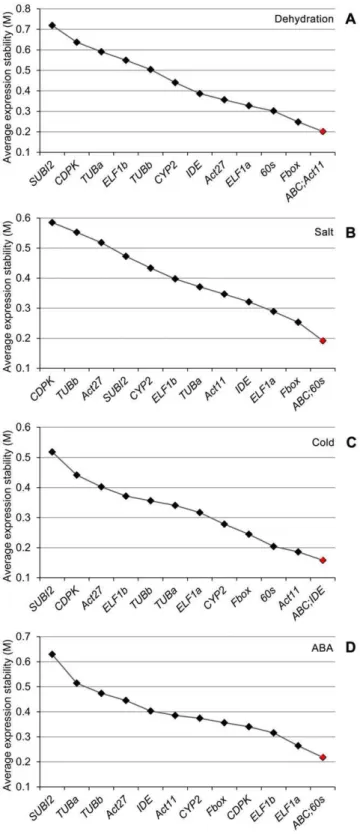
Figure 4. Expression stability and ranking for the candidate reference genes as determined by geNorm in both root and shoot tissues under individual stress or hormonal treatment. (A) Dehydration treatment. (B) Salt stress treatment. (C) Cold stress treatment. (D) ABA treatment.
doi:10.1371/journal.pone.0046487.g004 Figure 3. Expression stability and ranking for the candidate
reference genes as determined by geNorm in the shoot tissues under individual stress or hormonal treatment.(A) Dehydration treatment. (B) Salt stress treatment. (C) Cold stress treatment. (D) ABA treatment.
doi:10.1371/journal.pone.0046487.g003
Soybean reference genes for abiotic stress studies
Evaluation of reference gene stability in soybean root and shoot tissues under salt stress
Unlike dehydration stress under whichFboxwas identified as the best reference gene for roots, under salt stressFboxwas not among the top five genes for root tissues as determined by delta CT analysis (Table 3). Instead,ELF1bandIDEwere found to be the best reference gene pair among the top five genes (ELF1b. I-DE.ABC.TUBa.60s). In the salt stress-treated shoots, the top five genes areFbox.ELF1b.60s.CYP2.Act11. With the excep-tion of theCYP2, the remaining genes were also ranked among top five genes in dehydration-treated shoots (Table 3). Although, ELF1b and Fbox were ranked first in the roots and shoots, respectively, when the data for roots and shoots were combined and analyzed,60swas found to be the most stably expressed gene followed by Fbox (Table 3). When the data from the salt stress-treated roots were analyzed by geNorm, it turned out to be that the top three genes ranked by geNorm (Act27,TUBbandELF1a) were not among the top five genes short-listed by delta CT analysis (Figure 2B, Table 3). In shoots, geNorm analysis indicated that exceptELF1a, which was ranked first by geNorm but was out of the top five genes determined by delta CT analysis, the remaining top four genes,60s.Fbox.ELF1b.Act11were among the top five most stably expressed genes determined by delta CT analysis (Figure 3B, Table 3). The top two genes identified by delta CT method for both salt-treated roots and shoots (60s and Fbox, Table 3) were also among top three genes determined by geNorm (Figure 4B).
Evaluation of reference gene stability in soybean root and shoot tissues under cold stress
Soybean adaptive responses to cold stress have also attracted a great deal of attention [51,60,61]. Thus, we next searched for the best reference genes to be used for expression analysis under cold stress among the 13 selected candidate genes. Using delta CT analysis, the top five genes that are most stably expressed in the roots and shoots of soybean seedlings under cold stress were IDE.60s.Fbox.Act27.ABC and Fbox.Act27.60s. AB-C.ELF1b, respectively (Table 3). Four of the best performed
reference genes ranked by delta CT analysis in each tissue were also shown to be the most stable genes by geNorm. Specifically, geNorm analysis demonstrated thatABC/Act27.CYP2.IDE.60s and IDE/Fbox.Act27.ABC.60s are the top five best reference genes for roots and shoots, respectively, under cold stress (Figures 2C and 3C). Although the60s gene was not the most stably expressed gene in any given tissues; however, it was the top-ranked gene to be used as a reference gene for cold stress across root and shoot tissues. The top five best candidate reference genes common for both tissues in cold stress were identified by delta CT analysis and geNorm are60s.Fbox.IDE.ABC.ELF1b(Table 3) andABC/IDE.Act11.60s.Fbox(Figure 4C), respectively.
Evaluation of reference gene stability in soybean root and shoot tissues under ABA treatment
ABA has been established as a key hormone involved in the regulation of plant responses to various abiotic stresses, such as drought and high salinity. Under these stresses, endogenous ABA level is increased, leading to up-regulation of many stress-responsive genes in ABA-dependent manner [62]. Thus, ABA treatment is often included in expression studies together with other stress treatments to determine whether the change in gene expression in response to stresses is dependent or ABA-independent [39,51,52]. Hence, a good reference gene for expression studies of stress-responsive genes under abiotic stresses should also stably express under ABA treatment. This prompted us to rank the performance of the selected 13 candidate reference genes to obtain the most stably expressed genes in roots and shoots that had been subjected to exogenous ABA treatment. The five top-listed genes in the roots and shoots under ABA treatment as revealed by delta CT analysis were60s.ELF1b.ABC.ELF1a.
CYP2 and ELF1b.Fbox.ABC.Act11.CDPK, respectively (Table 3). Only two genes, namely the ABC and ELF1b, were overlapping in the lists of the top five most stably expressed genes in each tissue, suggesting that the most stable reference genes are not only stress/hormone-dependent but also tissue-dependent. When geNorm was use to analyze the expression stability, we found that all the top five genes listed for the roots (ABC/ 60s.ELF1a.ELF1b.CYP2) were also ranked as the top five by a
Table 3.Average of standard deviations of delta CT obtained from tissues under individual stress.
Dehydration Salt Cold ABA
Roots Shoots R & S Roots Shoots R & S Roots Shoots R & S Roots Shoots R &S
60s 0.2902 0.4857 0.5346 0.3015 0.3537 0.3579 0.2196 0.2579 0.2778 0.3653 0.3420 0.3996
ABC 0.2145 0.6269 0.6452 0.2896 0.4840 0.4180 0.2441 0.2647 0.3557 0.4050 0.3278 0.4318
Act27 0.2179 0.6418 0.7222 0.3128 0.7563 0.5739 0.2424 0.2564 0.4209 0.5245 0.5056 0.5560
Act11 0.2159 0.5537 0.6363 0.3823 0.4164 0.4384 0.2726 0.3457 0.3707 0.4838 0.3282 0.4563
CDPK 0.2437 0.9915 0.7685 0.6666 0.7199 0.6857 0.5454 0.5116 0.5909 0.5288 0.3292 0.4780
CYP2 0.2807 0.6573 0.8326 0.3622 0.3792 0.5192 0.2449 0.3092 0.3632 0.4226 0.3485 0.4756
ELF1a0.2362 0.6186 0.8439 0.3238 0.4713 0.4462 0.2968 0.3152 0.4136 0.4192 0.3944 0.4537
ELF1b0.2378 0.5209 0.6804 0.2656 0.3277 0.4703 0.2448 0.2706 0.3563 0.3987 0.2959 0.4073
Fbox 0.2026 0.4538 0.4943 0.3489 0.3268 0.3707 0.2404 0.2382 0.3120 0.4435 0.3221 0.4320
IDE 0.2439 0.5967 0.5913 0.2743 0.4947 0.4441 0.2180 0.2991 0.3497 0.4787 0.3714 0.5126
SUBI2 0.5441 1.2082 1.1174 0.5667 0.6558 0.6179 0.2898 0.3859 0.8414 0.9597 0.4756 1.1887
TUBa 0.2268 1.0299 0.8549 0.2998 0.5392 0.4750 0.2779 0.3671 0.3670 0.5854 0.3893 0.6987
TUBb 0.2176 0.8387 0.7954 0.3212 0.7498 0.5985 0.2936 0.3724 0.3851 0.5330 0.3625 0.5416
geNorm analysis although the order was different (Figure 2D, Table 3). As for the shoots, with the exception of the ABC, the other four top-listed genes determined by delta CT analysis were found among the top five genes as suggested by a geNorm analysis (Act11/Fbox.ELF1b.IDE.CDPK) (Figure 3D, Table 3). In addition, we also searched for reference genes that can be used to compare gene expression across tissues under ABA treatment. The data for roots and shoots were combined and analyzed using the delta CT approach. Results on Table 3 demonstrated that the top five most stably expressed genes in both roots and shoots of soybean seedlings were 60s.ELF1b.ABC.Fbox.ELF1a. The same five genes were also identified by geNorm, although the exact order was different (Figure 4D).
Validation of the usefulness of the reference genes identified from this study
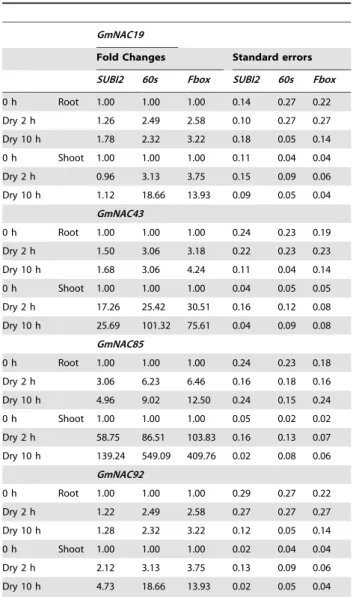
Next, to validate the performance of the reference genes identified in this study on known abiotic-stress inducible genes, we quantified the expression of four GmNAC genes, which were
reported to be up-regulated by dehydration [39,41], and normalized their expression levels using a representative least stable reference gene (SUBI2) and two representative good reference genes (Fbox and 60s) (Table 3). As shown in Table 4, with a fold-change threshold of 2.0, we would have consistently failed to detect the induced expression in the roots and shoots for GmNAC019and in the roots for GmNAC043 and GmNAC092, if SUBI2 -a least stable reference gene under dehydration stress -were used as a reference gene. However, the up-regulation of these genes was reliably detected when the expression levels were normalized with the most stable reference genes, such asFboxor 60s. When the induction level was high, as that of GmNAC85in both tissues or that of other GmNAC genes in the shoots, normalizing to bad reference genes, such asSUBI2, could still be able to detect the induction but was shown to underestimate the induction level by 3- to 4-fold (Table 4).
Conclusions
Upon exposure to stresses, soybean plants activate numerous signaling pathways to respond to the adverse environmental stimuli [1–3]. The first step toward adapting to stresses is to induce or repress the expression of various genes. To accurately understand the mechanisms regulating stress responses at transcriptional level and to identify the appropriate stress-responsive genes, stably expressed reference genes are needed if qRT-PCR is used for expression profiling. Before this study was conducted, there have been no comprehensive reports on the search for reference genes for soybean under various abiotic stress conditions, except a study which surveyed for reference genes for expression study under drought stress in soybean. However, this study used only four candidate genes, namely the Gmb-actin, GmGADPH,GmLectinandGmRNA18s, among which theGmb-actin and GmRNA18s were found to be the best reference genes for soybean under their experimental conditions [47]. This prompted us to choose 13 candidate reference genes from literature and ranked their performance as the best reference genes under various abiotic stress and hormonal treatments, including dehy-dration, salt, cold and ABA treatments. Because most of the recent studies showed the preferable use of root and shoot tissues of soybean seedlings for gene expression profiling under abiotic stresses using qRT-PCR [39–41,55–58]; we tested the expression stability of the 13 selected candidate genes in these tissues of 12-day old soybean plants. Our results revealed that there is no single reference gene that can be best for all conditions and/or both the tissues. Instead, we found that the best reference genes are tissue-and/or stress-dependent. In addition, although there is high agreement in overall among the top five genes ranked by either delta CT analysis or geNorm, the best reference genes inferred by one method may not be exactly the same ones as determined by another approach; a phenomenon which has also been observed earlier [63,64]. As geNorm has been known to rank co-regulated genes as the best reference genes, our conclusions were made based primarily on the result of delta CT analysis. The result obtained by geNorm is provided to readers as additional information source. The most stably expressed reference genes identified in this study were shown to help detect subtle differential rates of gene expression as well as avoid the underestimation of the induction/repression levels.
Taken together, using delta CT analysis with consideration of geNorm result, we suggest that the following gene pairs (summarized in Table 5) are suitable for use as reference genes in the respective tissues and under specific stress:
Table 4.Differential expression of known dehydration-inducible genes normalized with60S,FboxorSUBI2reference genes.
GmNAC19
Fold Changes Standard errors
SUBI2 60s Fbox SUBI2 60s Fbox
0 h Root 1.00 1.00 1.00 0.14 0.27 0.22
Dry 2 h 1.26 2.49 2.58 0.10 0.27 0.27
Dry 10 h 1.78 2.32 3.22 0.18 0.05 0.14
0 h Shoot 1.00 1.00 1.00 0.11 0.04 0.04
Dry 2 h 0.96 3.13 3.75 0.15 0.09 0.06
Dry 10 h 1.12 18.66 13.93 0.09 0.05 0.04
GmNAC43
0 h Root 1.00 1.00 1.00 0.24 0.23 0.19
Dry 2 h 1.50 3.06 3.18 0.22 0.23 0.23
Dry 10 h 1.68 3.06 4.24 0.11 0.04 0.14
0 h Shoot 1.00 1.00 1.00 0.04 0.05 0.05
Dry 2 h 17.26 25.42 30.51 0.16 0.12 0.08
Dry 10 h 25.69 101.32 75.61 0.04 0.09 0.08
GmNAC85
0 h Root 1.00 1.00 1.00 0.24 0.23 0.18
Dry 2 h 3.06 6.23 6.46 0.16 0.18 0.16
Dry 10 h 4.96 9.02 12.50 0.24 0.15 0.24
0 h Shoot 1.00 1.00 1.00 0.05 0.02 0.02
Dry 2 h 58.75 86.51 103.83 0.16 0.13 0.07
Dry 10 h 139.24 549.09 409.76 0.02 0.08 0.06
GmNAC92
0 h Root 1.00 1.00 1.00 0.29 0.27 0.22
Dry 2 h 1.22 2.49 2.58 0.27 0.27 0.27
Dry 10 h 1.28 2.32 3.22 0.12 0.05 0.14
0 h Shoot 1.00 1.00 1.00 0.02 0.04 0.04
Dry 2 h 2.12 3.13 3.75 0.13 0.09 0.06
Dry 10 h 4.73 18.66 13.93 0.02 0.05 0.04
doi:10.1371/journal.pone.0046487.t004
Soybean reference genes for abiotic stress studies
(i) For dehydration, Fbox/ABCshould be used for the roots and Fbox/60s for the shoots, respectively. The Fbox/60s gene pair is also the best for comparing expression between roots and shoots under normal and dehydration condi-tions.
(ii) For salt stress,ELF1b/IDEandFbox/ELF1bshould be used as reference genes for roots and shoots, respectively. For reference in both root and shoot tissues under salt stress, 60s/Fboxis the best gene pair.
(iii) For studying expression change by cold stress individually in the roots or the shootsIDE/60sandFbox/Act27are the best reference pairs, respectively. For analysis gene expression under cold stress across root and shoot tissues, 60s/Fboxshould be used.
(iv) To examine gene expression under ABA stress in roots, shoots or across these two tissues,60s/ELF1b,ELF1b/Fbox and60s/ELF1bare the best reference genes, respectively. (v) Based on the results of this study, when comparison of the expression profiles of a gene in response to various stresses is of interest, the ELF1b/60s, 60s/Fbox and 60s/Fbox reference gene pairs are recommended for roots, shoots and both tissues, respectively. When a single reference gene is required,60sshould be the best choice.
Supporting Information
Figure S1 Melting curves of the amplicons.The amplicons were produced by the primer pairs used to quantify the expression stability of the 13 candidate reference genes.
(TIF)
Table S1 Raw data of delta CT analysis of the expression stability of the candidate reference genes. (XLS)
Dataset S1 Primer locations on respective transcript. Primer sequences are in orange or in red boxes. Primer pairs with positions on two differently colored portions of the sequence are on two different exon or UTRs.
(PDF)
Author Contributions
Conceived and designed the experiments: DTL DLA L-SPT HTN. Performed the experiments: DTL YW CVH RN DLA BV SKG TNQ JJG-G L-SPT. Analyzed the data: DTL DLA L-SPT. Contributed reagents/materials/analysis tools: L-SPT HTN. Wrote the paper: DTL DLA BV L-SPT HTN. Revised the manuscript: DTL L-SPT.
References
1. Tran LS, Mochida K (2010) Functional genomics of soybean for improvement of productivity in adverse conditions. Funct Integr Genomics 10: 447–462. 2. Tran LS, Nguyen HT (2009) Future biotechnology of legumes. In: Emerich
WD, Krishnan H, editors. Nitrogen fixation in crop production. Madison, WI: ASA-CSA-SSSA. pp. 265–308.
3. Thao NP, Tran LS (2011) Potentials toward genetic engineering of drought-tolerant soybean. Crit Rev Biotechnol doi:10.3109/07388551.2011.643463. 4. Gutierrez-Gonzalez JJ, Guttikonda SK, Tran LS, Aldrich DL, Zhong R, et al.
(2010) Differential expression of isoflavone biosynthetic genes in soybean during water deficits. Plant Cell Physiol 51: 936–948.
5. Neelakandan AK, Nguyen HT, Kumar R, Tran LS, Guttikonda SK, et al. (2010) Molecular characterization and functional analysis of Glycine max sterol methyl transferase 2 genes involved in plant membrane sterol biosynthesis. Plant Mol Biol 74: 503–518.
6. Hadiarto T, Tran LS (2011) Progress studies of drought-responsive genes in rice. Plant Cell Rep 30: 297–310.
7. Manavalan LP, Guttikonda SK, Tran LS, Nguyen HT (2009) Physiological and molecular approaches to improve drought resistance in soybean. Plant Cell Physiol 50: 1260–1276.
8. Tran LS, Nakashima K, Shinozaki K, Yamaguchi-Shinozaki K (2007) Plant gene networks in osmotic stress response: from genes to regulatory networks. Methods Enzymol 428: 109–128.
9. Nakashima K, Ito Y, Yamaguchi-Shinozaki K (2009) Transcriptional regulatory networks in response to abiotic stresses in Arabidopsis and grasses. Plant Physiol 149: 88–95.
10. Jogaiah S, Ramsandra Govind S, Tran LS (2012) System biology-based approaches towards understanding drought tolerance in food crops. Crit Rev Biotechnol doi: 10.3109/07388551.2012.659174.
11. Tran LS, Nishiyama R, Yamaguchi-Shinozaki K, Shinozaki K (2010) Potential utilization of NAC transcription factors to enhance abiotic stress tolerance in plants by biotechnological approach. GM Crops 1: 32–39.
12. Valliyodan B, Nguyen HT (2006) Understanding regulatory networks and engineering for enhanced drought tolerance in plants. Curr Opin Plant Biol 9: 189–195.
13. Xin H, Qin F, Tran LS (2012) Transcription factors involved in environmental stress responses in plants. In: Ahmad P, Prasad MNV, editors. Environmental Adaptations and Stress Tolerance of Plants in the Era of Climate Change. New York: Springer. pp. 279–295.
14. Choudhary SP, Volkan Oral H, Bhardwaj R, Yu JQ, Tran LS (2012) Interaction of Brassinosteroids and Polyamines Enhances Copper Stress Tolerance in Raphanus Sativus. J Exp Bot doi: 10.1093/jxb/ers219. 15. Ma Y, Qin F, Tran LS (2012) Contribution of Genomics to Gene Discovery in
Plant Abiotic Stress Responses. Molecular Plant doi: 10.1093/mp/sss085. 16. Choudhary SP, Yu JQ, Yamaguchi-Shinozaki K, Shinozaki K, Tran LS (2012)
Benefits of brassinosteroid crosstalk. Trends Plant Sci. Available: http://dx.doi. org/10.1016/j.tplants.2012.05.012.
17. Ha S, Vankova R, Yamaguchi-Shinozaki K, Shinozaki K, Tran LS (2012) Cytokinins: metabolism and function in plant adaptation to environmental stresses. Trends Plant Sci 17: 172–179.
18. Le DT, Choi JD, Tran LS (2010) Amino acids conferring herbicide resistance in tobacco acetohydroxyacid synthase. GM Crops 1: 62–67.
19. Mochida K, Shinozaki K (2011) Advances in omics and bioinformatics tools for systems analyses of plant functions. Plant Cell Physiol 52: 2017–2038. 20. Alwine JC, Kemp DJ, Stark GR (1977) Method for detection of specific RNAs in
agarose gels by transfer to diazobenzyloxymethyl-paper and hybridization with DNA probes. Proc Natl Acad Sci U S A 74: 5350–5354.
21. Tran LS, Nakashima K, Sakuma Y, Simpson SD, Fujita Y, et al. (2004) Isolation and functional analysis of Arabidopsis stress-inducible NAC transcription factors that bind to a drought-responsive cis-element in the early responsive to dehydration stress 1 promoter. Plant Cell 16: 2481–2498.
22. Tran LS, Urao T, Qin F, Maruyama K, Kakimoto T, et al. (2007) Functional analysis of AHK1/ATHK1 and cytokinin receptor histidine kinases in response to abscisic acid, drought, and salt stress in Arabidopsis. Proc Natl Acad Sci U S A 104: 20623–20628.
23. Stolf-Moreira R, Lemos EGM, Carareto-Alves L, Marcondes J, Pereira SS, et al. (2011) Transcriptional Profiles of Roots of Different Soybean Genotypes Subjected to Drought Stress. Plant Molecular Biology Reporter 29: 19–34.
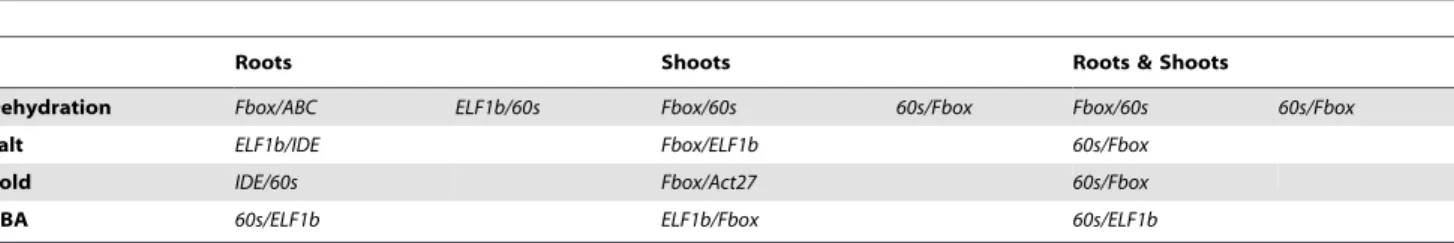
Table 5.Recommended reference genes for qRT-PCR of soybean tissues under various abiotic stresses.
Roots Shoots Roots & Shoots
Dehydration Fbox/ABC ELF1b/60s Fbox/60s 60s/Fbox Fbox/60s 60s/Fbox
Salt ELF1b/IDE Fbox/ELF1b 60s/Fbox
Cold IDE/60s Fbox/Act27 60s/Fbox
ABA 60s/ELF1b ELF1b/Fbox 60s/ELF1b
24. Seki M, Narusaka M, Ishida J, Nanjo T, Fujita M, et al. (2002) Monitoring the expression profiles of 7000 Arabidopsis genes under drought, cold and high-salinity stresses using a full-length cDNA microarray. Plant J 31: 279–292. 25. Kreps JA, Wu Y, Chang HS, Zhu T, Wang X, et al. (2002) Transcriptome
changes for Arabidopsis in response to salt, osmotic, and cold stress. Plant Physiol 130: 2129–2141.
26. Tran LS, Nakashima K, Sakuma Y, Osakabe Y, Qin F, et al. (2007) Co-expression of the stress-inducible zinc finger homeodomain ZFHD1 and NAC transcription factors enhances expression of the ERD1 gene in Arabidopsis. Plant J 49: 46–63.
27. Nishiyama R, Le DT, Watanabe Y, Matsui A, Tanaka M, et al. (2012) Transcriptome analyses of a salt-tolerant cytokinin-deficient mutant reveal differential regulation of salt stress response by cytokinin deficiency. PLoS One 7: e32124.
28. Qin F, Kodaira KS, Maruyama K, Mizoi J, Tran LS, et al. (2011) SPINDLY, a negative regulator of gibberellic acid signaling, is involved in the plant abiotic stress response. Plant Physiol 157: 1900–1913.
29. Kodaira KS, Qin F, Tran LS, Maruyama K, Kidokoro S, et al. (2011) Arabidopsis Cys2/His2 zinc-finger proteins AZF1 and AZF2 negatively regulate abscisic acid-repressive and auxin-inducible genes under abiotic stress condi-tions. Plant Physiol 157: 742–756.
30. Ballman KV (2008) Genetics and genomics: gene expression microarrays. Circulation 118: 1593–1597.
31. Tang T, Francois N, Glatigny A, Agier N, Mucchielli MH, et al. (2007) Expression ratio evaluation in two-colour microarray experiments is significantly improved by correcting image misalignment. Bioinformatics 23: 2686–2691. 32. To TK, Nakaminami K, Kim JM, Morosawa T, Ishida J, et al. (2011)
Arabidopsis HDA6 is required for freezing tolerance. Biochemical and Biophysical Research Communications 406: 414–419.
33. Matsui A, Ishida J, Morosawa T, Mochizuki Y, Kaminuma E, et al. (2008) Arabidopsis transcriptome analysis under drought, cold, high-salinity and ABA treatment conditions using a tiling array. Plant Cell Physiol 49: 1135–1149. 34. Matsui A, Ishida J, Morosawa T, Okamoto M, Kim JM, et al. (2010)
Arabidopsis tiling array analysis to identify the stress-responsive genes. Methods Mol Biol 639: 141–155.
35. Czechowski T, Bari RP, Stitt M, Scheible WR, Udvardi MK (2004) Real-time RT-PCR profiling of over 1400 Arabidopsis transcription factors: unprecedent-ed sensitivity reveals novel root- and shoot-specific genes. Plant Journal 38: 366– 379.
36. Nolan T, Hands RE, Bustin SA (2006) Quantification of mRNA using real-time RT-PCR. Nature Protocols 1: 1559–1582.
37. Ginzinger DG (2002) Gene quantification using real-time quantitative PCR: An emerging technology hits the mainstream. Experimental Hematology 30: 503– 512.
38. Udvardi MK, Czechowski T, Scheible WR (2008) Eleven golden rules of quantitative RT-PCR. Plant Cell 20: 1736–1737.
39. Tran LS, Quach TN, Guttikonda SK, Aldrich DL, Kumar R, et al. (2009) Molecular characterization of stress-inducible GmNAC genes in soybean. Mol Genet Genomics 281: 647–664.
40. Le DT, Nishiyama R, Watanabe Y, Mochida K, Yamaguchi-Shinozaki K, et al. (2011) Genome-wide expression profiling of soybean two-component system genes in soybean root and shoot tissues under dehydration stress. DNA Res 18: 17–29.
41. Le DT, Nishiyama R, Watanabe Y, Mochida K, Yamaguchi-Shinozaki K, et al. (2011) Genome-wide survey and expression analysis of the plant-specific NAC transcription factor family in soybean during development and dehydration stress. DNA Res 18: 263–276.
42. Pereira SS, Guimaraes FC, Carvalho JF, Stolf-Moreira R, Oliveira MC, et al. (2011) Transcription factors expressed in soybean roots under drought stress. Genet Mol Res 10: doi: 10.4238/2011.October.4221.4235.
43. Gutierrez L, Mauriat M, Guenin S, Pelloux J, Lefebvre JF, et al. (2008) The lack of a systematic validation of reference genes: a serious pitfall undervalued in reverse transcription-polymerase chain reaction (RT-PCR) analysis in plants. Plant Biotechnol J 6: 609–618.
44. Jian B, Liu B, Bi Y, Hou W, Wu C, et al. (2008) Validation of internal control for gene expression study in soybean by quantitative real-time PCR. BMC Mol Biol 9: 59.
45. Hu R, Fan C, Li H, Zhang Q, Fu YF (2009) Evaluation of putative reference genes for gene expression normalization in soybean by quantitative real-time RT-PCR. BMC Mol Biol 10: 93.
46. Libault M, Thibivilliers S, Bilgin DD, Radwan O, Benitez M, et al. (2008) Identification of four soybean reference genes for gene expression normalization. The Plant Genome 1: 44–54.
47. Stolf-Moreira R, Lemos EGM, Abdelnoor RV, Beneventi MA, Rolla AAP, et al. (2011) Identification of reference genes for expression analysis by real-time quantitative PCR in drought-stressed soybean. Pesquisa Agropecua´ria Brasileira 46: 58–65.
48. Ramakers C, Ruijter JM, Deprez RH, Moorman AF (2003) Assumption-free analysis of quantitative real-time polymerase chain reaction (PCR) data. Neurosci Lett 339: 62–66.
49. Ruijter JM, Ramakers C, Hoogaars WM, Karlen Y, Bakker O, et al. (2009) Amplification efficiency: linking baseline and bias in the analysis of quantitative PCR data. Nucleic Acids Res 37: e45.
50. Silver N, Best S, Jiang J, Thein SL (2006) Selection of housekeeping genes for gene expression studies in human reticulocytes using real-time PCR. BMC Mol Biol 7: 33.
51. Gao SQ, Chen M, Xu ZS, Zhao CP, Li L, et al. (2011) The soybean GmbZIP1 transcription factor enhances multiple abiotic stress tolerances in transgenic plants. Plant Mol Biol 75: 537–553.
52. Nishiyama R, Watanabe Y, Fujita Y, Le DT, Kojima M, et al. (2011) Analysis of cytokinin mutants and regulation of cytokinin metabolic genes reveals important regulatory roles of cytokinins in drought, salt and abscisic acid responses, and abscisic acid biosynthesis. Plant Cell 23: 2169–2183.
53. Aslam M, Grover A, Sinha VB, Fakher B, Pande V, et al. (2012) Isolation and characterization of cold responsive NAC gene from Lepidium latifolium. Mol Biol Rep DOI: 10.1007/s11033-012-1828-0.
54. Irsigler AS, Costa MD, Zhang P, Reis PA, Dewey RE, et al. (2007) Expression profiling on soybean leaves reveals integration of ER- and osmotic-stress pathways. BMC Genomics 8: 431.
55. Stolf-Moreira R, Medri ME, Neumaier N, Lemos NG, Brogin RL, et al. (2010) Cloning and quantitative expression analysis of drought-induced genes in soybean. Genet Mol Res 9: 858–867.
56. Nouri MZ, Hiraga S, Yanagawa Y, Sunohara Y, Matsumoto H, et al. (2012) Characterization of calnexin in soybean roots and hypocotyls under osmotic stress. Phytochemistry 74: 20–29.
57. Xie ZM, Zou HF, Lei G, Wei W, Zhou QY, et al. (2009) Soybean Trihelix transcription factors GmGT-2A and GmGT-2B improve plant tolerance to abiotic stresses in transgenic Arabidopsis. PLoS One 4: e6898.
58. Wei W, Huang J, Hao YJ, Zou HF, Wang HW, et al. (2009) Soybean GmPHD-type transcription regulators improve stress tolerance in transgenic Arabidopsis plants. PLoS One 4: e7209.
59. Vandesompele J, De Preter K, Pattyn F, Poppe B, Van Roy N, et al. (2002) Accurate normalization of real-time quantitative RT-PCR data by geometric averaging of multiple internal control genes. Genome Biol 3: RESEARCH0034. 60. Toda K, Takahashi R, Iwashina T, Hajika M (2011) Difference in chilling-induced flavonoid profiles, antioxidant activity and chilling tolerance between soybean near-isogenic lines for the pubescence color gene. J Plant Res 124: 173– 182.
61. Maruyama K, Todaka D, Mizoi J, Yoshida T, Kidokoro S, et al. (2012) Identification of cis-acting promoter elements in cold- and dehydration-induced transcriptional pathways in Arabidopsis, rice, and soybean. DNA Res 19: 37–49. 62. Fujita Y, Fujita M, Shinozaki K, Yamaguchi-Shinozaki K (2011) ABA-mediated transcriptional regulation in response to osmotic stress in plants. J Plant Res 124: 509–525.
63. Kortner TM, Valen EC, Kortner H, Marjara IS, Krogdahl A, et al. (2011) Candidate reference genes for quantitative real-time PCR (qPCR) assays during development of a diet-related enteropathy in Atlantic salmon (Salmo salar L.) and the potential pitfalls of uncritical use of normalization software tools. Aquaculture 318: 355–363.
64. Mehdi Khanlou K, Van Bockstaele E (2012) A critique of widely used normalization software tools and an alternative method to identify reliable reference genes in red clover (Trifolium pratense L.). Planta doi: 10.1007/ s00425-012-1682-2.
Soybean reference genes for abiotic stress studies