Evaluation and Selection of Candidate
Reference Genes for Normalization of
Quantitative RT-PCR in
Withania somnifera
(L.) Dunal
Varinder Singh1, Sunil C. Kaul2, Renu Wadhwa2, Pratap Kumar Pati1*
1Department of Biotechnology, Guru Nanak Dev University, Amritsar-143005, Punjab, India,2Cell Proliferation Research Group and DBT-AIST International Laboratory for Advanced Biomedicine, National Institute of Advanced Industrial Science and Technology, AIST, Tsukuba, Ibaraki, 305 8562, Japan
Abstract
Quantitative real-time PCR (qRT-PCR) is now globally used for accurate analysis of tran-scripts levels in plants. For reliable quantification of trantran-scripts, identification of the best reference genes is a prerequisite in qRT-PCR analysis. Recently,Withania somniferahas at-tracted lot of attention due to its immense therapeutic potential. At present, biotechnological intervention for the improvement of this plant is being seriously pursued. In this background, it is important to have comprehensive studies on finding suitable reference genes for this high valued medicinal plant. In the present study, 11 candidate genes were evaluated for their ex-pression stability under biotic (fungal disease), abiotic (wounding, salt, drought, heat and cold) stresses, in different plant tissues and in response to various plant growth regulators (methyl jasmonate, salicylic acid, abscisic acid). The data as analyzed by various software packages (geNorm, NormFinder, Bestkeeper andΔCt method) suggested that cyclophilin (CYP) is a most stable gene under wounding, heat, methyl jasmonate, different tissues and all stress conditions.T-SANDwas found to be a best reference gene for salt and salicylic acid (SA) treated samples, while 26S ribosomal RNA (26S), ubiquitin (UBQ) and beta-tubulin (TUB) were the most stably expressed genes under drought, biotic and cold treatment respectively. For abscisic acid (ABA) treated samples18S-rRNAwas found to stably expressed gene. Fi-nally, the relative expression level of the three genes involved in the withanolide biosynthetic pathway was detected to validate the selection of reliable reference genes. The present work will significantly contribute to gene analysis studies inW.somniferaand facilitate in improving the quality of gene expression data in this plant as well as and other related plant species.
Introduction
Withania somniferais an important medicinal plant of the family Solanaceae and is extensively used in Indian, Unani and African systems of traditional medicine [1]. It has strong
OPEN ACCESS
Citation:Singh V, Kaul SC, Wadhwa R, Pati PK (2015) Evaluation and Selection of Candidate Reference Genes for Normalization of Quantitative RT-PCR inWithania somnifera(L.) Dunal. PLoS ONE 10(3): e0118860. doi:10.1371/journal.pone.0118860
Academic Editor:Manuel Reigosa, University of Vigo, SPAIN
Received:September 9, 2014
Accepted:January 7, 2015
Published:March 13, 2015
Copyright:© 2015 Singh et al. This is an open access article distributed under the terms of the Creative Commons Attribution License, which permits unrestricted use, distribution, and reproduction in any medium, provided the original author and source are credited.
Data Availability Statement:All relevant data are within the paper and its Supporting Information files.
Funding:Authors thanks the Department of Biotechnology, Government of India, Council of Scientific and Industrial Research (CSIR), New Delhi and University Grants Commission (UGC), New Delhi, India. The funders had no role in study design, data collection and analysis, decision to publish, or preparation of the manuscript.
immunomodulatory, anti-stress, cardioprotective, anti-aging, antioxidant, anti-inflammatory, anti-tumour activities and chemo preventive properties [2–6] that have been attributed to its wide secondary metabolites including withanolides, glycowithanolides, alkaloids, flavanol gly-cosides, sterols and phenols [7–10]. Withaferin A and withanone, in particular, have attracted a lot attention due to their anti-cancer potentials [11–15] and hence identification, cloning and characterization of genes involved in withanolide biosynthesis inW.somniferahas become a focus of study in several laboratories [16–19]. Studies on dynamics of gene expression involved in withanolide biosynthesis with respect to development, growth conditions, and stress hold great potential as it provides necessary inputs on the levels of target metabolite synthesis and accumulation for medicinal use.
Various techniques like Northern blotting, RNase protection assay, and semiquantitative re-verse-transcription PCR are used for gene expression analysis. Quantitative real-time reverse transcription polymerase chain reaction (qRT-PCR) is preferred due to its higher sensitivity, specificity and broad quantification range. However, in spite of these precisions and robusti-city, it is often limited by the lack of reliable reference genes for normalization and authenticity of the experimental outcomes. Therefore, identification of stable reference genes for accurate normalization of qRT-PCR results is an important aspect of these studies [20]. In most of the cases, housekeeping genes that are constitutively expressed are selected as reference genes. However, several studies have reported that the expression stability of commonly used house-keeping genes is inappropriate for normalization and exhibit expression variability under dif-ferent experimental conditions [21–22]. Thus, it is necessary to first validate the expression stability of control genes that are expressed constitutively across experimental treatments prior to their use for normalization of data.
InW.somnifera, several studies have reported qRT-PCR analysis of gene expression [16,23, 24]. However, to the best of our knowledge, a systematic study on endogenous control genes expression under different stress conditions has not been accomplished yet. In the present study, a comprehensive gene expression analysis involving 11 genes including 18S ribosomal RNA (18S-rRNA), 26S ribosomal RNA,(26S), Actin(ACT), cyclophylin(CYP), elongation fac-tor-1(EF-1), glyceral-dehyde-3-phosphate dehydrogenase (GAPDH), ribosomal protein L2 (RPL2), Sand family protein(SAND), alpha-tubulin (TUA), beta-tubulin (TUB) and ubiquitin (UBQ) was evaluated in different plant organs (flower, leaf, stem, root and whole plant), biotic (fungal disease), abiotic (salt, cold, heat, drought and wounding) and plant growth regulators (methyl jasmonate (MJ), salicylic acid (SA) and abscisic acid (ABA) stress treatments. Three withanolides biosynthetic pathway genes [3-Hydroxy 3-methylglutaryl coenzyme A reductase (HMGR), Cycloartenol synthase (CAS) and Cytochrome 450 Reductase (P450)] were used to validate these results. Top two reference genes singly and in combination were used to test the reliability of selected reference genes. Several algorithms like geNorm, NormFinder and Best-keeper were used to validate the expression stability of different genes under various
experimental conditions.
Material and Methods
Plant materials
W.somniferaseeds were germinated in greenhouse (22–25°C 14h light/10h dark) in earthen pots containing a mixture of soil: sand: vermicompost (1: 1: 8). After 30 days, the germinated plants were transferred to individual pots. Leaves of four months old plant were used for exper-imentation. To study the tissue specific expression of the 11 candidate genes, different plant or-gans (Flower, leaves, stem, roots and whole plant) were collected and frozen in liquid nitrogen and stored at -80°C for further experimentation.
Reference Genes for Quantitative RT-PCR inWithania somnifera
Abiotic stress treatments
For heat and cold treatment plants were incubated at 42°C±1 and 4°C±1 respectively under dim light. Control plants were kept at 25°C. For wounding treatment, leaf surface was scraped with sterile forceps. For salt treatment, plants pots were saturated with 200 mM NaCl solution followed by leaf sampling. For drought treatment of the plants, water was with hold for 7 days after which samples were collected. For non-stress treatment all the plants were watered at reg-ular intervals. Samples were collected as fully expanded leaves after the heat, cold, salt, wound-ing and drought stress treatments at 0, 6, 12, 24 and 48 h interval of time. All samples were immediately frozen in liquid nitrogen after harvest and stored at -80°C prior to RNA isolation. Two sets of plants were used for different stress treatment (biological replicates).
Hormone treatments
For hormone treatments, four months old plants were sprayed with methyl jasmonate, salicylic acid, abscisic acid (100μM each). Control plants were sprayed with distilled water. Samples were collected at 0, 6, 12, 24 and 48 h intervals, immediately frozen in liquid nitrogen and stored at -80°C for further analysis.
Biotic stress treatment
InW.somnifera, leaf spot caused byAlternaria alternatais one of the most prevalent disease [25]. The isolated pathogen from leaf spot infected plant was used to induce biotic stress.A. alternataspore suspension of 6×10⁵spores/ml with 0.01% Twin20 (v/v) was prepared from 7–10 days old fungal cultures in sterile distilled water, and concentration of spores was adjusted by using a haemocytometer. This spore suspension was sprayed on leaves of healthy plant and pots were kept in moist chamber (95±5% Relative Humidity) and maintained at 25°C for 24h required for optimal infection (72 hours). Plants treated with sterile distilled water with 0.01% Twin20 (v/v) in the same manner were used as control. Fully expanded leaves showing disease symptoms (brown spots) in 1/3rdor 1/5thof the leaf area were harvested (immediately frozen in liquid nitrogen and stored at -80°C).
RNA Extraction and cDNA Synthesis
The sampled plant leaves were grounded to fine powder with mortar and pestle in liquid nitro-gen, and 100 mg of the material was used for RNA isolation. Total RNA was extracted using Trizol reagent (Invitrogen,http://www.invitrogen.com), as per the manufacturer’s guidelines. Isolated RNA was treated with RNase free DNase (Sigma-Aldrich, USA) to remove genomic DNA contamination. Purity and concentration of RNA samples was measured using Nano-Drop (Thermo Scientific) and integrity was checked on agarose gel electrophoresis. RNA sam-ples with 260/280 ratio between 1.9 and 2.1 were used for subsequent experimentation. First strand cDNA synthesized using iScript cDNA synthesis kit (BioRad) according to manufactur-er’s instructions in a total volume of 20μl containing 2μg total RNA. RNA extraction and cDNA synthesis from all samples were performed for two biological replicates. The cDNA so-lution was 10 times diluted with nuclease-free water and aliquots were stored at -20°C till qRT-PCR.
Primer design and quantitative real-time PCR assays
sequences used in the qRT-PCR analyses are presented inTable 1. The primers were further validated for unique amplicon using Primer-BLAST (http://www.ncbi.nlm.nih.gov/tools/ primer-blast/). Standard RT-PCR was performed for all the primer pairs and a single amplifica-tion product of the expected size for each gene was obtained by electrophoresis on a 2% agarose gel. Primer amplification efficiency was determined from standard curve generated by serial di-lution of cDNA (10 fold each) for each gene in triplicate. Correlation coefficients (R2values) and amplification efficiencies (E) for each primer pairs were calculated from slope of regression line by plotting mean Cq values against the log cDNA dilution factor in Microsoft Excel using equation E = (10(1/-slope−1) X 100. Real-time amplification reactions were performed in 96 well
plates using SYBR Green detection chemistry and run in triplicate on 96-wells plates with the StepOne Plus Real-time PCR machine (Applied Biosystems). Reactions were prepared in a total volume of 20μl containing: 1μl of 10 fold diluted template, 0.5μl of each amplification primer (1μM), 10μl of 2X Fast SYBR Green (Applied Biosystems) and final volume of 20μL with sterile nuclease free water. Non-template controls (NTC) were also included for each primer pair. The cycling conditions were set as default: initial denaturation step of 95°C for 20 sec to activate the Taq DNA polymerase, followed by 40 cycles of denaturation at 95°C for 3s, annealing at 60°C for 30s. The melting curve was generated by heating the amplicon from 60 to 90°C. Baseline and threshold cycles (Ct) were automatically determined using the Ste-pOne Plus Software version 2.3 (Applied Biosystems). All the experiments were done ac-cording to MIQE (Minimum Information for Publication of Quantitative Real-Time PCR Experiments) guidelines [26].
Statistical analysis of gene expression stability
To analyze the expression variation of the ten candidate reference genes, three publicly avail-able software tools, i.e., geNorm version 3.5 [27], NormFinder version 0.953 [28], BestKeeper [29] and ComparativeΔCt method [30] were used. Relative expression of mean Cq values of 6 replicates (2 biological and 3 technical) was calculated by 2-ΔΔcqformula [31]. To find relative expressionΔCt is calculated by subtracting lowest Cq value from other Cq values for each sam-ple and imported into geNorm and NormFinder softwares for stability analysis. For BestKeeper andΔCt method mean Cq values were used as input.
Validation of reference genes
For the validation of the selected reference genes for normalization of expression, we examined the effect of salicylic acid on the expression level of three key genes of withanolide biosynthetic pathway such as 3-Hydroxy 3-methylglutaryl coenzyme A reductase (HMGR), Cycloartenol synthase (CAS) and Cytochrome 450 Reductase (P450). The information regarding genes and primers are listed inS1 Table. We selectedT-SANDandUBQalone and in combination as the reference genes and as combination their geometric mean was used for the expression studies. Further, to analyze the influence on gene expression by selection of inappropriate, we also se-lected least recommendedGAPDHgene.T-SANDandUBQwere found to be most stable genes whileGAPDHwas least stable according to comprehensive ranking for SA treated sam-ples. The expression levels were measured using 2-ΔΔcqmethod.
Results
RNA integrity and expression profiling of candidate reference genes
Total RNA extracted from leaf samples was evaluated for quality and integrity. RNA integrity was checked on agarose gel electrophoresis (S1 Fig.). Real-time qRT-PCR was conducted withReference Genes for Quantitative RT-PCR inWithania somnifera
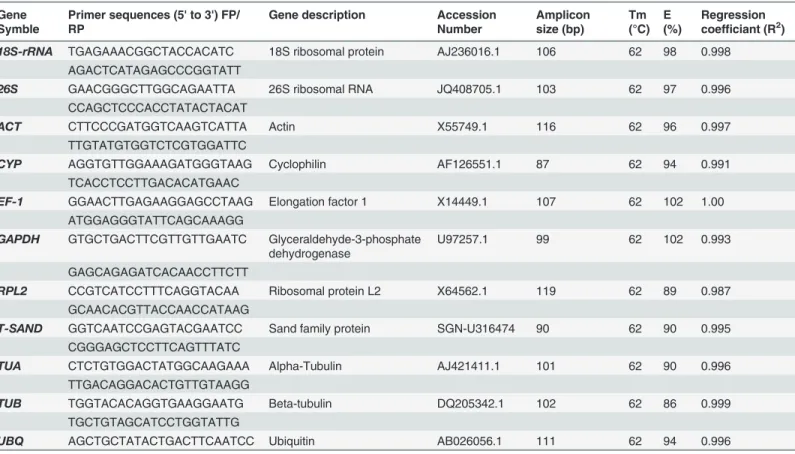
11 candidate reference genes; 18S ribosomal RNA(18S-rRNA), 26S ribosomal RNA(26S), Actin(ACT), cyclophylin(CYP), elongation factor-1(EF-1), glyceral-dehy3-phosphate de-hydrogenase(GAPDH), ribosomal protein L2(RPL2), Sand family protein(SAND), alpha-tu-bulin(TUA), beta-tubulin(TUB)and ubiquitin(UBQ). The specificity of the designed primer pairs was assessed by a confirmatory PCR and 2% agarose gel electrophoresis that revealed ex-pected single bands of desired lengths (S2 Fig.). Further, the PCR amplify fragments were se-quenced to validate specificity of gene primers. Furthermore, specificity was also confirmed from single peak in dissociation curve and without peak in no template control (NTC) which revealed the absence of any genomic DNA (S3 Fig.). PCR efficiency (E) and correlation coeffi-cient R2was estimated from standard curve showed range between 86–102% and 0.991–1.00, respectively (Table 1). The Cq values of the raw expression data across all samples are shown inFig. 1, which varied from 7.44 to 36.48 and mostly lying between 19–23 range. Among all tested reference genes,18S-rRNAshowed the highest abundance (lowest Cq value) with a mean of 10.28 followed byEF-1(21.11) andTUB(21.20),CYP(22.06),TUA(22.66),UBQ (23.59),26S(28.48),GAPDH(29.19).RPL2,T-SANDandACTshowed the least transcript abundance with a mean Cq of 33.65, 31.83 and 31.79, respectively (Fig. 1).UBQ,RPL2, 18S-rRNAandCYPshowed the lowest gene expression variation (below 4 cycles) whileTUA,TUB and26Shad highest expression variation (above 7 cycles). Transcript quantities are shown for each treatment as ratios relative to the sum of the all transcript populations. Variations in the relative quantities of the transcripts with different treatments are shown inFig. 2. Such type Table 1. Details of Reference genes and their primer sequences for each of the 11 evaluated genes.
Gene Symble
Primer sequences (5' to 3') FP/ RP
Gene description Accession
Number
Amplicon size (bp)
Tm (°C)
E (%)
Regression coefficiant (R2)
18S-rRNA TGAGAAACGGCTACCACATC 18S ribosomal protein AJ236016.1 106 62 98 0.998 AGACTCATAGAGCCCGGTATT
26S GAACGGGCTTGGCAGAATTA 26S ribosomal RNA JQ408705.1 103 62 97 0.996
CCAGCTCCCACCTATACTACAT
ACT CTTCCCGATGGTCAAGTCATTA Actin X55749.1 116 62 96 0.997
TTGTATGTGGTCTCGTGGATTC
CYP AGGTGTTGGAAAGATGGGTAAG Cyclophilin AF126551.1 87 62 94 0.991
TCACCTCCTTGACACATGAAC
EF-1 GGAACTTGAGAAGGAGCCTAAG Elongation factor 1 X14449.1 107 62 102 1.00
ATGGAGGGTATTCAGCAAAGG
GAPDH GTGCTGACTTCGTTGTTGAATC Glyceraldehyde-3-phosphate dehydrogenase
U97257.1 99 62 102 0.993
GAGCAGAGATCACAACCTTCTT
RPL2 CCGTCATCCTTTCAGGTACAA Ribosomal protein L2 X64562.1 119 62 89 0.987
GCAACACGTTACCAACCATAAG
T-SAND GGTCAATCCGAGTACGAATCC Sand family protein SGN-U316474 90 62 90 0.995 CGGGAGCTCCTTCAGTTTATC
TUA CTCTGTGGACTATGGCAAGAAA Alpha-Tubulin AJ421411.1 101 62 90 0.996
TTGACAGGACACTGTTGTAAGG
TUB TGGTACACAGGTGAAGGAATG Beta-tubulin DQ205342.1 102 62 86 0.999
TGCTGTAGCATCCTGGTATTG
UBQ AGCTGCTATACTGACTTCAATCC Ubiquitin AB026056.1 111 62 94 0.996
Notes: Tm = Annealing temperature, E = PCR efficiency.
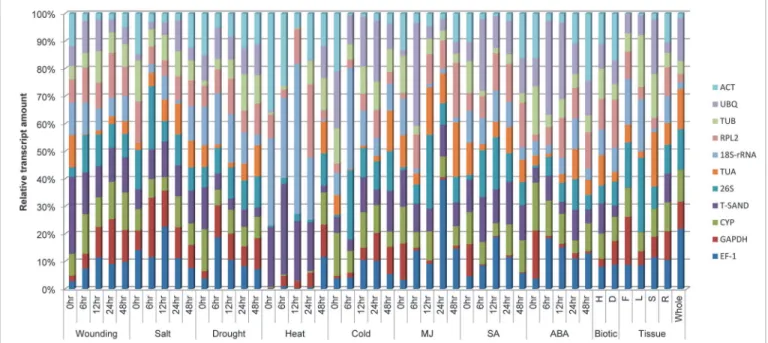
variation in the expression level reflects that there is lack of consistency in their expression pat-tern under experimental stress responses. For example18S-rRNAmRNA represents approxi-mately 10% of the total mRNA population in wounding treated samples but more than 40% in heat treatment. We found that the amount of mRNA transcript of all genes varied in all treat-ment. The transcript level ofCYPremained relatively constant in wounding, different plant or-gans and biotic treatment. Similarly transcript level ofT-SANDremained constant for salt and salicylic acid treatment and those ofRPL2were also remained constant for drought treated samples. Relative transcript level ofT-SANDvaried in all samples but maximum level was ob-served in heat treatment. From these results it can be concluded that expression level of most of the genes is not constant, it varies with different treatments. So there is need to analyze the expression stability of each gene.
Expression stability analysis
GeNorm analysis. The expression stability of candidate reference genes under different stress conditions was evaluated by using different approaches. Relative quantities of all samples were exported to geNorm (version 3.5) to analyze gene expression stability. Stability analysis by geN-orm is based on the M value, which is calculated by stepwise exclusion of the unstable genes followed by recalculation of M values [27]. M value less than the threshold value of 1.5 has been recommended by Vandesompele et al [27]. In our analysis only 3 genes showed M value Fig 1. Distribution overview of expression levels (Ct) of the different genes.Boxplot representation of raw Cq values obtained from amplification curves. The box indicates the 25th and 75th percentiles. Whiskers represent the maximum and minimum values, the thin line within the box marks the median, mean (thick dot) and outliers (Δ).
doi:10.1371/journal.pone.0118860.g001
Reference Genes for Quantitative RT-PCR inWithania somnifera
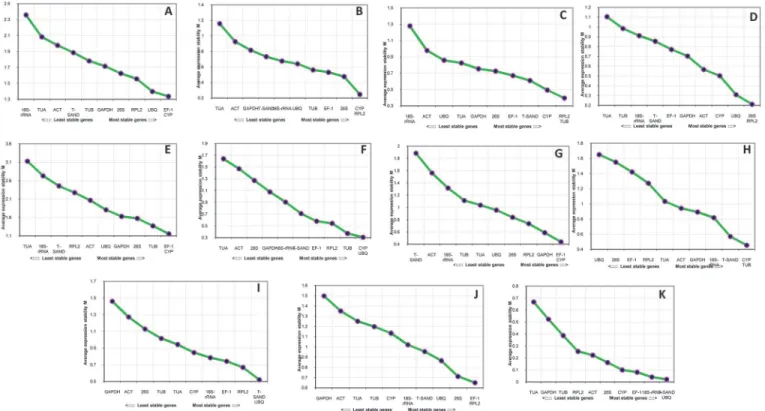
under the recommended value of 1.5 and rest of the five genes were above this value. It was observed that the stability of the genes varied according with different treatments and most of them showed inconsistently under all experimental conditions. Starting from the two most stable genes on the right (lowest M value), the genes are ranked according to decreasing ex-pression stability, ending with the most unstable genes on the left with highest M value. The most stable reference genes were not identical in all individual stress treated samples.TUBand RPL2(0.39) seems to be the most stable genes in salt treated samples, meanwhileRPL2and 26S(0.21) in drought treatment, andCYPandEF-1(1.15) in heat treated samples. Similarly, among other 11 genesCYPandUBQwere found to be most stable genes with M value of 0.30 for wounding and cold treatment.CYP,TUB(0.45) for MJ samples andT-SAND,UBQ(0.52) for SA treated samples showed lowest M values, thus were most stable genes. For ABA treat-mentRPL2andEF-1(0.64) exhibited stable expression as compare to other genes. Under biotic stressUBQandT-SANDgenes were on the top with lowest M value of 0.021. For all combined treatments, different tissues and heat treatmentCYPandEF-1genes were found to be most sta-ble (Fig. 3). Rest of the genes were found to be unstasta-ble with higher M values than cut off value of 1.5. Among all the reference genes examined18S-rRNAandTUAwere found to be the least stable with highest M value.
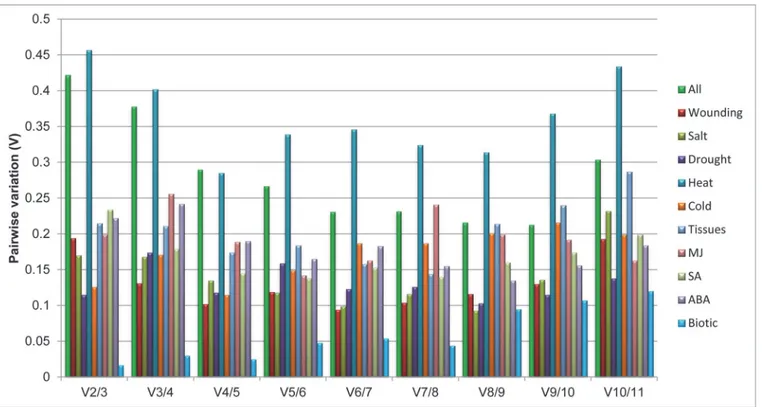
To find out the optimal number of reference genes in each experimental condition, geNorm also calculate pairwise variation (V). Vandesompele and coworkers [27] usually recommends 0.15 as a cutoff value to determine the optimal number of reference genes. The inclusion of ad-ditional gene if V value is below this cutoff value is not considered. However, 0.15 is not an ab-solute cutoff value but rather an ideal value depending on the amount of genes and type of samples tested [32,33]. Pairwise variation analysis showed that the optimal number of refer-ence genes may be different for distinct stress samples. Analysis of the pairwise variation in cold, drought and biotic treatments revealed that the Vn+1 value is less than cutoff value of 0.15, indicating that only two reference genes would be sufficient for normalizing gene Fig 2. Distribution of transcript populations of 11 selected genes under different stress treatments.In each treatment, the transcript amount of each gene is shown as a ratio relative to the sum of the 11 transcript populations. The samples were collected at 0hr, 6hr, 12hr, 24hr and 48hr interval of time after each treatment. Different treatments were heat, cold, drought, wounding, salt, MJ, SA, ABA, biotic and tissue (Flower, leaf, stem root and whole plant).
expression in these stress treatment (Fig. 4). For wounding treatment pairwise variation at the V2/3 value was 0.194, which is above the threshold of 0.15, and with the addition of next gene it drops down to stable value of 0.131, indicating that the proper normalization require at least three reference genes. Therefore,CYP,RPL2, and26Scan be used as reference genes to normal-ize gene expression data in wounding treated samples. With heat treated samples all genes pair-wise variation or V number always remained above cutoff value of 0.15. On the other hand, four genes for SA and five genes for the MJ treated samples are required for the normalization. Among different tissue subset addition of seventh gene lower the V value below cutoff. Similar-ly addition ofTUB(eighth gene) lower the V value in case of ABA treated samples. For all the samples taken together for analysis, it was observed that there was not a significant difference in the V numbers, but the instability was increased with the addition ofTUA(V9/10) and 18S-rRNA(V10/11).
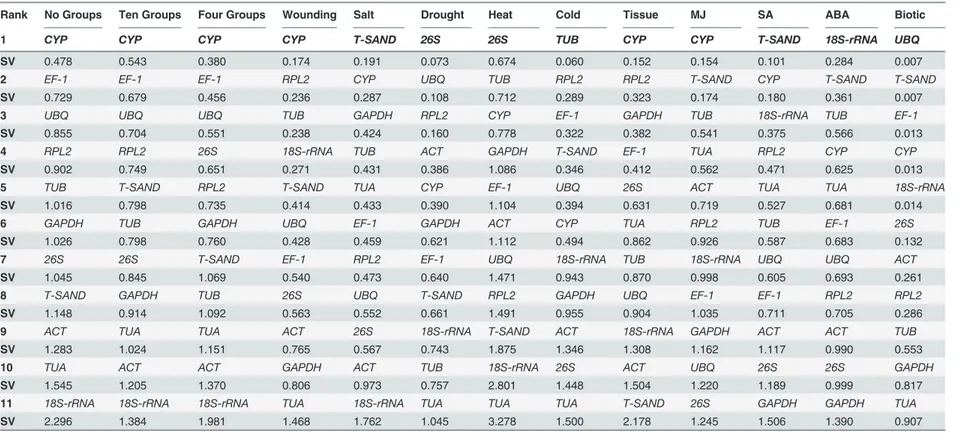
NormFinder analysis. The Expression stability of 11 candidate genes was further analyzed using MS Excel-based NormFinder software. NormFinder measures gene expression stability by comparing the variation within and between user-defined sample groups [28]. Candidate control genes with lowest stability values have the minimum intra and intergroup variation and thus are top ranked. For each candidate gene, NormFinder provides a stability value (SV) that is a direct measurement of expression variation. To perform NormFinder analysis log transformed data was used as input and further divided into 2 types of subgroups. First sub-group consists of ten divisions based on different treatment and other sub-group includes only four subgroups (biotic, abiotic treatments, different tissues and plant growth regulators,). At the same time, all samples with no subgroups were also analyzed using this approach as well. Divi-sion of samples into subgroups did not showed significant effect on the results obtained by Fig 3. Expression stability and ranking of the candidate reference genes by geNorm.Expression stability and ranking of 11 reference genes calculated with geNorm in all the samples (A), Wounding (B), Salt (C), Drought (D), Heat (E), Cold (F), Tissue (G), MJ (H), SA (I), ABA (J) and Biotic (K). A lower M value indicates more stable gene expression.
doi:10.1371/journal.pone.0118860.g003
Reference Genes for Quantitative RT-PCR inWithania somnifera
NormFinder. With ten subgroups and without any subgroups NormFinder identifiedCYPas the most stable gene with lowest SV values for all treatments (Table 2) which was consistent with the result given by geNorm. Within ten subgroupsCYPandEF-1was found to be the best combination of genes across all samples with a stability value of 0.419, which is lower than the single bestCYP(0.543). If samples categorized into four subgroups againCYPand EF-1 (0.129) combination was found to be best for all treatments. For individual treatmentsCYPfor wounding, different tissues and MJ treated samples,T-SANDfor salt and SA treatment,26Sfor heat and drought treated samples were identified to be most reliable genes. Similarly,TUBfor cold,UBQfor biotic stress, and18s-rRNAfor ABA treatment were on top position. Overall analysisCYP,26S, andT-SANDshowed a remarkable stability of their expression levels and were always classified among the top positions whileTUA,18s-rRNAandGAPDHwere always included among the least stable reference genes.
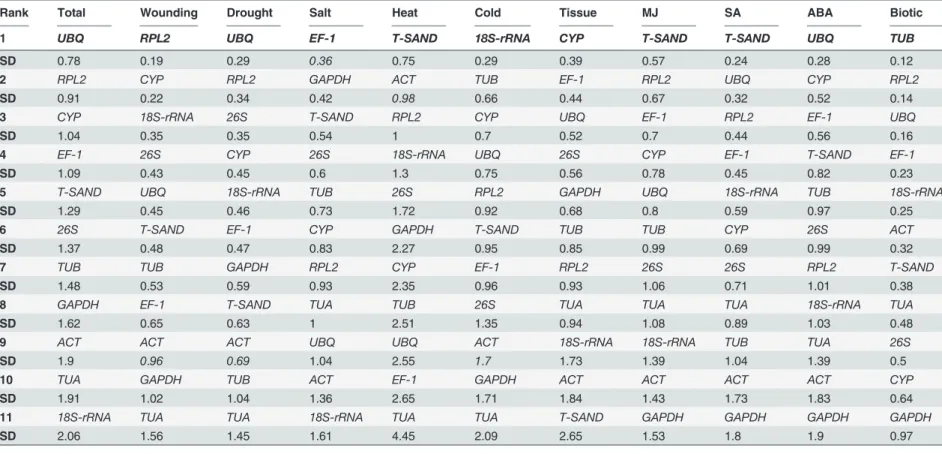
BestKeeper analysis. BestKeeper, an Excel-based tool, estimated the coefficient of correla-tion (r) and BestKeeper Index (geometric mean) to find the most stably expressed genes [29]. Raw Cq values of each gene were used to calculate the coefficient of variance (CV) and the standard deviation (SD). The genes with the lowest value of coefficient of variance and stan-dard deviation (CV±SD) are identified as the most stable reference gene. Genes that show a SD value less than 1 are considered acceptable [33–35]. In our study,UBQ(SD = 0.78) andRPL2 (SD = 0.91) were found to have stable expression in all the samples, while18S-rRNA(SD = 2.06) showed least stable expression (Table 3). Further in individual treatments, BestKeeper analysis revealed that for, drought, ABA and all samples taken togetherUBQemerged as the most stably expressed gene, while for heat, MJ and SA stressT-SANDwas found to be most stably expressed gene. However,EF-1for salt,RPL2for wounding,CYPfor different tissues, Fig 4. Pairwise variation calculated by geNorm to determine the minimum number of reference genes required for accurate normalization in each experimental set.The cut off value is 0.15, below which the inclusion of an additional reference gene is not required.
Table 2. Ranking orders of the candidate reference genes according to their stability value calculated NormFinder algorithm.
Rank No Groups Ten Groups Four Groups Wounding Salt Drought Heat Cold Tissue MJ SA ABA Biotic
1 CYP CYP CYP CYP T-SAND 26S 26S TUB CYP CYP T-SAND 18S-rRNA UBQ
SV 0.478 0.543 0.380 0.174 0.191 0.073 0.674 0.060 0.152 0.154 0.101 0.284 0.007
2 EF-1 EF-1 EF-1 RPL2 CYP UBQ TUB RPL2 RPL2 T-SAND CYP T-SAND T-SAND
SV 0.729 0.679 0.456 0.236 0.287 0.108 0.712 0.289 0.323 0.174 0.180 0.361 0.007
3 UBQ UBQ UBQ TUB GAPDH RPL2 CYP EF-1 GAPDH TUB 18S-rRNA TUB EF-1
SV 0.855 0.704 0.551 0.238 0.424 0.160 0.778 0.322 0.382 0.541 0.375 0.566 0.013
4 RPL2 RPL2 26S 18S-rRNA TUB ACT GAPDH T-SAND EF-1 TUA RPL2 CYP CYP
SV 0.902 0.749 0.651 0.271 0.431 0.386 1.086 0.346 0.412 0.562 0.471 0.625 0.013
5 TUB T-SAND RPL2 T-SAND TUA CYP EF-1 UBQ 26S ACT TUA TUA 18S-rRNA
SV 1.016 0.798 0.735 0.414 0.433 0.390 1.104 0.394 0.631 0.719 0.527 0.681 0.014
6 GAPDH TUB GAPDH UBQ EF-1 GAPDH ACT CYP TUA RPL2 TUB EF-1 26S
SV 1.026 0.798 0.760 0.428 0.459 0.621 1.112 0.494 0.862 0.926 0.587 0.683 0.132
7 26S 26S T-SAND EF-1 RPL2 EF-1 UBQ 18S-rRNA TUB 18S-rRNA UBQ UBQ ACT
SV 1.045 0.845 1.069 0.540 0.473 0.640 1.471 0.943 0.870 0.998 0.605 0.693 0.261
8 T-SAND GAPDH TUB 26S UBQ T-SAND RPL2 GAPDH UBQ EF-1 EF-1 RPL2 RPL2
SV 1.148 0.914 1.092 0.563 0.552 0.661 1.491 0.955 0.904 1.035 0.711 0.705 0.286
9 ACT TUA TUA ACT 26S 18S-rRNA T-SAND ACT 18S-rRNA GAPDH ACT ACT TUB
SV 1.283 1.024 1.151 0.765 0.567 0.743 1.875 1.346 1.308 1.162 1.117 0.990 0.553
10 TUA ACT ACT GAPDH ACT TUB 18S-rRNA 26S ACT UBQ 26S 26S GAPDH
SV 1.545 1.205 1.370 0.806 0.973 0.757 2.801 1.448 1.504 1.220 1.189 0.999 0.817
11 18S-rRNA 18S-rRNA 18S-rRNA TUA 18S-rRNA TUA TUA TUA T-SAND 26S GAPDH GAPDH TUA
SV 2.296 1.384 1.981 1.468 1.762 1.045 3.278 1.500 2.178 1.245 1.506 1.390 0.907
Note. Higher Stability value (SV) indicates genes with low transcriptional stability, whereas lower (SV) values indicate genes with high transcriptional stability.
doi:10.1371/journal.pone.0118860.t002
Reference
Genes
for
Quantitati
ve
RT-PCR
in
Withan
ia
somnifera
PLOS
ONE
|DOI:10.137
1/journal.p
one.0118860
March
13,
2015
10
Table 3. Ranking orders of the candidate reference genes according to their standard deviation calculated Bestkeeper algorithm.
Rank Total Wounding Drought Salt Heat Cold Tissue MJ SA ABA Biotic
1 UBQ RPL2 UBQ EF-1 T-SAND 18S-rRNA CYP T-SAND T-SAND UBQ TUB
SD 0.78 0.19 0.29 0.36 0.75 0.29 0.39 0.57 0.24 0.28 0.12
2 RPL2 CYP RPL2 GAPDH ACT TUB EF-1 RPL2 UBQ CYP RPL2
SD 0.91 0.22 0.34 0.42 0.98 0.66 0.44 0.67 0.32 0.52 0.14
3 CYP 18S-rRNA 26S T-SAND RPL2 CYP UBQ EF-1 RPL2 EF-1 UBQ
SD 1.04 0.35 0.35 0.54 1 0.7 0.52 0.7 0.44 0.56 0.16
4 EF-1 26S CYP 26S 18S-rRNA UBQ 26S CYP EF-1 T-SAND EF-1
SD 1.09 0.43 0.45 0.6 1.3 0.75 0.56 0.78 0.45 0.82 0.23
5 T-SAND UBQ 18S-rRNA TUB 26S RPL2 GAPDH UBQ 18S-rRNA TUB 18S-rRNA
SD 1.29 0.45 0.46 0.73 1.72 0.92 0.68 0.8 0.59 0.97 0.25
6 26S T-SAND EF-1 CYP GAPDH T-SAND TUB TUB CYP 26S ACT
SD 1.37 0.48 0.47 0.83 2.27 0.95 0.85 0.99 0.69 0.99 0.32
7 TUB TUB GAPDH RPL2 CYP EF-1 RPL2 26S 26S RPL2 T-SAND
SD 1.48 0.53 0.59 0.93 2.35 0.96 0.93 1.06 0.71 1.01 0.38
8 GAPDH EF-1 T-SAND TUA TUB 26S TUA TUA TUA 18S-rRNA TUA
SD 1.62 0.65 0.63 1 2.51 1.35 0.94 1.08 0.89 1.03 0.48
9 ACT ACT ACT UBQ UBQ ACT 18S-rRNA 18S-rRNA TUB TUA 26S
SD 1.9 0.96 0.69 1.04 2.55 1.7 1.73 1.39 1.04 1.39 0.5
10 TUA GAPDH TUB ACT EF-1 GAPDH ACT ACT ACT ACT CYP
SD 1.91 1.02 1.04 1.36 2.65 1.71 1.84 1.43 1.73 1.83 0.64
11 18S-rRNA TUA TUA 18S-rRNA TUA TUA T-SAND GAPDH GAPDH GAPDH GAPDH
SD 2.06 1.56 1.45 1.61 4.45 2.09 2.65 1.53 1.8 1.9 0.97
Note. Reference genes with SD values greater than 1 are considered as inconsistent and should be excluded.
doi:10.1371/journal.pone.0118860.t003
Reference
Genes
for
Quantitati
ve
RT-PCR
in
Withan
ia
somnifera
|DOI:10.137
1/journal.p
one.0118860
March
13,
18Sr-RNAfor cold andTUBfor biotic stress had the lowest standard deviation, thus exhibit most stable expression.
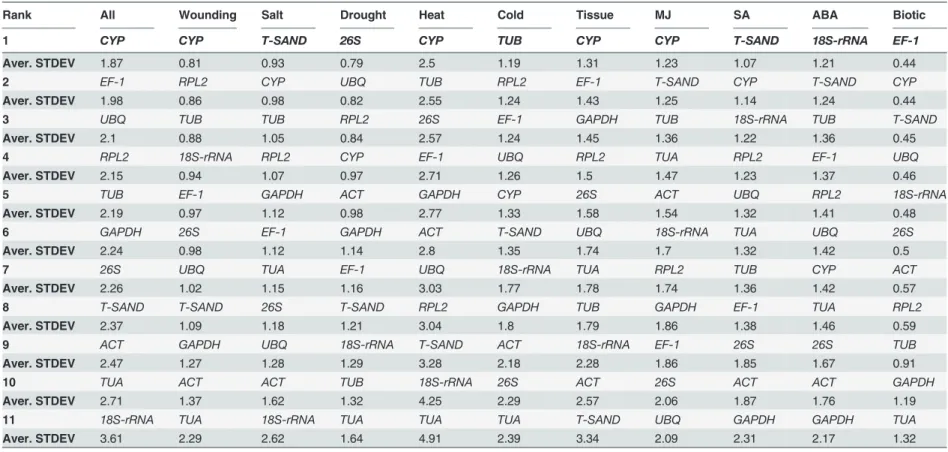
Further, to evaluate the results obtained from the three software, geNorm, NormFinder and Bestkeeper, we used comparativeΔCt. The comparativeΔCt method ranks the reference genes based on their mean standard deviation in the pairwise comparisons [30]. For comprehensive ranking of candidate genes average Cq values were used as such into the program and GM was calculated. The stability rankings results obtained fromΔCt method showed high similarity with the results described by four softwares geNorm, NormFinder and Bestkeeper (Table 4). Further, RefFinder was used to compare different algorithms for the selection of the top four most stable and two least stable reference genes (Table 5). RefFinder (http://www.leonxie.com/referencegene. php), a web-based comprehensive tool which uses all these four algorithms geNorm, NormFin-der, BestKeeper and comparativeΔCt methods, and assigns an appropriate weight to an individ-ual gene and calculates the geometric mean for comprehensive ranking of all reference genes.
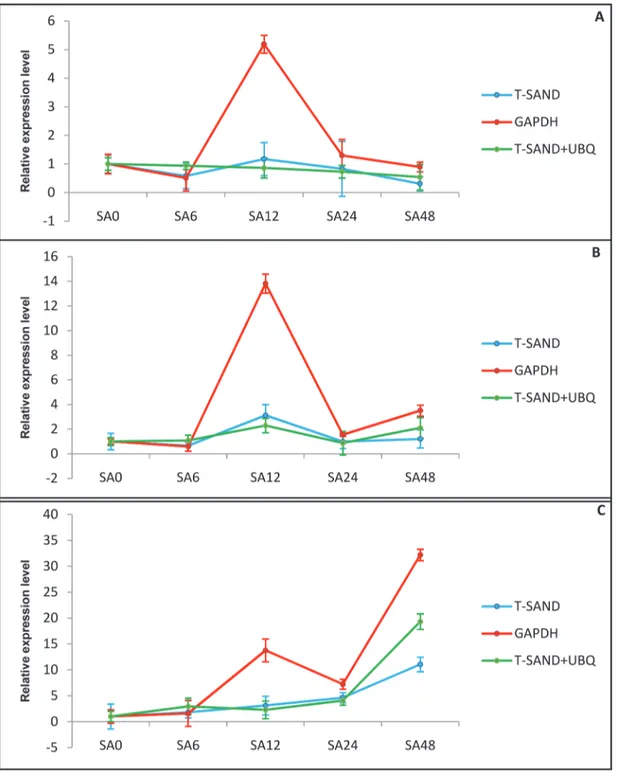
Validation of reference genes. In order to further evaluate the expression stability of select-ed reference genes, we analyzselect-ed the expression of three genes that play key role in withanolide bio-synthesis pathway. The expression ofHMGRandCASwas not significantly affected by treatment with SA. The results reveal that the expression level ofHMGRwas highest after 12 h of treatment and then decline thereafter. The relative expression ofCASshowed a variable pattern of expression where it showed significant upregulation after 12 and 48 h of treatment. Expression analysis of P450showed upregulation after SA treatment and reached maximum after 48 h (Fig. 5).
Discussion
The qRT-PCR is one of the most frequently used method for accurate and sensitive quantifica-tion of gene expression analysis. However, these outcomes are strongly dependent on reliable reference controls [26]. Although a single endogenous control for normalization is often used, it is largely limited by stability of gene expression across different experimental condition. Thus, it was considered essential to explore the expression stability of the control genes and to find out ideal endogenous reference genes with stable gene expression under particular set of conditions. In order to screen such reliable reference genes, we analyzed expression profiles of 11 genes under different experimental conditions and different software packages: geNorm, NormFinder, Bestkeeper and comparativeΔCt method. Recently, these statistical algorithms have been used to validate and identify the best reference genes for qRT-PCR data normaliza-tion across a variety of tissues, organs, developmental stages, and stress condinormaliza-tions in various plant species like peanut [36], tomato [22], barley, sorghum, wheat, maize [37].
As shown in box-and-whiskers plots, the selected genes exhibited a relatively wide range of expression that confirmed that no single gene had a constant gene expression under different stress conditions. When the outcome of these four algorithms was compared, for wounding, salt, drought, MJ, SA, biotic stress and for all samples together we found highly consistent re-sults for first position, with slight changes in other positions. For example, for wounding and MJ treatment, all algorithms chooseCYPon top, except Bestkeeper which rankedCYPat 2nd position. From these results,CYPwas found to be appropriate gene for wounding and MJ treat-ed samples, and this is consistent with the expression stability of the other ribosomal protein RPL2which is a widely used gene for normalization in expression studies [38]. Three algo-rithms geNorm, NormFinder andΔCt method selected26S and UBQas best genes for drought treated samples and recommended as best genes for normalization. Previous studies in rice showed the highest expression stability ofUBQ5andEF-1αamong 10 reference genes tested [39]. Similarly, UBQ was reported as most stably expressed gene inPlatycladus orientalisfor salt stress samples [34].T-SANDfor SA treatment andCYPamong different tissues were
Reference Genes for Quantitative RT-PCR inWithania somnifera
Table 4. Ranking orders of the candidate reference genes according to their average standard deviation calculatedΔCt method.
Rank All Wounding Salt Drought Heat Cold Tissue MJ SA ABA Biotic
1 CYP CYP T-SAND 26S CYP TUB CYP CYP T-SAND 18S-rRNA EF-1
Aver. STDEV 1.87 0.81 0.93 0.79 2.5 1.19 1.31 1.23 1.07 1.21 0.44
2 EF-1 RPL2 CYP UBQ TUB RPL2 EF-1 T-SAND CYP T-SAND CYP
Aver. STDEV 1.98 0.86 0.98 0.82 2.55 1.24 1.43 1.25 1.14 1.24 0.44
3 UBQ TUB TUB RPL2 26S EF-1 GAPDH TUB 18S-rRNA TUB T-SAND
Aver. STDEV 2.1 0.88 1.05 0.84 2.57 1.24 1.45 1.36 1.22 1.36 0.45
4 RPL2 18S-rRNA RPL2 CYP EF-1 UBQ RPL2 TUA RPL2 EF-1 UBQ
Aver. STDEV 2.15 0.94 1.07 0.97 2.71 1.26 1.5 1.47 1.23 1.37 0.46
5 TUB EF-1 GAPDH ACT GAPDH CYP 26S ACT UBQ RPL2 18S-rRNA
Aver. STDEV 2.19 0.97 1.12 0.98 2.77 1.33 1.58 1.54 1.32 1.41 0.48
6 GAPDH 26S EF-1 GAPDH ACT T-SAND UBQ 18S-rRNA TUA UBQ 26S
Aver. STDEV 2.24 0.98 1.12 1.14 2.8 1.35 1.74 1.7 1.32 1.42 0.5
7 26S UBQ TUA EF-1 UBQ 18S-rRNA TUA RPL2 TUB CYP ACT
Aver. STDEV 2.26 1.02 1.15 1.16 3.03 1.77 1.78 1.74 1.36 1.42 0.57
8 T-SAND T-SAND 26S T-SAND RPL2 GAPDH TUB GAPDH EF-1 TUA RPL2
Aver. STDEV 2.37 1.09 1.18 1.21 3.04 1.8 1.79 1.86 1.38 1.46 0.59
9 ACT GAPDH UBQ 18S-rRNA T-SAND ACT 18S-rRNA EF-1 26S 26S TUB
Aver. STDEV 2.47 1.27 1.28 1.29 3.28 2.18 2.28 1.86 1.85 1.67 0.91
10 TUA ACT ACT TUB 18S-rRNA 26S ACT 26S ACT ACT GAPDH
Aver. STDEV 2.71 1.37 1.62 1.32 4.25 2.29 2.57 2.06 1.87 1.76 1.19
11 18S-rRNA TUA 18S-rRNA TUA TUA TUA T-SAND UBQ GAPDH GAPDH TUA
Aver. STDEV 3.61 2.29 2.62 1.64 4.91 2.39 3.34 2.09 2.31 2.17 1.32
Note. Higher Aver. STDEV values indicate genes with low transcriptional stability, whereas lower Aver. STDEV values indicate genes with high transcriptional stability.
doi:10.1371/journal.pone.0118860.t004
Reference
Genes
for
Quantitati
ve
RT-PCR
in
Withan
ia
somnifera
|DOI:10.137
1/journal.p
one.0118860
March
13,
Table 5. Relative stability ranking of potential reference genes based on geNorm, NormFinder, Bestkeeper andΔCt method.
Experimental conditions
Four most stable genes Recommended
comprehensive ranking
Two Least stable genes
geNorm NormFinder Bestkeeper ΔCt
All CYP,EF-1,UBQ,RPL2 TUB,CYP,UBQ,26S UBQ,RPL2,CYP,EF-1 CYP, EF-1, UBQ, RPL2
CYP,EF-1,UBQ,RPL2 18S-rRNA,TUA
Wounding CYP,UBQ,TUB, RPL2
CYP,RPL2,TUB, 18S-rRNA
RPL2,CYP,18S-rRNA, 26S
CYP,RPL2,TUB, 18S-rRNA
CYP,RPL2,TUB,18S-rRNA TUA,GAPDH
Salt TUB,RPL2, CYP,T-SAND
UBQ,GAPDH,CYP, EF-1
EF-1,GAPDH,T-SAND, 26S
T-SAND,CYP,TUB, RPL2
T-SAND,TUB,CYP,EF-1 18S-rRNA,ACT
Drought 26S,RPL2,UBQ, CYP
26S,UBQ,RPL2,ACT UBQ,RPL2,26S,CYP 26S,UBQ,RPL2, CYP
26S,UBQ,RPL2,CYP TUA,TUB
Heat CYP,EF-1,TUB,26S 26S,TUB,CYP, GAPDH
T-SAND,ACT,RPL2, 18S-rRNA
CYP,TUB,26S,EF-1 CYP,26S,TUB,EF-1 TUA,18S-rRNA
Cold CYP,UBQ,TUB,
RPL2
TUB,RPL2,EF-1, T-SAND
18S-rRNA,TUB,CYP, UBQ
TUB,RPL2,EF-1, UBQ
TUB,UBQ,RPL2,CYP TUA,ACT
Tissue CYP,EF-1,GAPDH, RPL2
CYP,RPL2 GAPDH, EF-1
CYP,EF-1,UBQ,26S CYP,EF-1,GAPDH, RPL2
CYP,EF-1,GAPDH,RPL2 T-SAND,ACT
MJ CYP,TUB,T-SAND, 18S-rRNA
CYP,T-SAND,TUB, TUA
T-SAND,RPL2,EF-1, CYP
CYP,T-SAND,TUB, TUA
CYP,T-SAND,TUB,RPL2 26S,UBQ
SA T-SAND,UBQ,RPL2, EF-1
T-SAND,CYP, 18S-rRNA,RPL2
T-SAND,UBQ,RPL2, EF-1
T-SAND,CYP, 18S-rRNA,RPL2
T-SAND,UBQ,RPL2,CYP GAPDH,ACT
ABA RPL2,EF-1,26S, UBQ
18S-rRNA,T-SAND, TUB,CYP
UBQ,CYP,EF-1, T-SAND
18S-rRNA,T-SAND, TUB,EF-1
18S-rRNA,EF-1,T-SAND, UBQ
GAPDH,ACT
Biotic UBQ, T-SAND,EF-1, 18S-rRNA
UBQ, T-SAND,EF-1, CYP
TUB,RPL2,UBQ,EF-1 EF-1,CYP,T-SAND, UBQ
UBQ,T-SAND,EF-1,TUB GAPDH,TUA
found to be the best reference genes for normalization by all methods. Previous studies in Buckwheat also identifiedT-SANDas one of the top-ranked reference gene [40].18S-rRNA was identified as the most stable gene for ABA treated samples by NormFinder andΔCt meth-od. For heat and cold treated samples all software packages showed high variation for ideal Fig 5. Relative expression level of withanolides biosynthesis genes in response to SA treatment.Transcript level relative quantification of HMGR (A), CAS (B) and P450 (C). The most stable genes recommended for SA treatment (T-SANDand UBQ) and the least stable gene GAPDH were used for normalization. ForT-SANDand UBQ geometric mean was calculated and used for normalization of expression. Error bars show standard deviation calculated from three biological replicates.
genes. GeNorm andΔCt method rankedCYPas common best genes for heat treatment but ac-cording to NormFinder and Bestkeeper26SandT-SANDwas most stable gene, respectively. The TUB gene plays an important role in cell structure maintenance. In our study for cold treated samples,TUBwas found to be most stable when analyzed by NormFinder andΔCt method but geNorm rankedTUBon 3rdposition, and Bestkeeper on 2ndposition. We observed that the top three positions of reference genes for all samples together were almost the same when determined by geNorm, NormFinder and comparativeΔCt and not by Bestkeeper. Be-cause all these software packages are based on different algorithms, this variation in the results can be expected. Further, these results clearly indicated that it is extremely important to vali-date the expression stability of these genes prior to use for normalization because none of the selected genes showed constant gene expression in all the tested samples.
CYPwas found to be the best gene for wounding, heat, MJ, biotic stress, different tissues and combined stress samples together. Our results are consistent with results found by Jain et al 2008 [41] who also reported that according to geNorm andΔCt analysis, eukaryotic elon-gation factor 1-beta (ELF1B) and cyclophilin (CYP2) could be used as reference genes to nor-malize gene expression in soybean. Earlier, CYP was also identified as most stable gene for normalization in Siberian Apricot Germplasms [42] andPetunia hybrida[43].
To date, actin(ACT)has been used most frequently as the internal reference gene in gene ex-pression analysis by qRT-PCR and semi-quantitative PCR inW.somnifera[18,24,44] and this genes was selected without any validation study to evaluate its suitability under different experi-mental conditions. However, various studies indicate that under different experiexperi-mental conditions the expression pattern of commonly used housekeeping genes can vary considerably [45–47]. Fur-ther, this may not be true in all plant species like actin gene exhibit inappropriate expression sta-bility to use as a reference gene in one of grass species,Brachypodium distachyon[32]. Further, in rice, the expression analysis revealed thatACTwas not even detected as expressed, in one or more tissue/stress microarray experiments [48]. In another reference gene validation study in peanut, ACTgene was found to be stable only in vegetative stages not in biotic and abiotic stress treat-ments, which indicates the influence of the experimental conditions on its expression [36].
For Overall analysis RefFinder was used in which 4 statistical approaches were equally weighted and combined to find out four top ranked genes (Table 5). And these results sug-gested that each tested experimental stress condition needs a specific set of reference genes for normalization. But all these methods found thatTUA,GAPDHand18S-rRNAwere the most unstable genes, thus suggested inappropriate as the reference genes for gene expression analysis through qRT-PCR analysis inW.somnifera. Due to high expression variability ofTUAit was also not considered as suitable internal controls in different verities and organs of litchi [49]. On the other handGAPDHwas considered as the most stable gene for normalization in differ-ent coffee cultivars and drought stress [50].GAPDHis a key enzyme involved in glycolysis but from our results it seems that it may also be involved in other cellular functions as well. In earli-er studies,18S-rRNAwas used as an internal reference gene and it was identified as the most re-liable reference gene for normalization in rice [51] and cereals [52]. However inW.Somnifera expression of18S-rRNAwas unstable for most of the treated samples and not recommended as a reliable reference gene for normalization. These results suggest that reference genes are not only implicated in the basal cell metabolism but also may participate in other cellular functions and are regulated differently in different plant species [20].
For validation studies we used the two most stable genes (T-SANDandUBQ) and one least stable gene (GAPDH). In recent years, intensive research has been carried out on salicylic acid (SA) due to its function as an endogenous signal which plays a important role during the plant response to biotic and abiotic stresses such as drought, chilling, heavy metal toxicity, heat, and osmotic stress [53]. SA also importantly contributes to growth and development regulation.
Reference Genes for Quantitative RT-PCR inWithania somnifera
Treatment with this signalling molecule has been reported to enhance secondary metabolites production in plants [54,55]. Hence we choose SA to study its effect on the expression of with-anolides biosynthetic pathway genes.HMGRcatalyzes the irreversible conversion of 3-hy-droxy-3-methylglutaryl coenzyme A (HMG-CoA) into mevalonic acid which is the key regulatory step of isoprenogenesis leading to the synthesis of IPP and DMAPP [56]. Our results showed that the expression ofHMGRincreased non-significantly with SA treatment, which matches the result obtained by Akhtar et al [57] which also showed slight upregulation after 24hrs of treatment followed by decline. The other important gene of withanolide biosynthetic pathway isCASthat leads to the formation of cycloartenol, which act as precursor to withano-lides and diverse triterpenoids. There are no reports in literature about expression ofCAS under SA treatment. Only one report is available which described the non significant effect of methyl jasmonate onCASgene expression [58]. Recent studies inW.somniferahave shown thatP450is an important gene of withanolides biosynthesis and expression ofP450gene is sig-nificantly upregulated inWithaniaunder SA treatments [18]. Our study also showed that the expression ofP450gene was upregulated after SA treatment usingT-SANDandUBQas endog-enous controls. The expression patterns of these three genes showed almost similar trends when most stableT-SANDandUBQreference genes were used either singly or in combination. On the other hand when most unstableGAPDHwas used as reference gene, expression was over estimated after 12 h and 48 h of SA treatment. This further indicated that using an unsta-ble reference gene generated biases that could lead to misinterpretation of gene expression re-sults and this gene is not appropriate for gene expression studies inWithania.
In conclusion, the present work provides useful background information about various ref-erence genes selection for qRT-PCR studies inW.somnifera. The study will contribute signifi-cantly in background of upsurge the interest in genomics and transcriptomics studies in this high value medicinal plant.
Supporting Information
S1 Fig. RNA sample on a 2% agarose gel stained with ethidium bromide.
(TIF)
S2 Fig. PCR results of candidate reference genes.PCR products were run on a 2% agarose gel. Amplicons were of the expected sizes (CYP-87bp,T-SAND-90bp,EF-1-107bp, GAPDH-99bp,TUB-102bp,UBQ-111bp,26S-103bp,18S-rRNA-106bp,TUA-101bp,RPL2-119bp, ACT-116bp), L = 100bp ladder.
(TIF)
S3 Fig. Dissociation curves for 11 potential reference genes and three validation genes: (A)
EF-1, (B)GAPDH, (C)CYP, (D)T-SAND, (E)26S, (F)TUA, (G)18S-rRNA, (H)RPL2, (I)
TUB, (J)UBQ, (K)ACT, (L) CAS, (M) HMGR, (N) P450.
(TIF)
S1 Table. Descriptions of withanolides biosynthetic pathway genes used for validation studies.
(PDF)
Author Contributions
References
1. Sharma A, Sharma R, Chaudhary P, Dobhal MP, Sharma. Selective cytotoxicity of non-small cell lung cancer cells by the Withaferin A-fortified root extract of Ashwagandha involves differential cell-cycle ar-rest and apoptosis. Phytopharmacol. 2011; 1: 54–70.
2. Bhattacharya A, Ghosal S, Bhattacharya S. Anti-oxidant effect ofWithania somniferaglycowithanolides in chronic foot shock stress-induced perturbations of oxidative free radical scavenging enzymes and lipid peroxidation in rat frontal cortex and striatum. J Ethnopharmacol. 2001; 74: 1–6. PMID:11137343
3. Chaudhary G, Sharma U, Jagannathan NR, Gupta YK. Evaluation ofWithania somniferain a middle ce-rebral artery occlusion model of stroke in rats. Clin Exp Pharmacol P. 2003; 30: 399–404.
4. Jayaprakasam B, Strasburg GA, Nair MG. Potent lipid peroxidation inhibitors fromWithania somnifera
fruits. Tetrahedron. 2004; 60: 3109–3121.
5. Mandal C, Dutta A, Mallick A, Chandra S, Misra L, Sangwan RS, et al. Withaferin A induces apoptosis by activating p38 mitogen-activated protein kinase signaling cascade in leukemic cells of lymphoid and myeloid origin in a transcription dependent manner through mitochondrial death cascade. Apoptosis. 2008; 13: 1450–1464. doi:10.1007/s10495-008-0271-0PMID:18987975
6. Wadhwa R, Singh R, Gao R, Shah N, Widodo N, Nakamoto T, et al. Water extract of ashwagandha leaves has anticancer activity: Identification of an active component and its mechanism of action. Plos One. 2013; 8: e77189. doi:10.1371/journal.pone.0077189PMID:24130852
7. Chatterjee S, Srivastava S, Khalid A, Singh N, Sangwan RS, Sidhu OP, et al. Comprehensive metabol-ic fingerprinting ofWithania somniferaleaf and root extracts. Phytochemistry. 2010; 71: 1085–1094. doi:10.1016/j.phytochem.2010.04.001PMID:20483437
8. Sangwan R, Chaurasiya ND, Misra LN, Lal P, Uniyal GC, Sharma R, et al. Phytochemical variability in commercial herbal products and preparations ofWithania somnifera(Ashwagandha). Curr Sci. 2004; 86: 461–464.
9. Misra L, Mishra P, Pandey A, Sangwan RS, Sangwan NS. 1, 4-Dioxane and ergosterol derivatives from
Withania somniferaroots. J Asian Nat Prod Res. 2012; 14: 39–45. doi:10.1080/10286020.2011. 622719PMID:22263592
10. Sharma P, Trivedi P. Evaluation of different fungal antagonists againstFusarium oxysporuminfecting
Withania somnifera(L.) Dunal. Assam University Journal of Science and Technology. 2010; 6: 37–41.
11. Barua A, Bradaric MJ, Bitterman P, Abramowicz JS, Sharma S, Basu S, et al. Dietary supplementation of Ashwagandha (Withania somnifera, Dunal) enhances NK cell function in ovarian tumors in the laying hen model of spontaneous ovarian cancer. Am J Reprod Immunol. 2013; 70: 538–550. doi:10.1111/aji. 12172PMID:24188693
12. Widodo N, Priyandoko D, Shah N, Wadhwa R, Kaul SC. Selective killing of cancer cells by Ashwa-gandha leaf extract and its component Withanone involves ROS signaling. Plos One. 2010; 5: e13536. doi:10.1371/journal.pone.0013536PMID:20975835
13. VelSzic KS, de Beeck KO, Ratman D, Wouters A, Beck IM, Declerck K, et al. Pharmacological levels of Withaferin A (Withania somnifera) trigger clinically relevant anticancer effects specific to triple negative breast cancer cells. Plos One. 2014; 9: e87850. doi:10.1371/journal.pone.0087850PMID:24498382
14. Roy RV, Suman S, Das TP, Luevano JE, Damodaran C. Withaferin A, a steroidal lactone fromWithania somnifera, induces mitotic catastrophe and growth arrest in prostate cancer cells. J Nat Prod. 2013; 76: 1909–1915. doi:10.1021/np400441fPMID:24079846
15. Khazal KF, Samuel T, Hill DL, Grubbs CJ. Effect of an extract ofWithania somniferaroot on estrogen re-ceptor-positive mammary carcinomas. Anticancer Res. 2013; 33: 1519–1523. PMID:23564793
16. Gupta P, Goel R, Pathak S, Srivastava A, Singh SP, Sangwan RS, et al. De novo assembly, functional annotation and comparative analysis ofWithania somniferaleaf and root transcriptomes to identify pu-tative genes involved in the withanolides biosynthesis. Plos One 2013; 8: e62714. doi:10.1371/journal. pone.0062714PMID:23667511
17. Razdan S, Bhat WW, Rana S, Dhar N, Lattoo SK, Dhar RS, et al. Molecular characterization and pro-moter analysis of squalene epoxidase gene fromWithania somnifera(L.) Dunal. Mol Bio Rep. 2013; 40: 905–916.
18. Rana S, Lattoo SK, Dhar N, Razdan S, Bhat WW, Dhar RS, et al. NADPH-Cytochrome P450 reductase: molecular cloning and functional characterization of two paralogs fromWithania somnifera(L.) Dunal. Plos One. 2013; 8: e57068. doi:10.1371/journal.pone.0057068PMID:23437311
19. Chaturvedi P, Mishra M, Akhtar N, Gupta P, Mishra P, Tuli R, et al. Sterol glycosyltransferases-identifi-cation of members of gene family and their role in stress inWithania somnifera. Mol Bio Rep. 2012; 39: 9755–9764. doi:10.1007/s11033-012-1841-3PMID:22744427
Reference Genes for Quantitative RT-PCR inWithania somnifera
20. Artico S, Nardeli SM, Brilhante O, Grossi-de-Sa MF, Alves-Ferreira M. Identification and evaluation of new reference genes inGossypium hirsutumfor accurate normalization of real-time quantitative RT-PCR data. BMC Plant Biol. 2010; 10: 49. doi:10.1186/1471-2229-10-49PMID:20302670
21. Thellin O, Zorzi W, Lakaye B, De Borman B, Coumans B, Hennen G, et al. Housekeeping genes as in-ternal standards: use and limits. J Biotechnol. 1999; 75: 291–295. PMID:10617337
22. Exposito-Rodriguez M, Borges AA, Borges-Perez A, Perez JA. Selection of internal control genes for quantitative real-time RT-PCR studies during tomato development process. BMC Plant Biol. 2008; 8: 131. doi:10.1186/1471-2229-8-131PMID:19102748
23. Mishra MK, Chaturvedi P, Singh R, Singh G, Sharma LK, Pandey V, et al. Overexpression of WsSGTL1 gene ofWithania somniferaenhances salt tolerance, heat tolerance and cold acclimation ability in transgenicArabidopsisplants. Plos One. 2013; 8: e63064. doi:10.1371/journal.pone.0063064PMID: 23646175
24. Sabir F, Mishra S, Sangwan RS, Jadaun JS, Sangwan NS. Qualitative and quantitative variations in withanolides and expression of some pathway genes during different stages of morphogenesis in With-ania somniferaDunal. Protoplasma. 2013; 250: 539–549. doi:10.1007/s00709-012-0438-yPMID: 22878597
25. Pati PK, Sharma M, Salar RK, Sharma A, Gupta AP, Singh B. Studies on leaf spot disease ofWithania somniferaand its impact on secondary metabolites. Indian J Microbiol. 2008; 48: 432–437. doi:10. 1007/s12088-008-0053-yPMID:23100743
26. Bustin SA, Benes V, Garson JA, Hellemans J, Huggett J, Kubista M, et al. The MIQE guidelines: mini-mum information for publication of quantitative real-time PCR experiments. Clin Chem. 2009; 55: 611– 622. doi:10.1373/clinchem.2008.112797PMID:19246619
27. Vandesompele J, De Preter K, Pattyn F, Poppe B, Van Roy N, De Paepe A, et al. Accurate normaliza-tion of real-time quantitative RT-PCR data by geometric averaging of multiple internal control genes. Genome Biol. 2002; 3: research0034.11.
28. Andersen CL, Jensen JL, Orntoft TF. Normalization of real-time quantitative reverse transcription-PCR data: A model-based variance estimation approach to identify genes suited for normalization, applied to bladder and colon cancer data sets. Cancer Res. 2004; 64: 5245–5250. PMID:15289330
29. Pfaffl M, Tichopad A, Prgomet C, Neuvians T. Determination of stable housekeeping genes, differen-tially regulated target genes and sample integrity: BestKeeper-Excel-based tool using pair-wise correla-tions. Biotechnol Lett. 2004; 26: 509–515. PMID:15127793
30. Silver N, Best S, Jiang J, Thein S. Selection of housekeeping genes for gene expression studies in human reticulocytes using real-time PCR. BMC Molecular Biol. 2006; 7(1):33.
31. Zhu J, Zhang L, Li W, Han S, Yang W, Qi L, et al. Reference gene selection for quantitative real-time PCR normalization inCaragana intermediaunder different abiotic stress conditions. Plos One. 2013; 8: e53196. doi:10.1371/journal.pone.0053196PMID:23301042
32. Hong SY, Seo PJ, Yang MS, Xiang F, Park CM. Exploring valid reference genes for gene expression studies inBrachypodium distachyonby real-time PCR. BMC Plant Biol. 2008; 8: 112. doi:10.1186/ 1471-2229-8-112PMID:18992143
33. Chen G, Zhao L, Feng J, You G, Sun Q, Li P, et al. Validation of reliable reference genes for real-time PCR in human umbilical vein endothelial cells on substrates with different stiffness. Plos One. 2013; 8: e67360. doi:10.1371/journal.pone.0067360PMID:23840676
34. Chang E, Shi S, Liu J, Cheng T, Xue L, Yang X, et al. Selection of reference genes for quantitative gene expression studies inPlatycladus orientalis(Cupressaceae) using real-time PCR. Plos One. 2012; 7: e33278. doi:10.1371/journal.pone.0033278PMID:22479379
35. Migocka M, Papierniak A. Identification of suitable reference genes for studying gene expression in cu-cumber plants subjected to abiotic stress and growth regulators. Mol Breeding. 2011; 28: 343–357.
36. Reddy DS, Bhatnagar-Mathur P, Cindhuri KS, Sharma KK. Evaluation and validation of reference genes for normalization of quantitative real-time PCR based gene expression studies in Peanut. Plos One. 2013; 8: e78555. doi:10.1371/journal.pone.0078555PMID:24167633
37. Zhang K, Niu S, Di D, Shi L, Liu D, Cao X, et al. Selection of reference genes for gene expression stud-ies in virus-infected monocots using quantitative real-time PCR. J Biotechnol. 2013; 168: 7–14. doi:10. 1016/j.jbiotec.2013.08.008PMID:23954326
38. Li R, Xie W, Wang S, Wu Q, Yang N, Yang X, et al. Reference gene selection for qRT-PCR analysis in the sweetpotato whitefly,Bemisiatabaci(Hemiptera: Aleyrodidae). Plos One. 2013; 8: e53006. doi:10. 1371/journal.pone.0053006PMID:23308130
40. Demidenko NV, Logacheva MD, Penin AA. Selection and Validation of Reference Genes for Quantita-tive Real-Time PCR in Buckwheat (Fagopyrum esculentum) Based on Transcriptome Sequence Data. Plos One. 2011; 6: e19434. doi:10.1371/journal.pone.0019434PMID:21589908
41. Jian B, Liu B, Bi Y, Hou W, Wu C, Han T. Validation of internal control for gene expression study in soy-bean by quantitative real-time PCR. BMC Molecular Biol. 2008; 9: 1–14.
42. Niu J, Zhu B, Cai J, Li P, Wang L, Dai H, et al. Selection of Reference Genes for Gene Expression Stud-ies in Siberian Apricot (Prunus sibiricaL.) Germplasm Using Quantitative Real-Time PCR. PloS One. 2014; 9: e103900. doi:10.1371/journal.pone.0103900PMID:25105495
43. Mallona I, Lischewski S, Weiss J, Hause B, Egea-Cortines M. Validation of reference genes for quanti-tative real-time PCR during leaf and flower development in Petunia hybrida. BMC Plant Biol. 2010; 10: 4. doi:10.1186/1471-2229-10-4PMID:20056000
44. Kushwaha AK, Sangwan NS, Trivedi PK, Negi AS, Misra L, Sangwan RS. Tropine forming tropinone re-ductase gene fromWithania somnifera(Ashwagandha): Biochemical characteristics of the recombinant enzyme and novel physiological overtones of tissue-wide gene expression patterns. Plos One. 2013; 8: e74777. doi:10.1371/journal.pone.0074777PMID:24086372
45. Czechowski T, Stitt M, Altmann T, Udvardi MK, Scheible WR. Genome-wide identification and testing of superior reference genes for transcript normalization inArabidopsis. Plant Physiol. 2005; 139: 5–17. PMID:16166256
46. Suzuki T, Higgins P, Crawford D. Control selection for RNA quantitation. Biotechniques. 2000; 29: 332–337. PMID:10948434
47. Gutierrez L, Mauriat M, Guénin S, Pelloux J, Lefebvre JF, Louvet R, et al. The lack of a systematic vali-dation of reference genes: a serious pitfall undervalued in reverse transcription-polymerase chain reac-tion (RT-PCR) analysis in plants. Plant Biotechnol J. 2008; 6: 609–618. doi:10.1111/j.1467-7652.2008. 00346.xPMID:18433420
48. Narsai R, Ivanova A, Ng S, Whelan J. Defining reference genes in Oryza sativa using organ, develop-ment, biotic and abiotic transcriptome datasets. BMC Plant Biol. 2010; 10: 56. doi: 10.1186/1471-2229-10-56PMID:20353606
49. Zhong HY, Chen JW, Li CQ, Chen L, Wu JY, Chen JY, et al. Selection of reliable reference genes for expression studies by reverse transcription quantitative real-time PCR in litchi under different experi-mental conditions. Plant Cell Rep. 2011; 30: 641–653. doi:10.1007/s00299-010-0992-8PMID: 21301853
50. Cruz F, Kalaoun S, Nobile P, Colombo C, Almeida J, Barros LMG et al. Evaluation of coffee reference genes for relative expression studies by quantitative real-time RT-PCR. Mol Breeding. 2009; 23: 607– 616.
51. Kim BR, Nam HY, Kim SU, Kim SI, Chang YJ. Normalization of reverse transcription quantitative-PCR with housekeeping genes in rice. Biotechnol Lett. 2003; 25: 1869–1872. PMID:14677714
52. Jarosova J, Kundu JK. Validation of reference genes as internal control for studying viral infections in cereals by quantitative real-time RT-PCR. BMC Plant Biol. 2010; 10: 146. doi: 10.1186/1471-2229-10-146PMID:20630112
53. Rivas-San Vicente M., Plasencia J. Salicylic acid beyond defence: its role in plant growth and develop-ment. J Exp Bot. 2011; 62: 3321–3338. doi:10.1093/jxb/err031PMID:21357767
54. Lee MH, Jeong JH, Seo JW, Shin CG, Kim YS, In JG, et al. Enhanced triterpene and phytosterol bio-synthesis in Panax ginseng overexpressing squalene synthase gene. Plant Cell Physiol. 2004; 45: 976–984. PMID:15356323
55. Kim OT, Kim SH, Ohyama K, Muranaka T, Choi YE, Lee HY, et al. Upregulation of phytosterol and tri-terpene biosynthesis inCentella asiaticahairy roots overexpressed ginseng farnesyl diphosphate synthase. Plant Cell Rep. 2010; 29: 403–411. doi:10.1007/s00299-010-0831-yPMID:20195611
56. Chappell J. The biochemistry and molecular biology of isoprenoid metabolism. Plant Physiol. 1995; 107:1–6 PMID:12228337
57. Akhtar N, Gupta P, Sangwan NS, Sangwan RS, Trivedi PK. Cloning and functional characterization of 3-hydroxy-3-methylglutaryl coenzyme A reductase gene fromWithania somnifera: an important medici-nal plant. Protoplasma. 2012; 250: 613–622. doi:10.1007/s00709-012-0450-2PMID:22936023
58. Dhar N, Rana S, Razdan S, Bhat WW, Hussain A, Dhar RS. Cloning and Functional Characterization of Three Branch Point Oxidosqualene Cyclases FromWithania somnifera(L.) Dunal. J Biol Chem. 2014; jbc- M114–571919.
Reference Genes for Quantitative RT-PCR inWithania somnifera