Normalization in
Caragana intermedia
under Different
Abiotic Stress Conditions
Jianfeng Zhu1, Lifeng Zhang1, Wanfeng Li1, Suying Han2, Wenhua Yang1, Liwang Qi1*
1Laboratory of Cell Biology, Research Institute of Forestry, Chinese Academy of Forestry, Beijing, China,2Key Laboratory of Research Institute of Forest Ecology and Protection, Chinese Academy of Forestry, Beijing, China
Abstract
Quantitative real-time reverse transcription polymerase chain reaction (qPCR), a sensitive technique for gene expression analysis, depends on the stability of the reference genes used for data normalization.Caragana intermedia, a native desert shrub with strong drought-resistance, sand-fixing capacity and high forage value that is widespread in the desert land of west and northwest China, has not been investigated regarding the identification of reference genes suitable for the normalization of qPCR data. In this study, 10 candidate reference genes were analyzed inC. intermediasubjected to different abiotic (osmotic, salt, cold and heat) stresses, in two distinct plant organs (roots and leaves). The expression stability of these genes was assessed using geNorm, NormFinder and BestKeeper algorithms. The best-ranked reference genes differed across the different sets of samples, butUNK2,PP2AandSANDwere the most stable across all tested samples.UNK2andSAND would be appropriate for normalizing gene expression data for salt-treated roots, whereas the combination ofUNK2,SAND and EF-1a would be appropriate for salt-treated leaves. UNK1, UNK2 and PP2A would be appropriate for PEG-treated
(osmotic) roots, whereas the combination ofTIP41andPP2Awas the most suitable for PEG-treated leaves.SAND,PP2Aand TIP41exhibited the most stable expression in heat-treated leaves. In cold-treated leaves,SANDand EF-1awere the most
stably expressed. To further validate the suitability of the reference genes identified in this study, the expression levels of DREB1andDREB2(homologs ofAtDREB1andAtDREB2) were studied in parallel. This study is the first systematic analysis for the selection of superior reference genes for qPCR inC. intermediaunder different abiotic stress conditions, and will benefit future studies on gene expression inC. intermediaand other species of the leguminous genusCaragana.
Citation:Zhu J, Zhang L, Li W, Han S, Yang W, et al. (2013) Reference Gene Selection for Quantitative Real-time PCR Normalization inCaragana intermediaunder Different Abiotic Stress Conditions. PLoS ONE 8(1): e53196. doi:10.1371/journal.pone.0053196
Editor:Shu-Biao Wu, University of New England, Australia
ReceivedJuly 25, 2012;AcceptedNovember 26, 2012;PublishedJanuary 2, 2013
Copyright:ß2013 Zhu et al. This is an open-access article distributed under the terms of the Creative Commons Attribution License, which permits unrestricted use, distribution, and reproduction in any medium, provided the original author and source are credited.
Funding:This work was supported by the National Basic Research Program of China (2009CB119106) and the National High Technology Research and Development Program of China (2011AA100203). The funders had no role in study design, data collection and analysis, decision to publish, or preparation of the manuscript.
Competing Interests:The authors have declared that no competing interests exist.
* E-mail: lwqi@caf.ac.cn
Introduction
Quantitative real-time reverse transcription polymerase chain reaction (qPCR) is an efficient, specific, and reproducible method for quantifying transcript expression levels, and is widely used to analyze mRNA in different organisms [1], developmental stages [2,3] and responses to abiotic and biotic stress [4–7]. However, the accuracy of qPCR is influenced by a number of variables, such as RNA stability, quantity, purity, enzymatic efficiency in cDNA synthesis and PCR amplification [8]. Thus, to avoid bias, a normalization step is an essential pre-requisite. The most accepted approach for normalization is to include one or a small number of reference genes (internal control genes), whose expression is presumed stable in control and experimental conditions [9,10].
The traditional reference genes are mostly cellular maintenance genes, such as 18S ribosomal RNA (18S rRNA), actin (ACT), tubulin (TUB), glyceraldehyde-3-phosphate dehydrogenase (GAPDH), and elongation factor 1-a (EF1-a) [11,12]. However, recent studies indicate that these genes are not always stably expressed when tested in other species or under a wider range of
genes were identified by microarray analyses inArabidopsis thaliana and soybean that show highly stable expression levels [16,17]. These reference genes include SAND family protein (SAND), protein phosphatase 2A (PP2A), TIP41-like family protein (TIP41), F-box/kelch-repeat protein (F-box), phosphoenolpyruvate carbox-ylase-related kinase 1 (PEPKR1) and others. Many of these reference genes were found to outperform traditional reference genes, for example,PP2Ain hybrid roses [18],SANDin buckwheat [19] and TIP41 in peanut [20] were the most stably expressed genes in those systems. Therefore, systematic validation of reference genes is essential for certain experimental conditions and in different species [10]. Statistical algorithms, such as geNorm [21], NormFinder [22], and BestKeeper [23], have been used to identify the best reference genes for qPCR data normalization under different experimental conditions.
C. intermedia belongs to the family Fabaceae, and is a native desert shrub with strong drought-resistance, sand-fixing capacity and high forage value that is widespread in the desert land of west and northwest China [30]. From a scientific standpoint, it has proven an ideal material for studying the mechanisms of drought and salt tolerance of shrubs in China, because of its easy cultivation and strong abiotic resistance [30–32].
In this study, 10 candidate reference genes (ACT7,TUA5,EF -1a, PP2A, SAND, TIP41, F-box, PEPKR1, UNK1, UNK2) were selected because of their stable expression in microarray studies in A. thalianaand soybean [16,17]. The stability of these genes was analyzed inC. intermediasubjected to different abiotic (osmotic, salt, cold and heat) stresses, in two distinct plant organs (roots and leaves). Furthermore, to validate the selection of candidate reference genes, the expression levels of DREB1 and DREB2 homologues were assessed using different reference genes. This work will benefit future studies on gene expression inC. intermedia and other species of the leguminous genusCaragana.
Results
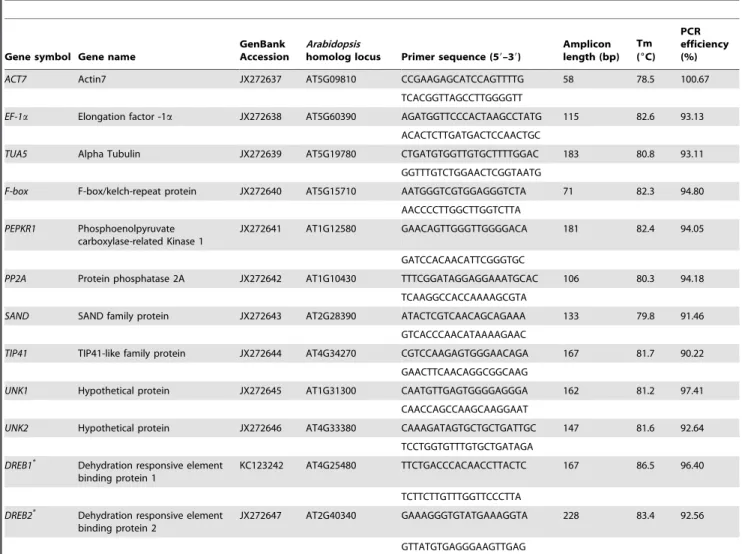
Expression Profiling of Candidate Reference Genes A total of 10 candidate reference genes were assessed using qPCR to quantify their mRNA levels (Table 1). The expression levels of the candidate reference genes were determined as quantification cycle (Cq) values, and the transcripts of these genes showed different levels of abundance (Figure 1). The mean Cq values of the genes ranged from 26–35, with most lying between 28 and 30 across all tested samples. EF-1a had the lowest Cq (mean Cq of 25.8), indicating the highest level of expression, SAND, PP2A, TIP41, TUA5, UNK1 and UNK2were moderately expressed,F-boxandACT7were expressed at low levels (mean Cq of 32.9 and 34.9).SANDshowed the least gene expression variation (coefficient of variation, CV, of 3.05%), whileACT7(5.78%) and TUA5(5.74%) were the most variable across all samples.
The variation in relative transcript amount of the reference genes across all tested samples is shown in Figure 2. Transcript amounts are represented as percentages, relative to the aggregated reference transcript pool for each sample. The proportions of PP2A, SANDand UNK2transcript remained relatively constant,
Table 1.Caragana intermediacandidate reference genes descriptions and comparison withArabidopsisorthologs.
Gene symbol Gene name
GenBank Accession
Arabidopsis
homolog locus Primer sequence (59–39)
Amplicon length (bp)
Tm (6C)
PCR efficiency (%)
ACT7 Actin7 JX272637 AT5G09810 CCGAAGAGCATCCAGTTTTG 58 78.5 100.67
TCACGGTTAGCCTTGGGGTT
EF-1a Elongation factor -1a JX272638 AT5G60390 AGATGGTTCCCACTAAGCCTATG 115 82.6 93.13 ACACTCTTGATGACTCCAACTGC
TUA5 Alpha Tubulin JX272639 AT5G19780 CTGATGTGGTTGTGCTTTTGGAC 183 80.8 93.11
GGTTTGTCTGGAACTCGGTAATG
F-box F-box/kelch-repeat protein JX272640 AT5G15710 AATGGGTCGTGGAGGGTCTA 71 82.3 94.80 AACCCCTTGGCTTGGTCTTA
PEPKR1 Phosphoenolpyruvate carboxylase-related Kinase 1
JX272641 AT1G12580 GAACAGTTGGGTTGGGGACA 181 82.4 94.05
GATCCACAACATTCGGGTGC
PP2A Protein phosphatase 2A JX272642 AT1G10430 TTTCGGATAGGAGGAAATGCAC 106 80.3 94.18
TCAAGGCCACCAAAAGCGTA
SAND SAND family protein JX272643 AT2G28390 ATACTCGTCAACAGCAGAAA 133 79.8 91.46
GTCACCCAACATAAAAGAAC
TIP41 TIP41-like family protein JX272644 AT4G34270 CGTCCAAGAGTGGGAACAGA 167 81.7 90.22 GAACTTCAACAGGCGGCAAG
UNK1 Hypothetical protein JX272645 AT1G31300 CAATGTTGAGTGGGGAGGGA 162 81.2 97.41
CAACCAGCCAAGCAAGGAAT
UNK2 Hypothetical protein JX272646 AT4G33380 CAAAGATAGTGCTGCTGATTGC 147 81.6 92.64
TCCTGGTGTTTGTGCTGATAGA
DREB1*
Dehydration responsive element binding protein 1
KC123242 AT4G25480 TTCTGACCCACAACCTTACTC 167 86.5 96.40
TCTTCTTGTTTGGTTCCCTTA
DREB2*
Dehydration responsive element binding protein 2
JX272647 AT2G40340 GAAAGGGTGTATGAAAGGTA 228 83.4 92.56
GTTATGTGAGGGAAGTTGAG
while those ofACT7,TUA5andF-boxwere more variable across all samples. The transcript levels of UNK1 remained relatively constant in PEG-treated roots (PR) or leaves (PL), and those of TIP41 were also relatively constant in the PL and cold-treated leaves (CL). Although the expression level of EF-1a was more variable across all samples and particularly high in the PR and salt-treated roots (SR), its expression was relatively constant in the CL and salt-treated leaves (SL). These results clearly suggested that the expression level of none of the reference genes is truly constant, and varies in different spatial and temporal patterns and environmental conditions.
Expression Stability of Candidate Reference Genes
a) geNorm analysis. The expression stability of the 10 reference genes was assessed using the geNorm software. The geNorm algorithm is based on the principle that the logarithmi-cally transformed expression ratio between two genes should be
constant if both genes are stably expressed in a given sample set. The candidate reference genes were ranked by geNorm based on the expression stability value M, which is calculated for all genes being investigated (the lower the M value, the higher the gene’s expression stability) [21].
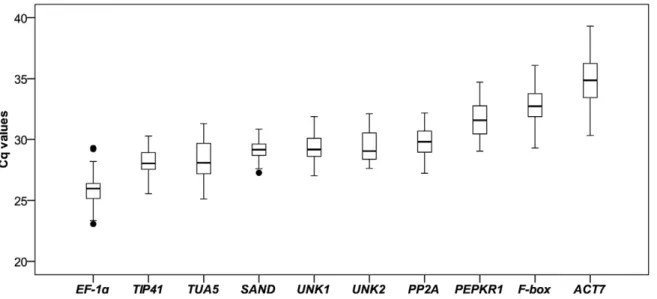
Figure 3 shows the ranking of the tested genes according to their expression stability in theC. intermediasamples, using data from six sets of treatment. When all 38 samples were analyzed together, UNK2,PP2A, andSANDwere the most stable genes, whileACT7 andEF-1awere the least stable (in order). In salt stress treatments, UNK2 and SAND were the most stable genes, while ACT7 and PEPKR1 were the least stable in the SR and SL treatments, respectively. In the PR treatment,UNK2andUNK1were the most stable genes andACT7the least; In the PL treatment,TIP41and PP2A were the most stable and F-box the least. In heat-treated leaves (HL),SANDandPP2Awere the most stable genes andACT7 was the least stably expressed. In the CL treatment, the expression
Figure 2. Distribution of relative transcript amount of the reference genes across all samples.Transcript amount are represented as percentages of the aggregated 10-transcript pool for each sample. SR (0–48 h), roots exposed to high-salt; SL (0–48 h), leaves exposed to high-salt treatment; PR (0–48 h), roots exposed to PEG treatment; PL (0–48 h), leaves exposed to PEG treatment; HL (0–48 h), leaves exposed to heat treatment; CL (0–48 h), leaves exposed to cold treatment.
Figure 1. Expression levels of candidate reference genes across all samples.Lines across the boxes depict the medians. Boxes indicate the interquartile range. Whiskers represent 95% confidence intervals, black dots represent outliers.
Figure 3. Gene expression stability and ranking of 10 reference genes as calculated by geNorm.Mean expression stability (M) was calculated following stepwise exclusion of the least stable gene across all treatment groups. The least stable genes are on the left, and the most stable on the right.
levels ofSANDandEF-1awere the most stable andUNK1was the least stable. In addition, all of the tested reference genes showed relatively high stability with M values of less than 1.5, which is below the default limit of M#1.5.
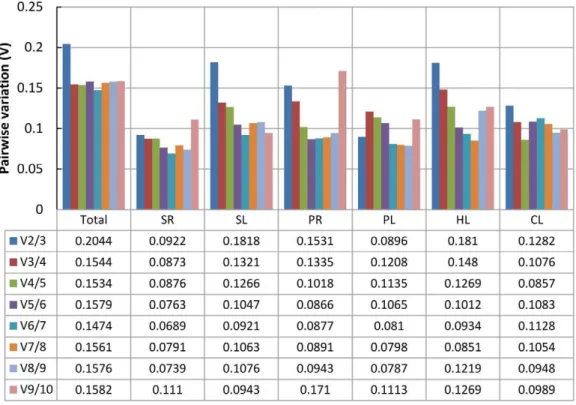
geNorm performs a stepwise calculation of the pairwise variation (Vn/Vn+1) between sequential normalization factors (NFn and NFn+1) to determine the optimal number of reference genes required for accurate normalization. A large variation means that the added gene had a significant effect and should preferably be included for calculation of a reliable normalization factor [21]. As shown in Figure 4, the inclusion of a fourth gene had no significant effect (that is, low V3/4 value) for all pooled samples or for the SL treatment, so three reference genes would be optimal for normalizing gene expression under those conditions. Similarly, two reference genes would be sufficient for the SR and PL treatments, four for the PR and CL treatments, and five for the HL treatment. In the practical application, three reference genes for the PR (V3/4= 0.1335) and HL (V3/4= 0.1480) treatments, and two for the CL treatment (V2/3= 0.1282) could also be accepted using a threshold value of 0.15 [14,21,33,34].
b) NormFinder analysis. NormFinder program is a Visual Basic application tool for Microsoft Excel used to determine the expression stabilities of reference genes that ranks all reference gene candidates based on intra- and inter-group variations and combines both results into a stability value for each candidate reference gene [35]. The results of NormFinder analysis were slightly different from those of geNorm (Table 2). Both methods of analysis ranked as most stable UNK2 and SAND in the SR treatment;UNK2,SANDandEF-1ain the SL treatment;PP2Aand TIP41 in the PL treatment; PP2A, UNK1and UNK2 in the PR treatment. However, in the CL treatment, PP2A and UNK2 emerged as the most stably expressed, whereas they were ranked
fifth and fourth, respectively, by geNorm. In the HL treatment, PP2A,UNK2andSANDwere in the top positions, while geNorm ranked UNK2in the fourth position. When evaluated across all experimental samples,UNK2, PP2A and TIP41 were in the top positions, whereasTIP41was ranked fifth by geNorm.
c) BestKeeper analysis. BestKeeper determines the most stably expressed genes based on the coefficient of correlation to the BestKeeper Index, which is the geometric mean of the candidate reference gene Cq values. BestKeeper also calculates the standard deviation (SD) and the coefficient of variation (CV) based on the Cq values of all candidate reference genes [23]. Genes with SD greater than 1 are considered unacceptable [36]. Reference genes are identified as the most stable genes, i.e. those that exhibit the lowest coefficient of variance and standard deviation (CV6SD) [37]. The results of BestKeeper analysis are shown in Table 3. In the PL and CL treatments, the same four genes were identified by both the BestKeeper and geNorm programs, although their rank order was slightly altered. In the SL treatment,UNK1emerged as the most stably expressed (ranked seventh by geNorm and NormFinder). In the SR treatment, the same three genes,UNK2, SANDand TIP41, were identified by both the BestKeeper and geNorm programs, although their rank order was slightly altered. In the HL treatment,EF-1aemerged as the most stably expressed (ranked sixth by geNorm and seventh by NormFinder). When evaluated across all experimental samples,SAND,TIP41andPP2A were in the top positions, whereas TIP41 was ranked fifth by geNorm and third by NormFinder.
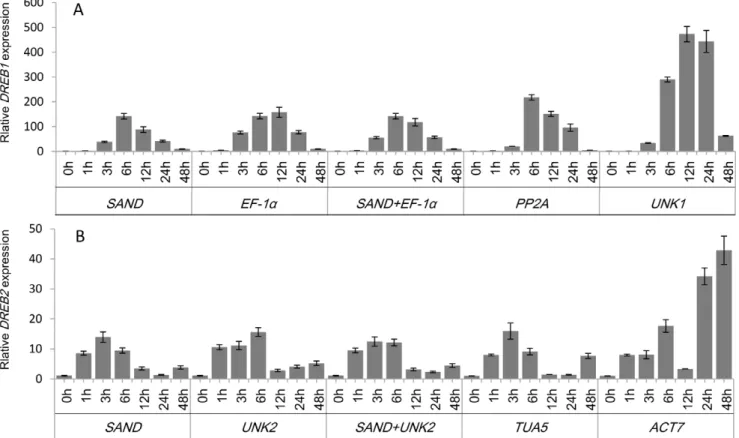
Reference Gene Validation
To validate the selection of candidate reference genes, the expression pattern ofDREB1andDREB2were analyzed using the selected reference genes (Figure 5). InA. thaliana, expression of the
DREB1 was induced by low-temperature stress, whereas expres-sion of theDREB2was induced by drought and high salinity [38]. In this study, expression of DREB1 in cold-stressed leaves and expression ofDREB2in salt-stressed roots were assessed.
When the two most stable reference genes,SANDand EF-1a were used for normalization, the expression levels of DREB1 increased sharply after 3 h of treatment, peaked at 6 h, and thereafter decreased (Figure 5A). When the least stable geneUNK1 was used for normalization, the expression patterns and transcript levels were very different. ForDREB2, when the two most stable reference genes,UNK2andSANDwere used for normalization, the transcript levels ofDREB2increased rapidly from 1 h, peaked at 3–6 h, and thereafter decreased. The expression level ofDREB2 peaked at 3 h using justSANDand at 6 h using justUNK2. Similar expression patterns were generated when the less stable reference geneTUA5was employed (Figure 5B). Normalization based on the least stable reference gene ACT7 found that the transcript level increased rapidly and peaked at 6 h, decreased between 6 and 24 h, and thereafter increased again up to 48 h, which obviously differed from normalization againstSANDandUNK2.
Discussion
In plant molecular biological research, qPCR has become an important tool for understanding gene expression in different experimental conditions. For accurate qPCR measurements, endogenous reference genes are used as internal controls. An ideal reference gene should be representative of the overall expression across all possible tissues (cells) and experimental conditions [10]. However, such a perfect reference gene is impossible and nothing close has yet been reported. This means that reference genes need to be validated under certain experimental conditions and among various species.
C. intermediais a native desert shrub that is widespread in the desert land of west and northwest China, but the application of qPCR in this species has been limited by a lack of information on reference gene stability in a variety of experimental contexts. Here, we describe the analysis of 10 candidate reference genes to improve relative quantification by qPCR for gene expression analysis in C. intermedia. Using three algorithms (geNorm, NormFinder and BestKeeper), we evaluated the expression stability of these ten genes under different abiotic (osmotic, salt,
cold and heat) stress conditions in roots and leaves. As far as can be ascertained, this is the first systematic study of the expression stability of reference genes for qPCR in C. intermedia under different abiotic stress conditions.
geNorm, NormFinder and BestKeeper are often used to select reference genes. Because they employ different strategies, they can give different results [39,40]. For example, in the SL treatment, UNK1 emerged as the most stably expressed using BestKeeper, while it was ranked seventh by geNorm and NormFinder. In the HL treatment, BestKeeper selected EF-1a as the most stably expressed gene, but it was ranked sixth by geNorm and seventh by NormFinder. Finally, in the CL treatment,SANDandEF-1awere identified as the most stably expressed by geNorm, but were ranked third and fifth, respectively, by NormFinder. We consid-ered the results of the three algorithms together when determining suitable reference genes for qPCR normalization (Table S1) [18]. In the SL treatment, the pairwise variation V3/4value (0.1321), calculated by geNorm, suggested the use ofUNK2,SANDand EF-1a for normalization. These three genes were also identified by NormFinder. BestKeeper, unlike the other two programs, ranked UNK1as most stable (ranked seventh by geNorm and NormFin-der),UNK2as second,SANDas third andEF-1aas fourth. Based on these results, we recommendedUNK2 combined with SAND andEF-1aas the best combination of stable reference genes for qPCR in the SL treatment.
In the HL treatment, the pairwise variation V3/4value (0.148) indicated that the three most stable genes (SAND, PP2A and TIP41) can be used for normalization. BestKeeper rankedEF-1a as most stable (ranked seventh by geNorm and NormFinder), TIP41as second. NormFinder, rankedPP2Aas the best reference gene andSANDandTIP41as third and sixth, respectively. Based on these results, we inferred thatSAND,PP2AandTIP41would be appropriate for qPCR in the HL treatment.
In the CL treatment, the pairwise variation V2/3value (0.1282) indicated that the two top ranked genes (SANDandEF-1a) can be used for normalization. NormFinder rankedSANDas third, and EF-1a as fifth, however, their stability values did not differ substantially from those of higher-ranked genes (e.g. 0.160 for SAND versus 0.142 for first-ranked PP2A). BestKeeper ranked SANDas most stable, and EF-1aas third, similar the results of geNorm. Altogether, we recommendedSANDandEF-1ato be the suitable reference genes for qPCR in the CL treatment. Similarly,
Table 2.Expression stability of the reference genes calculated by NormFinder software.
Rank Total SR SL PR PL HL CL
Gene Stability Gene Stability Gene Stability Gene Stability Gene Stability Gene Stability Gene Stability
1 PP2A 0.188 UNK2 0.060 UNK2 0.163 PP2A 0.157 PP2A 0.079 PP2A 0.238 PP2A 0.142
2 UNK2 0.268 SAND 0.066 SAND 0.268 UNK1 0.234 TIP41 0.200 UNK2 0.303 UNK2 0.154
3 TIP41 0.462 PP2A 0.186 EF-1a 0.283 UNK2 0.301 UNK2 0.268 SAND 0.306 SAND 0.160
4 SAND 0.465 TIP41 0.255 ACT7 0.356 F-box 0.304 UNK1 0.316 UNK1 0.326 TIP41 0.197
5 UNK1 0.514 EF-1a 0.262 PP2A 0.368 PEPKR1 0.358 SAND 0.332 PEPKR1 0.360 EF-1a 0.261 6 PEPKR1 0.531 F-box 0.348 TIP41 0.415 EF-1a 0.434 ACT7 0.353 TIP41 0.369 F-box 0.439
7 TUA5 0.700 TUA5 0.376 UNK1 0.454 TUA5 0.435 EF-1a 0.386 EF-1a 0.422 PEPKR1 0.568
8 F-box 0.898 UNK1 0.387 TUA5 0.625 SAND 0.473 PEPKR1 0.407 F-box 0.435 ACT7 0.580
9 EF-1a 0.930 PEPKR1 0.427 F-box 0.628 TIP41 0.505 TUA5 0.519 TUA5 0.797 TUA5 0.597
10 ACT7 1.078 ACT7 0.763 PEPKR1 0.639 ACT7 1.179 F-box 0.765 ACT7 0.868 UNK1 0.673
Notes: SR, roots exposed to high-salt treatment; SL, leaves exposed to high-salt treatment; PR, roots exposed to PEG treatment; PL, leaves exposed to PEG treatment; HL, leaves exposed to heat treatment; CL, leaves exposed to cold treatment.
UNK2andSANDwould be sufficient for the SR treatment,PP2A, UNK2 and UNK1for the PR treatments, and SAND, PP2Aand TIP41for the PL treatment.
In summary, UNK2, SAND and PP2A were the most stably expressed genes, while ACT7 was the most variable, over all samples.UNK2has been noted as showing stable expression across tissues and developmental stages in tomato [13], soybean [41] and aspen [42]. SANDandPP2A have been noted as showing stable expression across tissues and different abiotic and biotic stress conditions in roses [18] and buckwheat [19]. The weakness of ACT7was also seen in soybean, where its expression was found to be variable [41].
The transcript levels ofDREB2peaked at 3–6 h and then began to decline at 12 h in roots under salt stress conditions whenUNK2 and SAND were used for normalization (Figure 5B). A similar expression pattern was described under salt stress conditions in Caragana korshinskii [43], indicating that the reference genes identified in this study are suitable under such conditions. In the expression profile or transcript abundance quantification pro-duced from normalization using the least stable gene ACT7, the transcript level increased rapidly and peaked at 6 h, decreased between 6 and 24 h, and thereafter increased again up to 48 h, which obviously differed from normalization against SANDand UNK2. Obviously, ACT7 is not a suitable reference gene to normalize gene expression inC. intermediaunder such conditions. These results indicate that the incorrect use of reference genes without validation may reduce precision or produce misleading results.
Conclusions
To our knowledge, this study is the first systematic analysis for the selection of superior reference genes for qPCR inC. intermedia under different abiotic (osmotic, salt, cold and heat) stress conditions. Analysis of expression stability using geNorm, NormFinder and BestKeeper revealed that UNK2, PP2A and SANDcould be considered to be appropriate reference genes for gene expression analysis of different tissues under different abiotic stress conditions, whereas ACT7, PEPKR1 and F-box showed relatively low expression stability. This work will benefit future studies on gene expression under different abiotic stress conditions inC. intermediaand other species of the leguminous genusCaragana.
Materials and Methods
Plant Materials and Treatments
Seeds ofC. intermediawere collected from the Experimental Base (Hohhot, Inner Mongolia, China), Research Institute of Forestry, Chinese Academy of Forestry. Seeds were washed three times with tap water, and then sown in plastic pots filled with peat soil in a growth chamber with a 16 h light/8 h dark photoperiod at 25/ 22uC day/night temperatures and relative humidity 80%. For salt and osmotic stress treatments, three-week-old seedlings were carefully removed from the soil to avoid injury, their roots were washed cleanly with tap water, and they were placed in NaCl (200 mM) or PEG6000 (15%) solutions, respectively, for 0, 1, 3, 6, 12, 24, or 48 h in the growth chamber. For the cold and heat stress treatments, the seedlings in pots were grown at 4uC or 42uC, respectively, for 0, 1, 3, 6, 12, 24, or 48 h.
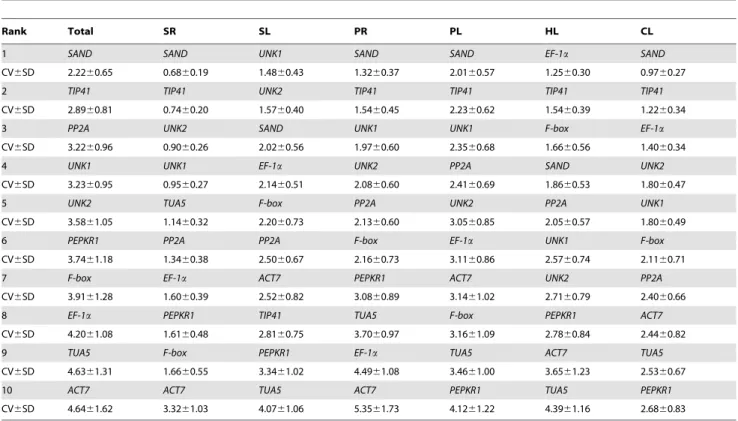
Table 3.Expression stability of the reference genes calculated by BestKeeper software.
Rank Total SR SL PR PL HL CL
1 SAND SAND UNK1 SAND SAND EF-1a SAND
CV6SD 2.2260.65 0.6860.19 1.4860.43 1.3260.37 2.0160.57 1.2560.30 0.9760.27
2 TIP41 TIP41 UNK2 TIP41 TIP41 TIP41 TIP41
CV6SD 2.8960.81 0.7460.20 1.5760.40 1.5460.45 2.2360.62 1.5460.39 1.2260.34
3 PP2A UNK2 SAND UNK1 UNK1 F-box EF-1a
CV6SD 3.2260.96 0.9060.26 2.0260.56 1.9760.60 2.3560.68 1.6660.56 1.4060.34
4 UNK1 UNK1 EF-1a UNK2 PP2A SAND UNK2
CV6SD 3.2360.95 0.9560.27 2.1460.51 2.0860.60 2.4160.69 1.8660.53 1.8060.47
5 UNK2 TUA5 F-box PP2A UNK2 PP2A UNK1
CV6SD 3.5861.05 1.1460.32 2.2060.73 2.1360.60 3.0560.85 2.0560.57 1.8060.49
6 PEPKR1 PP2A PP2A F-box EF-1a UNK1 F-box
CV6SD 3.7461.18 1.3460.38 2.5060.67 2.1660.73 3.1160.86 2.5760.74 2.1160.71
7 F-box EF-1a ACT7 PEPKR1 ACT7 UNK2 PP2A
CV6SD 3.9161.28 1.6060.39 2.5260.82 3.0860.89 3.1461.02 2.7160.79 2.4060.66
8 EF-1a PEPKR1 TIP41 TUA5 F-box PEPKR1 ACT7
CV6SD 4.2061.08 1.6160.48 2.8160.75 3.7060.97 3.1661.09 2.7860.84 2.4460.82
9 TUA5 F-box PEPKR1 EF-1a TUA5 ACT7 TUA5
CV6SD 4.6361.31 1.6660.55 3.3461.02 4.4961.08 3.4661.00 3.6561.23 2.5360.67
10 ACT7 ACT7 TUA5 ACT7 PEPKR1 TUA5 PEPKR1
CV6SD 4.6461.62 3.3261.03 4.0761.06 5.3561.73 4.1261.22 4.3961.16 2.6860.83
Notes: SR, roots exposed to high-salt treatment; SL, leaves exposed to high-salt treatment; PR, roots exposed to PEG treatment; PL, leaves exposed to PEG treatment; HL, leaves exposed to heat treatment; CL, leaves exposed to cold treatment. Descriptive statistics of 10 candidate genes based on the coefficient of variance (CV) and standard deviation (SD) of their Cq values were determined using the whole data set. Reference genes were identified as the most stable genes, i.e. those with the lowest coefficient of variance and standard deviation (CV6SD).
Leaves were collected from the three-week-old seedlings subjected to all four treatments, and roots were collected from the seedlings subjected to salt and osmotic stress treatments. These were immediately frozen in liquid nitrogen and stored at280uC. Samples above were collected from 3 seedlings to give 3 replicas.
Total RNA Isolation and cDNA Synthesis
Total RNA was extracted from treated tissues using Trizol reagent (Invitrogen, USA) according to the manufacturer’s instructions. The remaining DNA was removed by RNase-free DNase according to the manufacturer’s instructions (Promega, USA). Total RNA concentration and purity was determined using a Nanodrop ND-1000 spectrophotometer (Nanodrop Technolo-gies, USA). RNA samples with an absorbance ratio at OD260/ 280 between 1.9 and 2.2 and OD260/230 <2.0 were used for further analysis. RNA integrity was verified by 1.5% agarose gel electrophoresis. Samples with 28S/18S ribosomal RNA between 1.5 and 2.0 and without smears on the agarose gel were used for subsequent experiments.
For each sample, 1mg of total RNA was reverse transcribed using the RevertAidTM First Strand cDNA Synthesis Kit (Fermentas, Germany) in a 20ml reaction using oligo dT primers according to manufacturer’s instructions. The cDNAs were diluted 1:30 with nuclease-free water prior to the qPCR analyses.
Selection of Candidate Reference Genes
Potential homologues of the ten published reference genes were identified from the transcriptome data sequences ofC. intermedia seedlings (unpublished data) (Table 1).
The candidate reference genes comprisedACT7(actin 7),EF-1a (elongation factor -1a), TUA5 (alpha tubulin), PP2A (protein phosphatase2A),SAND(SAND-family protein),TIP41(TIP41-like protein), F-box (F-box/kelch-repeat protein), PEPKR1 (phospho-enolpyruvate carboxylase-related kinase 1), UNK1 (hypothetical protein) andUNK2(hypothetical protein), which were previously shown to have highly stable expression levels by microarray analysis inA. thalianaand soybean [16,17].
PCR Primer Design and Test of Amplification Efficiency Primers were designed using the Primer Premier 5 software (http://www.PremierBiosoft.com/primerdesign/primerdesign. html) with melting temperatures 58–62uC, primer lengths 20– 24 bp, GC content 45–55% and amplicon lengths 50–230 bp (Table 1, Table S2 and Figure S1). For each primer pair, amplification efficiency estimates were derived from a standard curve generated from a serial dilution of pooled cDNA (1, 10, 102, 103, 104, 1056dilutions; each gene in triplicate) (Figure S2). Mean quantification cycle (Cq) values of each ten-fold dilution were plotted against the logarithm of the pooled cDNA dilution factor. Efficiency (E) for each gene was determined with the slope of a linear regression model [44] using the Cq values and the following equation was used:
E~½10(1={slope){1|100%:
Quantitative Real-time RT-PCR
qPCR reactions were carried out with an ABI Prism 7700 Sequence Detection System (Applied Biosystems, USA), using SYBRH Premix Ex TaqTM (Takara, Japan) in a 20ml reaction volume (containing 2ml diluted cDNA, 10ml 26SYBR Premix Ex TaqTM, 0.4ml ROX Reference Dye, and 0.4ml each primer). The reaction conditions were: an initial denaturation step of 95uC/30 s, followed by 40 cycles of 95uC/5 s and 60uC/30 s. The dissociation curve was obtained by heating the amplicon from 60 to 95uC (Figure S3). All qPCR reactions were carried out in biological and technical triplicate. A non-template control was also included in each run for each gene. The final quantification cycle (Cq) values were the means of nine values (biological triplicate, each in technical triplicate).
Statistical Analysis
Three different types of Microsoft Excel-based software, geNorm [45], NormFinder [46] and BestKeeper [47], were used to rank the expression stability of reference genes across all of the experimental sets. Following qPCR data collection, Cq values were converted to relative quantities using the formula: 22DCq, in whichDCq = each corresponding Cq value2minimum Cq value. The sample with the maximum expression level (the minimum Cq value) was used as a calibrator and was set to a value of 1. Relative quantities were used for geNorm and NormFinder, while Best-Keeper analyses were based on untransformed Cq values. All three software packages were used according to the manufacturer’s instructions. All other multiple comparisons were performed with SPSS17.0.
Supporting Information
Figure S1 qPCR amplification specificity of the 10 reference genes, and DREB1 and DREB2. Amplification fragments were separated by 2% agarose gel electrophoresis. (PDF)
Figure S2 Amplification efficiencies of the 10 reference genes, andDREB1andDREB2.
(PDF)
Figure S3 Melting curves of the 10 reference genes, and DERB1andDREB2.
(PDF)
Table S1 The ranking of 10 reference genes by geNorm, NormFinder, and Bestkeeper.
(DOC)
Table S2 List of amplified sequences of the 10 reference genes, andDREB1andDREB2.
(DOC)
Acknowledgments
We are very grateful to Prof. Qing-Yin Zeng (State Key Laboratory of Systematic and Evolutionary Botany, Institute of Botany, Chinese Academy of Sciences, Beijing, China) for good suggestions and careful proofreading of the manuscript, and Prof. Xinmin Li (Department of Pathology and Laboratory Medicine, University of California at Los Angeles, USA) for thoughtful suggestions and critical comments, and Dr. Tao Wu (Yunnan Academy of Forestry, Kunming, Yunnan, China) for suggestions and help with statistical analysis. We are also grateful to the Inner Mongolia Academy of Forestry Science for the help in collecting experimental materials.
Author Contributions
Conceived and designed the experiments: LQ JZ. Performed the experiments: JZ LZ. Analyzed the data: JZ LZ. Contributed reagents/ materials/analysis tools: WL SH WY. Wrote the paper: JZ.
References
1. Ohdan T, Francisco PB Jr, Sawada T, Hirose T, Terao T, et al. (2005) Expression profiling of genes involved in starch synthesis in sink and source organs of rice. J Exp Bot 56: 3229–3244.
2. Vaucheret H, Vazquez F, Crete P, Bartel DP (2004) The action of
ARGONAUTE1 in the miRNA pathway and its regulation by the miRNA pathway are crucial for plant development. Genes Dev 18: 1187–1197. 3. Koo SC, Bracko O, Park MS, Schwab R, Chun HJ, et al. (2010) Control of
lateral organ development and flowering time by theArabidopsis thaliana MADS-box GeneAGAMOUS-LIKE6. Plant J 62: 807–816.
4. Qiu JL, Fiil BK, Petersen K, Nielsen HB, Botanga CJ, et al. (2008)Arabidopsis
MAP kinase 4 regulates gene expression through transcription factor release in the nucleus. EMBO J 27: 2214–2221.
5. Huang J, Gu M, Lai Z, Fan B, Shi K, et al. (2010) Functional analysis of the
Arabidopsis PALgene family in plant growth, development, and response to environmental stress. Plant Physiology 153: 1526–1538.
6. Portieles R, Ayra C, Gonzalez E, Gallo A, Rodriguez R, et al. (2010)NmDef02, a novel antimicrobial gene isolated from Nicotiana megalosiphon confers high-level pathogen resistance under greenhouse and field conditions. Plant Biotechnol J 8: 678–690.
7. Ren X, Chen Z, Liu Y, Zhang H, Zhang M, et al. (2010) ABO3, a WRKY transcription factor, mediates plant responses to abscisic acid and drought tolerance inArabidopsis. Plant J 63: 417–429.
8. Mahoney DJ, Carey K, Fu MH, Snow R, Cameron-Smith D, et al. (2004) Real-time RT-PCR analysis of housekeeping genes in human skeletal muscle following acute exercise. Physiol Genomics 18: 226–231.
9. Bustin SA, Benes V, Garson JA, Hellemans J, Huggett J, et al. (2009) The MIQE guidelines: minimum information for publication of quantitative real-time PCR experiments. Clin Chem 55: 611–622.
10. Guenin S, Mauriat M, Pelloux J, Van Wuytswinkel O, Bellini C, et al. (2009) Normalization of qRT-PCR data: the necessity of adopting a systematic, experimental conditions-specific, validation of references. J Exp Bot 60: 487–
11. Radonic A, Thulke S, Mackay IM, Landt O, Siegert W, et al. (2004) Guideline to reference gene selection for quantitative real-time PCR. Biochem Biophys Res Commun 313: 856–862.
12. Nicot N, Hausman JF, Hoffmann L, Evers D (2005) Housekeeping gene selection for real-time RT-PCR normalization in potato during biotic and abiotic stress. J Exp Bot 56: 2907–2914.
13. Exposito-Rodriguez M, Borges AA, Borges-Perez A, Perez JA (2008) Selection of internal control genes for quantitative real-time RT-PCR studies during tomato development process. BMC Plant Biol 8: 131.
14. Jain M, Nijhawan A, Tyagi AK, Khurana JP (2006) Validation of housekeeping genes as internal control for studying gene expression in rice by quantitative real-time PCR. Biochem Biophys Res Commun 345: 646–651.
15. Jian B, Liu B, Bi Y, Hou W, Wu C, et al. (2008) Validation of internal control for gene expression study in soybean by quantitative real-time PCR. BMC Mol Biol 9: 59.
16. Czechowski T, Stitt M, Altmann T, Udvardi MK, Scheible WR (2005) Genome-wide identification and testing of superior reference genes for transcript normalization inArabidopsis. Plant Physiol 139: 5–17.
17. Libault M, Thibivilliers S, Bilgin D, Radwan O, Benitez M, et al. (2008) Identification of four soybean reference genes for gene expression normalization. Plant Genome 1: 44–54.
18. Klie M, Debener T (2011) Identification of superior reference genes for data normalisation of expression studies via quantitative PCR in hybrid roses (Rosa hybrida). BMC Res Notes 4: 518.
19. Demidenko NV, Logacheva MD, Penin AA (2011) Selection and validation of reference genes for quantitative real-time PCR in buckwheat (Fagopyrum esculentum) based on transcriptome sequence data. PLoS One 6: e19434. 20. Chi X, Hu R, Yang Q, Zhang X, Pan L, et al. (2012) Validation of reference
genes for gene expression studies in peanut by quantitative real-time RT-PCR. Mol Genet Genomics 287: 167–176.
22. Andersen CL, Jensen JL, Orntoft TF (2004) Normalization of real-time quantitative reverse transcription-PCR data: a model-based variance estimation approach to identify genes suited for normalization, applied to bladder and colon cancer data sets. Cancer Res 64: 5245–5250.
23. Pfaffl MW, Tichopad A, Prgomet C, Neuvians TP (2004) Determination of stable housekeeping genes, differentially regulated target genes and sample integrity: BestKeeper–Excel-based tool using pair-wise correlations. Biotechnol Lett 26: 509–515.
24. Kim BR, Nam HY, Kim SU, Kim SI, Chang YJ (2003) Normalization of reverse transcription quantitative-PCR with housekeeping genes in rice. Biotechnol Lett 25: 1869–1872.
25. Brunner AM, Yakovlev IA, Strauss SH (2004) Validating internal controls for quantitative plant gene expression studies. BMC Plant Biol 4: 14.
26. Paolacci AR, Tanzarella OA, Porceddu E, Ciaffi M (2009) Identification and validation of reference genes for quantitative RT-PCR normalization in wheat. BMC Mol Biol 10: 11.
27. Faccioli P, Ciceri GP, Provero P, Stanca AM, Morcia C, et al. (2007) A combined strategy of ‘‘in silico’’ transcriptome analysis and web search engine optimization allows an agile identification of reference genes suitable for normalization in gene expression studies. Plant Mol Biol 63: 679–688. 28. Coito JL, Rocheta M, Carvalho L, Amaˆncio S (2012) Microarray-based
uncovering reference genes for quantitative real time PCR in grapevine under abiotic stress. BMC Res Notes 5: 220.
29. Kakar K, Wandrey M, Czechowski T, Gaertner T, Scheible WR, et al. (2008) A community resource for high-throughput quantitative RT-PCR analysis of transcription factor gene expression inMedicago truncatula. Plant Methods 4: 18. 30. Xu ZZ, Zhou GS, Wang YH (2007) Combined effects of elevated CO2and soil
drought on carbon and nitrogen allocation of the desert shrubCaragana intermedia. Plant and Soil 301: 87–97.
31. Guo WH, Li B, Zhang XS, Wang RQ (2010) Effects of water stress on water use efficiency and water balance components ofHippophae rhamnoidesandCaragana intermediain the soil-plant-atmosphere continuum. Agroforest Syst 80: 423–435. 32. Shi SQ, Shi Z, Jiang ZP, Qi LW, Sun XM, et al. (2010) Effects of exogenous GABA on gene expression of Caragana intermedia roots under NaCl stress: regulatory roles for H2O2and ethylene production. Plant Cell Environ 33: 149–
162.
33. Condori J, Nopo-Olazabal C, Medrano G, Medina-Bolivar F (2011) Selection of reference genes for qPCR in hairy root cultures of peanut. BMC Res Notes 4: 392.
34. Perez R, Tupac-Yupanqui I, Dunner S (2008) Evaluation of suitable reference genes for gene expression studies in bovine muscular tissue. BMC Mol Biol 9: 79.
35. Zhong HY, Chen JW, Li CQ, Chen L, Wu JY, et al. (2011) Selection of reliable reference genes for expression studies by reverse transcription quantitative real-time PCR in litchi under different experimental conditions. Plant Cell Rep 30: 641–653.
36. Migocka M, Papierniak A (2010) Identification of suitable reference genes for studying gene expression in cucumber plants subjected to abiotic stress and growth regulators. Mol Breeding 28: 343–357.
37. Chang E, Shi S, Liu J, Cheng T, Xue L, et al. (2012) Selection of reference genes for quantitative gene expression studies inPlatycladus orientalis (Cupressaceae) Using real-time PCR. PLoS One 7: e33278.
38. Liu Q, Kasuga M, Sakuma Y, Abe H, Miura S, et al. (1998) Two transcription factors, DREB1and DREB2, with an EREBP/AP2 DNA binding domain separate two cellular signal transduction pathways in drought- and low-temperature-responsive gene expression, respectively, inArabidopsis. Plant Cell 10: 1391–1406.
39. Mallona I, Lischewski S, Weiss J, Hause B, Egea-Cortines M (2010) Validation of reference genes for quantitative real-time PCR during leaf and flower development inPetunia hybrida. BMC Plant Biol 10: 4.
40. Mafra V, Kubo KS, Alves-Ferreira M, Ribeiro-Alves M, Stuart RM, et al. (2012) Reference genes for accurate transcript normalization in citrus genotypes under different experimental conditions. PLoS One 7: e31263.
41. Hu R, Fan C, Li H, Zhang Q, Fu YF (2009) Evaluation of putative reference genes for gene expression normalization in soybean by quantitative real-time RT-PCR. BMC Mol Biol 10: 93.
42. Gutierrez L, Mauriat M, Guenin S, Pelloux J, Lefebvre JF, et al. (2008) The lack of a systematic validation of reference genes: a serious pitfall undervalued in reverse transcription-polymerase chain reaction (RT-PCR) analysis in plants. Plant Biotechnol J 6: 609–618.
43. Wang X, Chen X, Liu Y, Gao H, Wang Z, et al. (2011)CkDREBgene in
Caragana korshinskiiis involved in the regulation of stress response to multiple abiotic stresses as an AP2/EREBP transcription factor. Mol Biol Rep 38: 2801– 2811.
44. Pfaffl MW (2001) A new mathematical model for relative quantification in real-time RT-PCR. Nucleic Acids Res 29: e45.
45. geNorm software website. Available: http://medgen.ugent.be/jvdesomp/ geNorm. Accessed 2011 Dec, 13.
46. NormFi nd er softwar e we bsite . Available: h ttp ://www.md l.d k/ publicationsnormfinder.htm. Accessed 2011 Dec, 13.