Work, Study, Both or Neither?
Time Allocation of Brazilian Teenagers
Maria Carolina da Silva Leme Simone Wajnman Fundação Getulio Vargas São Paulo Cedeplar-UFMG [email protected] [email protected]
Abstract
Labor force participation among youth is extremely high in Brazil when compared to countries with a similar economic background. In Argentina and Chile labor force participation, among those with 10 to 14 years old, is around 1% while in Brazil this rate is as high as 17 %. For the those between 15 and 19 years old these figures are around 10% in Chile, 15% in Argentina and 53% in Brazil. On the other hand the data on school attendance give a more optimistic picture. The percentage of children, between 10 and 14 years old, enrolled in school increased steadily from 79% to 95% from 1981 to 1998 and with age between 15 and 19, from 46% to 66% in the same period. These figures are close to the ones presented by Chile and Argentina. around 99% among the youngest group and around 70% for the 15 to 19 years old group. The objective of the paper is to understand the determinants of the time allocation decision of the Brazilian youth during the last twenty years. Using a multinomial logit regression we investigate the conditional effect of various micro and macro variables on the time allocation decision for the 1991 to 1998 period. Our main findings are: working and studying became the most likely allocation among the youngest in the poor rural areas and, in general, to study, whether working or not, became less dependent on family background for the youngest group but not for the older.
1. Introduction
Several studies that investigate the causes of poverty and income inequality in Brazil attempt to evaluate the weight of demographic, economic, and social variables on individual income. In general, education that reflects human capital accumulation and inequality in the distribution of educational opportunities are identified as the most important variables explaining Brazilian poor performance (see Barros and Mendonça, 19951).
Education can be seen to be the result of family decision-making on the time allocation of it youngest members and their crucial choices (not mutually exclusive) of working and/or studying as they become old enough to enter the job market. As discussed in Barros, Mendonça e Velazco (1994) those decisions are made in order to maximize the family’s welfare, subject to their budget constraints. They interact with the consumption and investment opportunities available to each generation, and they depend on the incentives and restrictions offered by the macro-economic environment. Those choices have a direct impact on family gains in the short run, but since they are also decisions on the human capital investment of their offspring, they affect the next generation’s income as well.
In empirical terms, however, the studies are more partial, sometimes investigating the possible deleterious effects of working on the human capital accumulation of the children, sometimes investigating the effects of several micro- and macro- variables that affect education. For instance, Barros et al (1999) analyze the family decision on time allocation between working or not, without taking into account the decision of studying or not. On the other hand, Behman, Dureya, and Szekely (1999) investigate the role of family and macro- and social variables on school attendance. In this paper, we attempt to analyze these choices as a whole, trying to identify the determinants of time allocation decisions among four possibilities: i) only work, ii) Only study, iii) doing both, work and study, and iv) doing Neither; taking into account the simultaneity of the relation between school attendance and teenager work in Brazil.
2. Recent empirical evidence
The participation of the teenage labor force in Brazil is very high when compared to other countries with a similar economic background. The relative position of Brazil in Latin America can be seen in Figures 1.a and 1.b. Argentina and Chile, countries with a per capita income similar to Brazil, have a participation rate of 1% for those between the ages of 10 and 14 years, while in Brazil this rate is 17%. The figures are higher for those between 15 and 19 years of age: 53% in Brazil compared to 10% in Chile and 15% in
1
Argentina. Brazil also has one of the highest proportions of young people who work and study at the same time.
FIGURE 1.a FIGURE 1.b
Source: Menezes et al (2000)
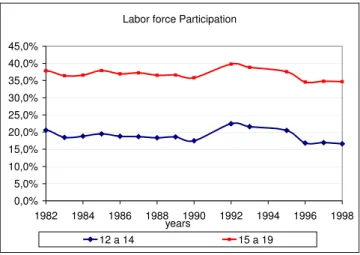
Figure 2 shows the evolution through the years of labor force participation for both age groups. It changed very little in the 1981/98 period: from 16,6% in 1998 to 22,4% in 1992 for those between the ages of 12 and 14 years, and from 34,6% in 1996 to 39,8% in 1992 for those in the 15 to 19 year old age group. On the other hand, in the last three years, those rates have stabilized at their lowest levels. Overall, those are very pessimistic results, but fortunately they don’t tell the whole story.
FIGURE 2
Labor force Participation
0,0% 5,0% 10,0% 15,0% 20,0% 25,0% 30,0% 35,0% 40,0% 45,0%
1982 1984 1986 1988 1990 1992 1994 1996 1998 years
12 a 14 15 a 19
FIGURE 3 FIGURE 4
School Attendance by Age
0 0,1 0,2 0,3 0,4 0,5 0,6 0,7 0,8 0,9 1
1982 1984 1986 1988 1990 1992 1994 1996 1998
year %
10 to 14 years 15 to 19 years
Crescimento na Frequência a Escola 1998-1981 (pontos percentuais)
0.00 0.05 0.10 0.15 0.20 0.25 0.30
12 13 14 15 16 17 18 19
Idade %
The mixed results presented above can be better understood by separating the decisions into the four groups: those who only worked, those who only studied, those who did both, and those who did neither. For children 10 to 14 years old (Figure 4.1), the percentage of those who only studied increased from 70% to 80%, but the percentage of those who worked and studied also increased from 9% to 15%. In the 15 to 19 year old group, the proportion of those who only studied increased less, from 30 to 36%, but of those who did both, which is the most likely time allocation for this age, the rate increased from 16% to 30%. Therefore in both age groups, the decline was in the allocation of doing neither and only working, but it was greater for the younger group.
FIGURE 4.1 FIGURE 4.2
studying increases from 28% to 43%, due mainly to an increase in the category work and study and a decline in only work, which still shows a very high figure of almost 40%. In the 10th decile, there is an increase in the category only study from 55% to 65%, and also in work and study from 18% to 24%.
FIGURE 5.1 FIGURE 5.2
FIGURE 5.3 FIGURE 5.4
FIGURE 6.1 FIGURE 6.2 Alocação de Tempo por Decil de Renda Familiar per capita -
Pessoas de 10 a 14 anos - Brasil - Pnad 1996
0.60 0.64
0.71 0.73
0.78 0.81 0.85 0.87
0.90 0.93 0.23 0.19 0.16 0.15 0.13 0.12 0.10 0.09 0.07 0.06 0.07 0.08 0.04 0.04 0.03 0.03
0.02 0.01 0.01 0.00 0.10 0.10 0.09 0.07 0.06 0.04 0.03 0.03
0.02 0.01 0.00 0.10 0.20 0.30 0.40 0.50 0.60 0.70 0.80 0.90 1.00
1º decil 2º decil 3º decil 4º decil 5º decil 6º decil 7º decil 8º decil 9º decil 10º decil
Apenas estuda Trabalha e estuda Apenas trabalha Não trabalha / Não estuda
Alocação de Tempo por Decil de Renda Familiar per capita - Pessoas de 15 a 19 anos - Brasil - Pnad 1996
0.23 0.26 0.28 0.32 0.31
0.35 0.39 0.45 0.63 0.20 0.24 0.24 0.23 0.26 0.28 0.28 0.29 0.29 0.24 0.44
0.36 0.33 0.33
0.28 0.28 0.26
0.22 0.18
0.08 0.18 0.16 0.17 0.16 0.15 0.12 0.11 0.10 0.08 0.05
0.18 0.00 0.10 0.20 0.30 0.40 0.50 0.60 0.70 0.80 0.90 1.00
1º decil 2º decil 3º decil 4º decil 5º decil 6º decil 7º decil 8º decil 9º decil 10º decil
Apenas estuda Trabalha e estuda Apenas trabalha Não trabalha / Não estuda
3. Determining the factors of time allocation decisions
The time allocation decision model considers that family i=1,2....N makes the choice j=0, 1, 2 3 determined by the regressors p=1, P. Therefore we have a linear predictor for family i, Xiβj and the probability that family i chooses allocation j is given by
å
= + = = j k k j i ij i X X P j Y 0 ) exp( 1 ) exp( ) Pr( β β (1)The estimation equation gives a set of probabilities for the J+1 choices for the individual/family with characteristics Xi.
å
= + = = j k k j j X X P j Y 0 ) exp( 1 ) exp( ) Pr( β β (2)The coefficients of this model are based on hard interpretation, but by differentiating (2) we get the marginal effect of attribute j in the probability:
] [β −β
= ∂ ∂ j j i j P X P (3)
where Pˆjis computed for each family using the regressors’ values. To compute the marginal effect of the regressor Xp, we fixed the other variables in their values and imputed
several values for Xp from the sample. Those computations allow us to determine the
probability of each choice associated to each variable conditioned on the others.
To estimate this multinomial logit model, data was used from Brazilian Household Surveys (PNADS) from 1981 to 1998. For each individual, the following information was collected for people between 10 and 19 years of age. The following allocations were defined:
Allocations:
0 = the person is not studying and is not in the labor force 1 = the person is studying and is not in the labor force 2 = the person is not studying and is in the labor force 3 = the person is studying and is in the labor force
Regressors:
- Sex = 1 if male = 0 if female
- Age
- Urban = 1 if living in an urban area = 0 if living in a rural area
- Head of family’s occupation = 1 if self-employed or an employer
= 0 if otherwise
This variable was included to verify the importance of available work in the family business.
- Number of children = number of children less than 8 years old This variable was included to capture home labor.
- Number of adults = number of members in the family more than 8 years old - Parents’ education
- Family income = net of the salary of the young
This is to capture the financial constraint for human capital investment.
4. Results of the model for all ages estimated for 1981 and 1996.
Before presenting the results of the estimation, we show the unconditional probabilities of each allocation, for all ages, in 1981 and 1996:
Unconditional Distribution
Allocations 1981 1996
Not Working / Not Studying 13,3 9,0 Not Working / Studying 50,3 56,4 Working / Not Studying 24,3 15,2
Working / Studying 12,2 19,4
in 1996 when studying/working took its place. Not working/not studying, in the third position in 1981, dropped to the last position in 1996.
The probabilities computed with the results from the multinomial logit estimates presented in the graphics, were the following:
a) Sex – In 1981 as well as in 1996, the most likely allocation for women was only study. For men, in 1981, the probabilities of studying without working and working without studying were close. In 1996 the probability of only study became the highest. For women, an important difference between 1981 and 1996 was the reduction of not working and not studying that probably reflected work at home. For men, it was the change of position of not studying and working, the highest in 1981, with working and studying, that increased in 1996. In general, we can say that the differences between genders declined in the period.
FIGURE 7.1 FIGURE 7.2
Probabilities Related to Sex , 1981, Age 12-19
0,00 0,10 0,20 0,30 0,40 0,50 0,60 0,70 0,80 0,90 1,00
Female Male Es
tim at ed Pr ob ab ilit y
not working / not studying not working / studying
working / not studying working / studying
Probabilities Related to Sex , 1996, Age 12-19
0,00 0,10 0,20 0,30 0,40 0,50 0,60 0,70 0,80 0,90 1,00
Female Male
Estimated Probability
not working / not studying not working / studying working / not studying working / studying
b) Age – The probability of studying and not working strongly declined with age and increased its opposite: working and not studying. On the other hand, age had a minor role in the probability of not studying and not working, as well as in working and studying. These results are observed in both years, but mainly in 1981. Age also lessened the probability for all ages of working without studying, and increased doing both between the two years. It is interesting to note that only study was no longer the most likely allocation for ages higher than 15 in 1981, and that this cut off age increased to 18 in 1986, becoming less likely than working and studying.
FIGURE 8.1 FIGURE 8.2
Probabilities Related to Age , 1981, Age 12-19
0,00 0,10 0,20 0,30 0,40 0,50 0,60 0,70 0,80 0,90 1,00
12 13 14 Age15 16 17 18 19
Estimated Probability
not working / not studying not working / studying working / not studying working / studying
Probabilities Related to Age , 1996, Age 12-19
0,00 0,10 0,20 0,30 0,40 0,50 0,60 0,70 0,80 0,90 1,00
12 13 14 15Age16 17 18 19
Estimated Probability
c) Urban – In 1981, to live in a city implied in higher probability of studying, working or not, while in the rural area, the chances of only work or only study were high and similar. Between 1981 and 1996, the differences in allocations between rural and urban areas declined significantly for all allocations, and working and studying that was higher in urban areas in 1981 increased and became equal in both by 1996.
FIGURE 9.1 FIGURE 9.2
Probabilities Related to Urban , 1981, Age 12-19
0,00 0,10 0,20 0,30 0,40 0,50 0,60 0,70 0,80 0,90 1,00
Not Urban Urban
Estimated Probability
not working / not studying not working / studying working / not studying working / studying
Probabilities Related to Urban , 1996, Age 12-19
0,00 0,10 0,20 0,30 0,40 0,50 0,60 0,70 0,80 0,90 1,00
Not Urban Urban Es
tim at ed Pr ob abi lity
not working / not studying not working / studying working / not studying working / studying
d) Head of family’s occupation – In both years, the head of family’s occupation did not seem to make a big difference in time allocation, since the figures were very close to each other. In any case, there were the same differences between the two years: not working and studying was higher among families where the head was self employed or an employer in 1981, and became higher in 1996; working and studying that had the same probability in 1981, became higher for those families in 1996.
FIGURE 10.1 FIGURE 10.2
Probabilities Related to Ocup , 1981, Age 12-19
0,00 0,10 0,20 0,30 0,40 0,50 0,60 0,70 0,80 0,90 1,00
Others Employer / Self-Employed
Estimated Probability
not working / not studying not working / studying working / not studying working / studying
Probabilities Related to Ocup , 1996, Age 12-19
0,00 0,10 0,20 0,30 0,40 0,50 0,60 0,70 0,80 0,90 1,00
Others Employer / Self-Employed
Estimated Probability
not working / not studying not working / studying working / not studying working / studying
FIGURE 11.1 FIGURE 11.2
Probabilities Related to Nchild, 1981, Age 12-19
0,00 0,10 0,20 0,30 0,40 0,50 0,60 0,70 0,80 0,90 1,00
0 1 2 3Nchild4 5 6 7
Estimated Probability
not working / not studying not working / studying working / not studying working / studying
Probabilities Related to Nchild, 1996, Age 12-19
0,00 0,10 0,20 0,30 0,40 0,50 0,60 0,70 0,80 0,90 1,00
0 1 2 3Nchild4 5 6 7
Estimated Probability
not working / not studying not working / studying working / not studying working / studying
f) Number of adults – The number of members above 8 years old has a less clear effect and is harder to understand. In 1981, it increased the probability of working, but in 1996 increased the probability of studying without working.
FIGURE 12.1 FIGURE 12.2 Probabilities Related to Nadults, 1981, Age 12-19
0,00 0,10 0,20 0,30 0,40 0,50 0,60 0,70 0,80 0,90 1,00
1 2 3 4 5 6 7 8 9 10 11 12 13 14 15 16 17 18 19 20Nadults
Es ti m at ed Pr ob ab ilit
not working / not studying not working / studying
working / not studying working / studying
Probabilities Related to Nadults, 1996, Age 12-19
0,00 0,10 0,20 0,30 0,40 0,50 0,60 0,70 0,80 0,90 1,00
1 2 3 4 5 6 7 8 9 10 11 12 13 14 15 16 17 18 19 20Nadults
Estimated Probability
not working / not studying not working / studying working / not studying working / studying
g) Parents’ education – The more educated the parents, the higher the probability of studying and the lower the probability of the other allocations. In both years the behavior was very similar, but in 1996 for any level of the parents’ education, there was an increase in the probability of only study and decline of only work.
FIGURE 13.1 FIGURE 13.2
Probabilities Related to Educpar, 1981, Age 12-19
0,00 0,10 0,20 0,30 0,40 0,50 0,60 0,70 0,80 0,90 1,00
0 1 2 3 4 5 6 7 8 9 years of educ.
Estimated Probability
not working / not studying not working / studying working / not studying working / studying
Probabilities Related to Educpar, 1996, Age 12-19
0,00 0,10 0,20 0,30 0,40 0,50 0,60 0,70 0,80 0,90 1,00
0 1 2 3 years of educ4 5 6 7 8 9
Estimated Probability
h) Family Income – This variable also has the expected effect: positively on the probability of studying mainly without working, and negatively on the probability of only working and doing neither. There was almost no change between the two periods.
FIGURE 14.1 FIGURE 14.2
Probabilities Related to Fincome, 1981, Age 12-19
0,00 0,10 0,20 0,30 0,40 0,50 0,60 0,70 0,80 0,90 1,00
0 5 10 15 20 25 30 35 40 45 50 55 60 65 70 75 80 85 90 95income Es
tim at ed Pr ob ab ilit y
not working / not studying not working / studying working / not studying working / studying
Probabilities Related to Fincome, 1996, Age 12-19
0,00 0,10 0,20 0,30 0,40 0,50 0,60 0,70 0,80 0,90 1,00
0 5 10 15 20 25 30 35 40 45 50 55 60 65 70 75 80 85 90 95income Es
tim at ed Pr ob abi lity
not working / not studying not working / studying working / not studying working / studying
Regressions were estimated also for the 1981 to 1998 period for four age groups: 12 to 13 years, 14 to 15 years, 16 to 17 years, and 18 to 19 years. Obviously, for all variables, the results were somewhat modified, but we will present the results only for the most significant variables: sex and living area.
FIGURE 15
Probabilities Related to Year, 1981-1998
Probabilities Related to Year, 1981-1998, Age 12-13
0,00 0,20 0,40 0,60 0,80 1,00
81 82 83 84 85 86 87 88 89 90 91 92 93 94 95 96 97 98
Year
Estimated Probability
not working / not studying not working / studying
working / not studying working / studying
Probabilities Related to Year, 1981-1998, Age 14-15
0,00 0,20 0,40 0,60 0,80 1,00
81 82 83 84 85 86 87 88 89 90 91 92 93 94 95 96 97 98
Year
Estimated Probability
not working / not studying not working / studying
working / not studying working / studying
Probabilities Related to Year, 1981-1998, Age 16-17
0,00 0,20 0,40 0,60 0,80 1,00
81 82 83 84 85 86 87 88 89 90 91 92 93 94 95 96 97 98
Year
Estimated Probability
not working / not studying not working / studying
working / not studying working / studying
Probabilities Related to Year, 1981-1998, Age 18-19
0,00 0,20 0,40 0,60 0,80 1,00
81 82 83 84 85 86 87 88 89 90 91 92 93 94 95 96 97 98
Year
Estimated Probability
not working / not studying not working / studying
working / not studying working / studying
FIGURE 16
Probability of Study Associate to Age - 1981 to 1998
0 0,1 0,2 0,3 0,4 0,5 0,6 0,7 0,8 0,9 1
81 82 83 84 85 86 87 88 89 90 91 92 93 94 95 96 97 98
years
probability of study
12-13 14-15 16-17 18-19
There is an increase in the probability of studying for all age groups except for the 18-19 year old group. The increase is at a decreasing rate. In all the groups and for all cases, we do not notice any change in the pattern of behavior that could be associated with some kind of public policy. For instance, there is no noticeable change after 1995 that could be associated with the new government that took charge that year.
FIGURE 17
Male Female
Probabilities Related to Year by Sex
Probabilities Related to Year, 1981-1998, Age 12-13, Female 0,00 0,20 0,40 0,60 0,80 1,00
81 82 83 84 85 86 87 88 89 90 91 92 93 94 95 96 97 98 Year
Estimated Probabilit
y
not working / not studying not working / studying working / not studying working / studying
Probabilities Related to Year, 1981-1998, Age 12-13, Male 0,00 0,20 0,40 0,60 0,80 1,00
81 82 83 84 85 86 87 88 89 90 91 92 93 94 95 96 97 98 Year
Estimated Probabilit
y
not working / not studying not working / studying working / not studying working / studying
Probabilities Related to Year, 1981-1998, Age 14-15, Male 0,00 0,20 0,40 0,60 0,80 1,00
81 82 83 84 85 86 87 88 89 90 91 92 93 94 95 96 97 98 Year
Estimated Probabilit
y
not working / not studying not working / studying working / not studying working / studying
Probabilities Related to Year, 1981-1998, Age 14-15, Female 0,00 0,20 0,40 0,60 0,80 1,00
81 82 83 84 85 86 87 88 89 90 91 92 93 94 95 96 97 98 Year
Estimated Probabilit
y
not working / not studying not working / studying working / not studying working / studying
Probabilities Related to Year, 1981-1998, Age 16-17, Male 0,00 0,20 0,40 0,60 0,80 1,00
81 82 83 84 85 86 87 88 89 90 91 92 93 94 95 96 97 98 Year
Estimated Probabilit
y
not working / not studying not working / studying working / not studying working / studying
Probabilities Related to Year, 1981-1998, Age 16-17, Female 0,00 0,20 0,40 0,60 0,80 1,00
81 82 83 84 85 86 87 88 89 90 91 92 93 94 95 96 97 98 Year
Estimated Probabilit
y
not working / not studying not working / studying working / not studying working / studying
Probabilities Related to Year, 1981-1998, Age 18-19, Male 0,00 0,20 0,40 0,60 0,80 1,00
81 82 83 84 85 86 87 88 89 90 91 92 93 94 95 96 97 98 Year
Estimated Probabilit
y
not working / not studying not working / studying working / not studying working / studying
Probabilities Related to Year, 1981-1998, Age 18-19, Female 0,00 0,20 0,40 0,60 0,80 1,00
81 82 83 84 85 86 87 88 89 90 91 92 93 94 95 96 97 98 Year
Estimated Probabilit
y
not working / not studying not working / studying working / not studying working / studying
For the 14 to15year old group, we observe a similar picture. There was a decline in the probability of only studying for boys and a constancy for girls, and an increase
With respect to the area where the person lives, rural or urban, we get the following picture:
FIGURE 18
Urban Not Urban
Probabilities Related to Year by Urbanization
Probabilities Related to Year, 1981-1998, Age 12-13, Not Urban
0,00 0,20 0,40 0,60 0,80 1,00
81 82 83 84 85 86 87 88 89 90 91 92 93 94 95 96 97 98 Year
Estimated Probabilit
y
not working / not studying not working / studying working / not studying working / studying
Probabilities Related to Year, 1981-1998, Age 12-13, Urban 0,00 0,20 0,40 0,60 0,80 1,00
81 82 83 84 85 86 87 88 89 90 91 92 93 94 95 96 97 98 Year
Estimated Probabilit
y
not working / not studying not working / studying working / not studying working / studying
Probabilities Related to Year, 1981-1998, Age 14-15, Urban 0,00 0,20 0,40 0,60 0,80 1,00
81 82 83 84 85 86 87 88 89 90 91 92 93 94 95 96 97 98 Year
Estimated Probabilit
y
not working / not studying not working / studying working / not studying working / studying
Probabilities Related to Year, 1981-1998, Age 14-15, Not Urban
0,00 0,20 0,40 0,60 0,80 1,00
81 82 83 84 85 86 87 88 89 90 91 92 93 94 95 96 97 98 Year
Estimated Probabilit
y
not working / not studying not working / studying working / not studying working / studying
Probabilities Related to Year, 1981-1998, Age 16-17, Urban 0,00 0,20 0,40 0,60 0,80 1,00
81 82 83 84 85 86 87 88 89 90 91 92 93 94 95 96 97 98 Year
Estimated Probabilit
y
not working / not studying not working / studying working / not studying working / studying
Probabilities Related to Year, 1981-1998, Age 16-17, Not Urban
0,00 0,20 0,40 0,60 0,80 1,00
81 82 83 84 85 86 87 88 89 90 91 92 93 94 95 96 97 98 Year
Estimated Probabilit
y
not working / not studying not working / studying working / not studying working / studying
Probabilities Related to Year, 1981-1998, Age 18-19, Urban 0,00 0,20 0,40 0,60 0,80 1,00
81 82 83 84 85 86 87 88 89 90 91 92 93 94 95 96 97 98 Year
Estimated Probabilit
y
not working / not studying not working / studying working / not studying working / studying
Probabilities Related to Year, 1981-1998, Age 18-19, Not Urban
0,00 0,20 0,40 0,60 0,80 1,00
81 82 83 84 85 86 87 88 89 90 91 92 93 94 95 96 97 98 Year
Estimated Probabilit
y
not working / not studying not working / studying working / not studying working / studying
13 year old group. For the remaining ages, until 1993, it was only work. After that year, for the group between the ages of 14 and 15 years, work and study became more likely. But for all groups, the only allocation that systematically grew was work and study. In the rural area, this allocation increased 25 percentage points for the 12 to 13 year old group, 27,5 percentage points for the 14 to 15 age group, 26 percentage points for the 16 to 17 group, and 19 percentage points for the 18 to 19 year old group. Therefore, for all groups, it became the second most likely allocation, except for the 14 to 15 year old group where it was the first. The same phenomena were observed in the urban area, but the changes were much smaller. It is interesting that not working and not studying was in the last position for all age groups except for the 12 to 13 year olds in urban areas, and this result is probably associated with labor at home.
5. Conclusions
Although Brazil is behind many Latin American countries, it has improved its educational record in the last twenty years. On the other hand, labor force participation rates were quite stable during that period suggesting that the relevant change was in the growth of the proportion of those studying and working simultaneously. The analysis for the years 1981 and 1996, taking into account individual and family characteristics, allows us to verify which variables had a differentiated impact on time allocation. For the decision of only study, the more important variables are, as suggested by the literature, parents’ education and family income: better-educated parents and more prosperous families increase the probability of school attendance without working. This relationship was stable in the two years of analysis and less important for the youngest children. The number of children in the family and the sex of the individual also affected the probability of Only study: being male and having many children at home lowered this probability for all ages in the two years analyzed. Those same variables have a strong effect, but with an opposite sign, on the decision to only work. The allocation that increased more in the period, work And Study, responded strongly to the location of the family in the rural area. In 1981, this was the least likely option and became the second option in 1986. Not working and not studying had a higher probability for girls in families with a larger number of children. This seems to indicate time dedicated to domestic work and to taking care of younger family members.
The analysis for all years, 1981 to 1988, shows that time had a small effect on the probability of only study, while the probability of only work also declined. On the other hand, it confirmed the increase of the allocation work and study. This behavior is especially great for the poorest and youngest and in rural areas. Therefore, it is possible to characterize the increase in education that has taken place in Brazil in the last twenty years to be the result of the generalization of elementary education, particularly in rural areas, that allowed teenagers who were only working to combine school and economic activities.
6. References
Greene, W. Econometric Analyis 3rd Ed. Prentice Hall, 1997
Menezes Filho, N. Fernandes, R. Pichetti, P. Narita, R. The Choice Between School and
Work in Latin America Anais do XXVIII Encontro Nacional de Economia, ANPEC,
Campinas 2000.
Paes de Barros R. & Mendonça R. Os determinantes da desigualdade no Brasil, Rio de Janeiro, Texto para Discussão No 377, IPEA, 1995.
Paes de Barros, R, Mendonça, R., Velazco, T, Is poverty the main cause of child work in urban Brazil?, Rio de Janeiro, Texto para Discussão No 351, IPEA, 1994.