UNDERSTANDING THE SHAPE OF FEATURE
RODRIGO BARBOSA QUEIROZ
UNDERSTANDING THE SHAPE OF FEATURE
CODE
Dissertação apresentada ao Programa de Pós-Graduação em Ciência da Computação do Instituto de Ciências Exatas da Univer-sidade Federal de Minas Gerais – Departa-mento de Ciência da Computação
como requisito parcial para a obtenção do grau de Mestre em Ciência da Computação.
Orientador: Marco Túlio de Oliveira Valente
RODRIGO BARBOSA QUEIROZ
UNDERSTANDING THE SHAPE OF FEATURE
CODE
Dissertation presented to the Graduate Program in Ciência da Computação of the Universidade Federal de Minas Gerais – De-partamento de Ciência da Computação in partial fulfillment of the requirements for the degree of Master in Ciência da Com-putação.
Advisor: Marco Túlio de Oliveira Valente
©!2015,!Rodrigo!Barbosa!Queiroz """"Todos os direitos reservados
Ficha catalográfica elaborada pela Biblioteca do ICEx - UFMG
!
Queiroz,!Rodrigo!Barbosa.!
Q3u Understanding!the!shape!of!feature!code /!!Rodrigo!!!!! Barbosa!!Queiroz!!!—!!Belo Horizonte, 2015.
xix,!82f.!:!il.!;!29cm.!
Dissertação (Mestrado) - Universidade Federal de Minas Gerais – Departamento de Ciência da Computação
Orientador: Marco Túlio de Oliveira Valente
1. Computação - Teses. 2.Engenharia de linha de produto de software - Teses.3. Software - Reutilização - Teses. I. Orientador. II. Título.
Resumo
Feature annotations (por exemplo, diretivas do preprocessador C, na forma de#ifdefs) são usadas para controlar extensões de código relacionadas a uma feature. Por muito tempo, tais anotações têm sido consideradas indesejáveis. Seu uso excessivo pode au-mentar o risco de ripple effects, desorganizar o código e dificultar sua compreensão e manutenção. Para prevenir esses problemas, desenvolvedores devem monitorar o uso de feature annotations, por exemplo, estabelecendothresholds (valores de referência). No entando, pouco se sabe sobre como extrair thresholds na prática, ou quais valores são representativos para métricas relacionadas afeatures. Para contribuir com uma solução para esse problema, nós analizamos a distribuição estatística de métricas relacionadas a feature annotations, extraídas de umcorpus de 20 sistemas baseados no preprocessador C, amplamente conhecidos, com longo histórico de evolução e que abrangem diferentes domínios de função. O estudo considera 3 métricas: scattering degree (espalhamento de feature constants), tangling degree (entrelaçamento de feature expressions) e nest-ing depth (profundidade das anotações). Os resultados mostram que feature scattering possui uma distribuição com elevada assimetria. Em 14 sistemas (70 %), a distribuição de scattering degree segue uma distribuição power-law, tornando medidas de média e desvio padrão não confiáveis para estabelecer limites. Em relação a tangling enesting, os valores tendem a seguir uma distribuição uniforme. Embora existam outliers, eles pouco impactam a média, sugerindo que medidas de tendência central podem gerar thresholds confiáveis. Com base nestes resultados, nós propomos thresholds gerados a partir de nosso benchmark como base para trabalhos futuros. Adicionalmente, nós re-alizamos uma revisão sistemática da literatura para identificar descobertas e suposições reportadas na literatura sobre o uso de ifdefs. Os resultados mostram que os estudos disponíveis não realizam análise estatística de métricas relacionadas a features, e nem propõem thresholds.
Palavras-chave: Linhas de Produto de Software, features, variabilidade, cpp, ifdef.
Abstract
Feature annotations (e.g., code fragments guarded by ifdef C-preprocessor directives) are widely used to control code extensions related to features. Feature annotations have long been said to be undesirable. When maintaining features guarded by anno-tations, there is a high risk of ripple effects. Also, excessive use of feature annotations may lead to code clutter, hinder program comprehension and harden maintenance. To prevent such problems, developers should monitor the use of feature annotations, for example, by setting acceptable thresholds. Interestingly, little is known about how to extract thresholds in practice, and which values are representative for feature-related metrics. To address this issue, in this master dissertation we analyze the statistical distribution of three feature-related metrics collected from a corpus of 20 well-known and long-lived C-preprocessor-based systems from different domains. We consider three metrics: scattering degree of feature constants, tangling degree of feature expressions, and nesting depth of preprocessor annotations. Our findings show that feature scatte-ring is highly skewed; in 14 systems (70%), the scattescatte-ring distributions match a power law, making averages and standard deviations unreliable limits. Regarding tangling and nesting, the values tend to follow a uniform distribution; although outliers exist, they have little impact on the mean, suggesting that central statistics measures are reliable thresholds for tangling and nesting. Following our findings, we then propose thresholds from our benchmark data, as a basis for further investigations. We also report in this work the result of a systematic literature review, conducted to identify empirical findings and assumptions on the usage of ifdefs as reported in the literature. The inspection of the assumptions and findings shows that studies do not investigate the statistical distributions that better describe feature-related metric values, and also do not propose thresholds for such metrics.
Keywords: Software Product Lines, features, variability, cpp, ifdef.
List of Figures
1.1 Histogram of Scattering Degree (SD), Tangling Degree (TD), and Nesting Depth (ND) in php . . . 4 1.2 Empirical CDF of the Scattering Degree (SD) inphp and the fitted
power-law function in red, both in logarithmic scale. . . 4
2.1 Feature implementation example usingifdefs (mmapmodule.cfile from the Python interpreter) . . . 11 2.2 Tangled feature implementation example using ifdefs (fileio.c from the
Python interpreter) . . . 11 2.3 Histogram of the population of US cities with population of 10 000 or more
(data from the 2000 US Census) . . . 14 2.4 Empirical Cumulative Density Function of the population of US cities
(points) and the fitted power-law function in red, both in logarithmic scale (data from the 2000 US Census) . . . 15
3.1 Bipartite graph connecting selected studies and their findings (e.g., finding F1 is reported in studies S25 and S35; study S29 reports findings F2, F3 and F4) . . . 22 3.2 Selected studies over the years . . . 23 3.3 Distribution of assumptions degree (a) and findings degree (b) . . . 24
4.1 Example of code, as considered by fscat (a) and after the transformations performed by cppstats (b) . . . 32 4.2 Main steps of our methodology . . . 35 4.3 Histograms of scattering degrees (SD) . . . 37 4.4 Empirical CDFs of the scattering degrees (points) and the fitted power law
(red line), both in logarithmic scale . . . 38 4.5 Histogram of tangling degrees (TD) . . . 41 4.6 Histogram of Nesting Depth (ND) . . . 43
4.7 ComplianceRate and CompliancePenalty functions [Oliveira et al., 2014b] . 45 4.8 Percentile plots of scattering degrees (SD) . . . 46 4.9 Histogram of Scattering Degree (SD), Tangling Degree (TD), and Nesting
Depth (ND) in xterm . . . 49 4.10 Implementingifdefs with different programming styles . . . 50
List of Tables
3.1 Number of articles resulting from the search process. The first column lists the search results from the digital libraries; the second column lists the number of papers resulting from the SQL filter. . . 19 3.2 Number of articles resulting from the selection process after inspection and
consensus by two researchers. . . 20 3.3 Ranking of findings extracted from selected studies. The number of studies
reporting the finding is used as a ranking criteria . . . 23
4.1 Subject systems . . . 30 4.2 Scattering degree (SD) descriptive measures (NOFC: Number of Feature
Constants) . . . 36 4.3 Power-law best-fit analysis for scattering degree (SD). Significant results
(p-value >0.1) are bold. . . 39 4.4 Tangling degree (TD) descriptive measures (NOFE: Number of Feature
Ex-pressions) . . . 40 4.5 Nesting Depth (ND) descriptive measures (NOTLB: Number of Top-Level
Branches) . . . 42
B.1 Full list of selected studies . . . 71 B.2 Conference and Journal Acronyms . . . 74
C.1 Ranking of Assumptions. The column Pos indicates the position in our ranking; the column Degree indicates the number of studies reporting the assumption; and the column Studies lists the related studies. The details of each study can be found in Table B.1 . . . 75 C.2 Ranking of Findings. The column Pos indicates the position in our ranking;
the column Degree indicates the number of studies reporting the finding; and the column Studies lists the related studies. The details of each study can be found in Table B.1 . . . 80
Contents
Resumo ix
Abstract xi
List of Figures xiii
List of Tables xv
1 Introduction 1
1.1 Motivation . . . 1
1.2 An Overview of the Study . . . 2
1.3 Outline of the Dissertation . . . 5
1.4 Publications . . . 6
2 Background 7 2.1 Software Product Lines . . . 7
2.1.1 Features . . . 8
2.1.2 Implementation Approaches . . . 9
2.2 C Preprocessor . . . 10
2.3 Software Metrics . . . 12
2.4 Power-law Distributions . . . 13
2.5 Final Remarks . . . 15
3 Findings and Assumptions on the Usage of ifdefs 17 3.1 Study Design . . . 17
3.1.1 Search Strategy . . . 17
3.1.2 Study Selection . . . 19
3.1.3 Data Extraction . . . 20
3.1.4 Data Classification and Ranking . . . 21
3.2 Results . . . 23
3.2.1 Overview . . . 23
3.2.2 Best Ranked Assumptions . . . 24
3.2.3 Best Ranked Findings . . . 26
3.3 Final Remarks . . . 28
4 The Shape of Feature Code 29 4.1 Methodology . . . 29
4.1.1 Selection of Subject Systems . . . 30
4.1.2 Data Collection and Metrics . . . 31
4.1.3 Statistical Analysis . . . 33
4.1.4 Threshold Extraction . . . 34
4.2 Results . . . 35
4.2.1 Scattering Degree . . . 35
4.2.2 Tangling Degree . . . 39
4.2.3 Nesting Depth . . . 40
4.3 Thresholds for Feature-Related Metrics . . . 44
4.3.1 Relative Thresholds . . . 44
4.3.2 Thresholds for Scattering Degree . . . 45
4.3.3 Thresholds for Tangling Degree . . . 47
4.3.4 Thresholds for Nesting Depth . . . 47
4.3.5 Discussion . . . 48
4.4 Threats to Validity . . . 49
4.5 Final Remarks . . . 50
5 Conclusion 53 5.1 Overview . . . 53
5.2 Contributions . . . 54
5.3 Related Work . . . 54
5.3.1 Metrics for C-preprocessor Annotations . . . 54
5.3.2 Characterization of Software Metrics Distribution . . . 55
5.4 Future Work . . . 56
Bibliography 59 Appendix A Search Strings and Filters 67 A.1 ACM Digital Library . . . 67
A.2 IEEEXplore . . . 68
A.3 ScienceDirect . . . 68
A.4 Ei Compendex and Inspec . . . 69
A.5 SpringerLink . . . 69
A.6 Scopus . . . 70
Appendix B Selected Studies 71
C Ranking 75
Chapter 1
Introduction
In this chapter, we state the problem and present this dissertation’s motivation (Section 1.1). We then provide an overview of our study (Section 1.2). Finally, we present the outline of the dissertation (Section 1.3) and our publications (Section 1.4).
1.1
Motivation
Feature annotations, such as ifdefs (#ifdef, #ifndef, #elif, and #if C-preprocessor directives), are long said to be undesirable in source code [Favre, 1996; Krone, 1994; Spencer and Collyer, 1992]. Since annotations are often spread across the entire code base, they clutter source code, hinder program comprehension, and, consequently, com-plicate maintenance. These annotations are used to relate code fragments to corre-sponding features. When maintaining the features of the system, each related exten-sion is a potential code fragment that has to be maintained, increasing the likelihood of ripple effects.
Despite these drawbacks, feature annotations are widely used in practice [Apel et al., 2008a, 2013a; Favre, 1996; Kiczales et al., 1997; Krone, 1994; Liebig et al., 2010, 2011; Spencer and Collyer, 1992], mainly, due to limitations of existing programming languages (e.g., see the tyranny of the dominant decomposition [Sullivan et al., 2005; Kästner et al., 2011]). In any case, annotations provide a simple way to include new features into the code base, avoiding the upfront investment on creating modules and interfaces [Kästner et al., 2008]. Still, to prevent an excessive use of feature annotations, developers should monitor their use, for example, by settingthresholds (a typical limit). To reveal how feature annotations are used in source code, metrics quantifying properties, such as scattering, tangling, or nesting, have been proposed in the litera-ture [Liebig et al., 2010]. However, different from other standard code metrics (e.g.,
2 Chapter 1. Introduction
size, complexity, coupling) [Alves et al., 2010; Oliveira et al., 2014b], these feature-annotation metrics have never been studied using rigorous statistical methods. At best, researchers report averages and standard deviations over large sets of system, as done by Liebig et al. [2010]. Central tendency and dispersion measures (e.g., mean and standard deviation), however, might not result in representative values.
Recent work [Baxter et al., 2006; Louridas et al., 2008; Wheeldon and Counsell, 2003; Ferreira et al., 2012; Filó et al., 2014], suggests that some code metrics follow heavy-tailed distributions, often matching a power-law distribution. In such distribu-tions, the probability that an entity measure deviates from a typical value (e.g., arith-metic mean) is not negligible. That is, a significant fraction of code entities do not follow typical metric values, making centrality and dispersion statistics unreliable.
The central goal of this master dissertation is to understand how feature code is implemented in practice. To achieve this goal, we initially search for studies in the literature regarding the usage of ifdefs. Next, we investigate twenty well-known C-preprocessor-based open-source software systems regarding the distribution of three metrics. We analyze the distribution of feature scattering degree (SD), tangling degree (TD) and the nesting depth (ND) ofifdef annotations in these systems. These metrics are based on metrics proposed by Liebig et al. [2010]: SD counts the number ofifdefs that refer to a given feature; TD counts the number of features that occur in a given feature expression; ND is the depth of the tree of nestedifdefs.
We found that feature scattering has highly skewed distributions, and that re-porting metrics in terms of averages and standard deviations is unreliable, although commonly done so. Hence, we raise awareness that feature scattering thresholds based on central measures are not reliable in practice. However, regarding tangling degree and nesting depth, the extracted metric values tend to follow a uniform distribution in all systems, with most values equal to one. Although outliers exist, these distributions are not as skewed as the ones seen in the scattering degree metric. This result suggests that mean values for tangling degree and nesting depth are in fact robust. Based on our analysis, we propose thresholds for the metrics we studied, which are derived such that they respect the statistical distributions we have observed.
1.2
An Overview of the Study
1.2. An Overview of the Study 3
of the literature aboutifdef usage. We performed an automatic search from 12/10/2014 to 12/11/2014 in the most relevant digital libraries and inspected the results to select studies that have at least one finding or assumption about the use of ifdefs. Next, we extracted findings and assumptions directly from the papers, classified them, and merged the similar ones (whenever possible), keeping the mapping with their studies. We then prioritized them in a ranking system to identify the most common assumptions and findings regarding the usage of ifdefs, as reported in the literature.
The inspection of the assumptions and findings shows that there are few studies that rely on metrics to reason about preprocessor-based systems. Specifically, they do not investigate the statistical distributions that better describe preprocessor-based metric values and also do not propose thresholds for such metrics.
In the second part of the study, we performed an analysis of twenty C-preprocessor-based software systems (e.g.,Git, php, MySQL, Linux kernel). To select the subjects, we aimed at covering multiple application domains, and therefore, avoiding bias toward an specific domain. Each system has substantial history of devel-opment and use. We used a custom-made tool (fscat) to parse the source code and to compute three metrics: scattering degree (SD) of feature constants, tangling degree (TD) of feature expressions, and nesting depth (ND) of preprocessor annotations. The proposed metrics are based on the metrics of Liebig et al. [2010] and can be used to evaluate complex usages of ifdefs in source-code.
After collecting the metrics, we performed the statistical analysis, inspecting the distributions of SD, TD, and ND for each of our 20 subject systems. We inspected the histograms, standard descriptive statistics, and also the Gini coefficient [Gini, 1921] to measure the degree of concentration of the metric values inside each distribution. In this initial analysis step, we check whether the collected distributions have characteristics of a power-law distribution. Then, we proceed with a rigorous test of the power-law hypothesis following Clauset et al. [2009].
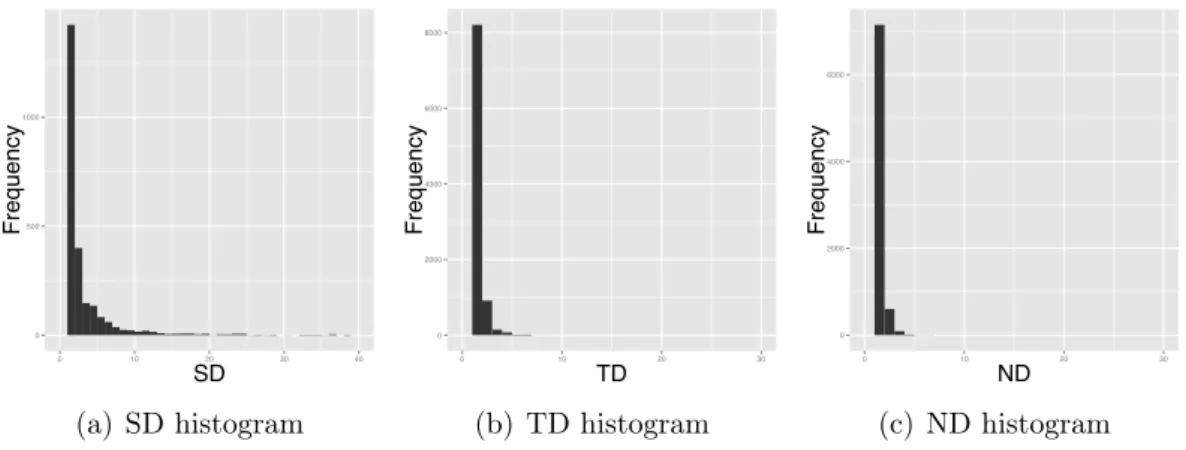
4 Chapter 1. Introduction
in both axes). The plot reveals that the points approximate the line, strengthening our understanding that feature scattering indeed follows a power-law distribution.
0 500 1000
0 10 20 30 40
SD
Frequency
(a) SD histogram
0 2000 4000 6000 8000
0 10 20 30
TD
Frequency
(b) TD histogram
0 2000 4000 6000
0 10 20 30
ND
Frequency
(c) ND histogram
Figure 1.1: Histogram of Scattering Degree (SD), Tangling Degree (TD), and Nesting Depth (ND) inphp
● ● ● ● ● ● ● ● ● ● ● ● ● ●●●● ●● ●●●● ● ●●●●●●●●●● ●●●● ●●● ● ●●●● ● ●● ●● ● ● ● ● ● ● ● ● ● ● ●
SD
1 2 5 10 20 50 100 200 500
0.0005
0.0050
0.0500
0.5000
CDF
Figure 1.2: Empirical CDF of the Scattering Degree (SD) inphpand the fitted power-law function in red, both in logarithmic scale.
1.3. Outline of the Dissertation 5
set of subject systems for metrics that follow heavy-tailed distributions. Taking data skew into account we used Oliveira et al. [2014a] functions to extract thresholds for Scattering Degree (SD). Tangling degree (TD) and Nesting Depth (ND) approximate an uniform distribution, allowing to directly define thresholds from the mode and its relative frequency (%).
Finally, to illustrate how the proposed thresholds can be used to check whether a system implementation includes a complex usage ofifdefs we applied them onxterm 3.1.8. Existing research [Liebig et al., 2010] shows thatxtermmakes a heavy and com-plex usage of ifdefs. In our evaluation, showed in Section 4.3.5, the derived thresholds indeed indicate that xterm has a complex usage ofifdefs.
1.3
Outline of the Dissertation
We organized the remainder of this work as follows:
• Chapter 2 covers central concepts related to this master dissertation, including a discussion on the following concepts and tools: Software Product Lines, C Preprocessor, Software Metrics, and Power-Law Distributions.
• Chapter 3 presents a Systematic Literature Review (SLR) conducted to identify empirical findings and assumptions on the usage of ifdefs to implement variabil-ity. We detail the protocol that guided our search strategy, the study selection, the data extraction process, and how we organized and classified the findings and assumptions extracted from the literature on ifdefs. Finally, we discuss our findings.
• Chapter 4 presents a study analyzing twenty well-know C-preprocessor-based open-source software systems to reveal how feature annotations are used in source code, and how to extract thresholds to monitor and prevent excessive usage. In this study we analyzed the statistical distribution of scattering degree, tangling degree, and nesting depth. Finally, we propose relative thresholds for the metrics we studied.
6 Chapter 1. Introduction
1.4
Publications
This master dissertation generated the following publications and therefore contains material from them:
• Rodrigo Queiroz; Leonardo Passos; Marco Tulio Valente; Claus Hunsen; Sven Apel; Krzysztof Czarnecki. The Shape of Feature Code: An Analysis of Twenty C-Preprocessor-Based Systems. Journal on Software and Systems Modeling, pages 1–29, 2015. Qualis B1. JCR 2015 = 1 408.
Chapter 2
Background
In this chapter, we provide the background for understanding this master dissertation. We discuss the following concepts and tool: Software Product Lines (Section 2.1), C Preprocessor (Section 2.2), Software Metrics (Section 2.3), and Power-Law Distribu-tions (Section 2.4).
2.1
Software Product Lines
A Software Product Line (SPL) is a family of related program variations that are gen-erated from a common code base [Czarnecki and Eisenecker, 2000; Liebig et al., 2010; Apel et al., 2013b]. The aim of SPL engineering is to facilitate the reuse of common software artifacts in different variants. Software Product Lines introduce the possibility to incorporate individual requirements on the software production such as functional-ity, target platforms, performance, and energy consumption, but with the benefits of mass production. For example, the Linux kernel runs on a wide variety of different platforms (embed devices, desktops, large scale servers, etc.) and supports different application domains (office software, high performance computing, server software, and many others) [Apel et al., 2013b].
Apel et al. [2013b] highlight the most important promised benefits of Software Product Lines:
• Tailor-made: SPL-based software development approaches facilitate tailoring products to individual customers instead of providing a standardized product or a small set of preconfigured products.
• Reduced costs: instead of paying the costs of designing and developing each product from scratch, product-line vendors develop reusable parts that can be
8 Chapter 2. Background
combined in different ways. The required upfront investment is larger than devel-oping a single software product, but the approach pays offspecially when multiple tailored products are requested.
• Improved quality: SPLs are constructed from standardized parts. Compared with software developed from scratch, these standardized parts are systematically checked and tested in many products. Parts that are used in multiple products can lead to more stable and reliable products.
• Time to market: software vendors can quickly produce a software product by assembling existing parts. Building a product on top of existing well-designed reusable parts is much faster than developing it from scratch.
However, the benefits of a product-line approach come at a price: it raises the complexity of development, requiring a variability management and a significant up-front investment [Apel et al., 2013b].
2.1.1
Features
The concept of feature is very important to SPL engineering. In their seminal work, Kang et al. [1990] introduce FODA (Feature-oriented domain analysis), a SPL approach based on feature diagrams, and the notion of feature as“a prominent or distinctive user-visible aspect, quality, or characteristic of a software system or systems”. However, this concept is inherently hard to define, and consequently there are many definitions. On the one hand, some definitions capture the intentions of stakeholders (end users, managers, programmers, etc.) of a product-line. On the other hand, some definitions capture implementation-level concepts used to structure and reuse software artifacts. Some of the more common definitions are listed below:
“a prominent or distinctive user-visible aspect, quality, or characteristic of a software system or systems” [Kang et al., 1990]
“a distinguishable characteristic of a concept (e.g., system, component, and so on) that is relevant to some stakeholder” [Czarnecki and Eisenecker, 2000] “an optional or incremental unit of functionality” [Zave, 2003]
2.1. Software Product Lines 9
The combination of features generates distinguished programs, called variants [Liebig et al., 2010; Kästner et al., 2009]. However, not every feature combination is meaningful. For example, some features are mutual exclusive. A feature model [Kästner et al., 2009; Apel et al., 2013b] documents the features of a product line and their relationships, defining which combinations are valid. In practice, a feature model contains hundreds or thousands of features, and the number of potential variants can grow exponentially. The idea of feature orientation is to organize and structure all software artifacts in terms of features. It makes a feature explicit in the entire life cycle: requirements, design, coding, and testing [Apel et al., 2013b].
2.1.2
Implementation Approaches
Software Product Lines can be implemented in two different ways: the compositional approach and the annotative approach [Kästner et al., 2008]. With the compositional approach, features are implemented as distinct modules, and a set of modules is com-posed to generate a product. A classic example is a framework that can be extended with plug-ins (ideally one plug-in per feature). There are several examples of com-positional techniques using specialized architectures and languages like Mixin Layers [Smaragdakis and Batory, 2002], AHEAD [Batory et al., 2003], and Aspects [Kiczales et al., 1997].
With the annotative approach, features are implemented with explicit or implicit annotations of the source code. A typical example for annotative approach is the use of
#ifdef directives of the C preprocessor (Section 2.2). Other examples include Gears, XVCL, and CIDE [Kästner et al., 2008]. Depending on how they are used, some approaches like Aspects can be included in both groups. However, approaches based on tool support like Generative Programming [Czarnecki and Eisenecker, 2000] do not fit into either group.
10 Chapter 2. Background
2.2
C Preprocessor
The C preprocessor (CPP) enriches the C language with simple meta-programming facilities, supporting the implementation of software families [Liebig et al., 2010; Apel et al., 2013a; Passos et al., 2013]. In particular, CPP introduces three capabilities: file inclusion (#include directive), macro definition (#define directive) and expansion, and conditional compilation (#ifdef directive). Here, we concentrate on conditional compilation to support variability in source code and on problems related to this ca-pability.
The conditional-compilation mechanisms of the C preprocessor provide an easy approach to implement variability in software product-lines. The concept is very sim-ple: features are denoted by macro names, which in turn are referenced by different compilation-guard conditions annotated in code fragments. Depending on the feature selection, the preprocessor removes annotated code fragments before the compilation. There are different types of guard conditions: #ifdef, #ifndef, #elif, and #if. For brevity, we refer to all these constructs as ifdefs.
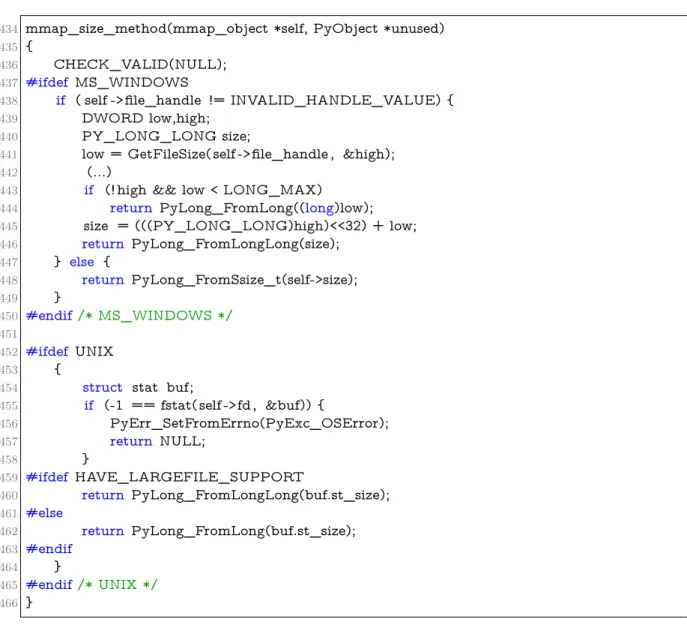
In Figure 2.1, we exemplify a preprocessor-based implementation taken from the python interpreter source code, with fragments of code framed with #ifdef
and #endif directives. In file mmapmodule.c, developers introduce some extensions conditionally, depending on the choice of the target operating system. This condi-tional code is controlled by the presence or absence of certain features. Lines 438– 449, for instance, depend on the presence of feature MS_WINDOWS, while lines 453–464 depend on the presence of feature UNIX. Nested in the code of UNIX fea-ture, there is further variability that is related to the support of large files. Fea-ture HAVE_LARGEFILE_SUPPORT implements this nested variable behavior at line 460. In Figure 2.2, there is another use of feature MS_WINDOWS, also taken from the python interpreter source code. In this case, the presence of either
MS_WINDOWSor__CYGWIN__ enables the compilation of the guarded code at line 428.
2.2. C Preprocessor 11
434 mmap_size_method(mmap_object *self, PyObject *unused)
435 {
436 CHECK_VALID(NULL);
437 #ifdef MS_WINDOWS
438 if ( self ->file_handle != INVALID_HANDLE_VALUE) {
439 DWORD low,high;
440 PY_LONG_LONG size;
441 low = GetFileSize( self ->file_handle , &high);
442 (...)
443 if (! high && low < LONG_MAX)
444 return PyLong_FromLong((long)low);
445 size = (((PY_LONG_LONG)high)<<32) + low;
446 return PyLong_FromLongLong(size);
447 } else {
448 return PyLong_FromSsize_t(self->size);
449 }
450 #endif/* MS_WINDOWS */
451
452 #ifdef UNIX
453 {
454 struct stat buf;
455 if (-1 == fstat( self ->fd , &buf)) {
456 PyErr_SetFromErrno(PyExc_OSError);
457 return NULL;
458 }
459 #ifdef HAVE_LARGEFILE_SUPPORT
460 return PyLong_FromLongLong(buf.st_size);
461 #else
462 return PyLong_FromLong(buf.st_size);
463 #endif
464 }
465 #endif/* UNIX */
466 }
Figure 2.1: Feature implementation example using ifdefs (mmapmodule.c file from the Python interpreter)
427 #if defined(MS_WINDOWS) || defined(__CYGWIN__)
428 _setmode(self->fd, O_BINARY);
429 #endif
430 (...)
Figure 2.2: Tangled feature implementation example using ifdefs (fileio.c from the Python interpreter)
12 Chapter 2. Background
kinds of annotations, including individual tokens such as a closing bracket, leading to hard-to-find syntax errors. Annotations that do not align with the syntactic code structure, (e.g., with entire statements, functions, and type declarations) are called undisciplined annotations [Liebig et al., 2011]. The presence of preprocessor directives also hinders the use of supporting tools and creates a great challenge for refactoring [Medeiros et al., 2014; Overbey et al., 2014; Kästner et al., 2009; Garrido and Johnson, 2013]. As Adams et al. [2008] state, “cpp is a necessary evil for every C programmer and maintainer”.
2.3
Software Metrics
According to Fenton and Pfleeger [1998],“Measurement is the process by which numbers or symbols are assigned to attributes of entities in the real world in such a way as to describe them according to clearly defined rules”. A software can be measured using software metrics, a quantitative measure of the degree to which a system, component, or process possess a given attribute [IEEE, 1990].
Software metrics can be divided into three categories [Fenton and Pfleeger, 1998]:
• Process metrics: measure attributes of a development process itself.
• Product metrics: measure documents and software artifacts that were produced as part of the software development process.
• Resource metrics: measure resources used as part of a process.
They can also be divided into metrics that measure internal or external attributes. A metric can measure an internal attribute by observing only the process or product itself, or an external attribute related to the behavior of the software. In this work we focus on internal product metrics that measure source code properties.
Over decades, hundreds of source code metrics have been proposed by researchers and practitioners, in both theoretical and empirical studies. Well-known source code metrics include cyclomatic complexity, number of attributes (NOA), number of meth-ods (NOM), response for a class (RFC), number of references to a class (FAN-IN), number of other classes referenced by a class (FAN-OUT), and weighted method count (WMC) [Chidamber and Kemerer, 1994; Brito e Abreu and Carapuca, 1994; Lanza and Marinescu, 2010].
2.4. Power-law Distributions 13
measurement instrument, developers should define meaningful thresholds. In this way, software engineers can rely on metrics, for example, to monitor the evolution of com-ponents or the quality degradation.
In general, a threshold defines an upper bound. Values greater than a threshold value are considered to be problematic, and the values lower are considered to be acceptable. Most metric thresholds proposed in literature are based on the experience of software experts on what constitutes desirable software properties [Caltech, 2010]. Other thresholds are computed using a more transparent method, for example, from benchmark data [Alves et al., 2010; Oliveira et al., 2014b].
2.4
Power-law Distributions
Many empirical quantities cluster around a typical value. For example, the heights of human beings, the speeds of cars on a highway, air pressure. Even with some variations, their distributions place a negligible amount of probability far from the typical value. However, not all distributions fit this pattern. Among such distributions, power-law distributions widely appear in a diverse range of natural and man-made phenomena. Examples include the intensity of earthquakes, solar flares, moon craters, and people’s personal fortunes [Clauset et al., 2009; Newman, 2005].
Studies around the power law as a descriptive device has been around for more than a century and have appeared in various contexts [Louridas et al., 2008]:
• 1897: The Italian economist Vilfredo Pareto described a power law distribution in the 19th century.
• 1925: G. Udny Yule observed the power law model in his study on the creation of biological species.
• 1935: George Kingsley Zipf observed the frequency of the most common words in natural language.
• 1951: Benoit Mandelbrot came upon power laws in a theory of word frequencies.
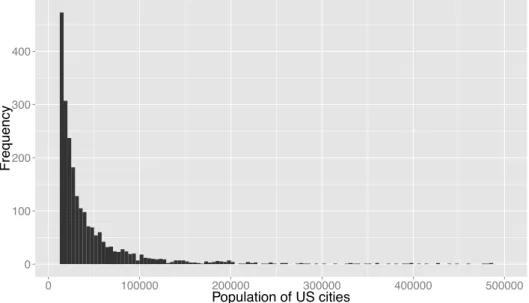
A distribution is said to be a power-law when the probability of measuring a par-ticular value varies inversely as a power of that value [Newman, 2005]. The population of towns and cities is a classic example of this type of distribution. Figure 2.3 shows a histogram with the distribution of the US city populations, extracted from the 2000 census,1
as analyzed by Clauset et al. [2009] and Newman [2005]. The histogram is
1
14 Chapter 2. Background
highly right-skewed: while the bulk of the distribution refers to small-sized cities, a small number of very large cities produces the heavy-tail to the right of the histogram. Another important characteristic of a power-law distribution concerns its visualization: when plotted on a logarithmic scale in both axes, a power-law function appears as a decreasing line, as shown in Figure 2.4.
0 100 200 300 400
0 100000 200000 300000 400000 500000
Population of US cities
Frequency
Figure 2.3: Histogram of the population of US cities with population of 10 000 or more (data from the 2000 US Census)
In formal terms, a discrete power-law distribution (which we refer henceforth as power-law) is a distribution in which the probability that a discrete random variable X assumes a value x is proportional to x raised to the negative power of a positive constantk:
P(X =x)∝cx−k where c >0, k >0 (2.1)
A power law, as given by this equation, diverges whenx= 0. In fact, it requires a lower-bound value xmin > 0 to define a cut-off value as starting point (x > xmin)
from which a power-law behavior occurs [Clauset et al., 2009]. As we shall see later in Chapter 4, the parameters k and xmin play an important role when performing a
goodness-of-fit analysis.
2.5. Final Remarks 15
● ● ● ● ● ● ● ● ● ● ● ● ● ● ● ● ● ● ●
●●●●●●●●●●●●●●●●●●●●●●●●●●●●●●●●●●●●●●●●●●●●●●●●●●●●●●●●●●●●●●●●●●●●●●●●●●●●●●●●●●●●●●●●●●●●●●●●●●●●●●●●●●●●●●●●●●●●●●●●●●●●●●●●●●●●●●●●●●●●●●●●●●●●●●●●●●●●●●●●●●●●●●●●●●●●●●●●●●●●●●●●●●●●●●●●●●●●●●●●●●●●●●●●●●●●●●●●●●●●●●●●●●●●●●●●●●●●●●●●●●●●●●●●●●●●●●●●●●●●●●●●●●●●●●●●●●●●●●●●●●●●●●●●●●●●●●●●●●●●●●●●●●●●●●●●●●●●●●●●●●●●●●●●●●●●●●●●●●●●●●●●●●●●●●●●●●●●●●●●●●●●●●●●●●●●●●●●●●●●●●●●●●●●●●●●●●●●●●●●●●●●●●●●●●●●●●●●●●●●●●●●●●●●●●●●●●●●●●●●●●●●●●●●●●●●●●●●●●●●●●●●●●●●●●●●●●●●●●●●●●●●●●●●●●●●●●●●●●●●●●●●●●●●●●●●●●●●●●●●●●●●●●●●●●●●●●●●●●●●●●●●●●●●●●●●●●●●●●●●●●●●●●●●●●●●●●●●●●●●●●●●●●●●●●●●●●●●●●●●●●●●●●●●●●●●●●●●●●●●●●●●●●●●●●●●●●●●●●●●●●●●●●●●●●●●●●●●●●●●●●●●●●●●●●●●●●●●●●●●●●●●●●●●●●●●●●●●●●●●●●●●●●●●●●●●●●●●●●●●●●●●●●●●●●●●●●●●●●●●●●●●●●●●●●●●●●●●●●●●●●●●●●●●●●●●●●●●●●●●●●●●●●●●●●●●●●●●●●●●●●●●●●●●●●●●●●●●●●●●●●●●●●●●●●●●●●●●●●●●●●●●●●●●●●●●●●●●●●●●●●●●●●●●●●●●●●●●●●●●●●●●●●●●●●●●●●●●●●●●●●●●●●●●●●●●●●●●●●●●●●●●●●●●●●●●●●●●●●●●●●●●●●●●●●●●●●●●●●●●●●●●●●●●●●●●●●●●●●●●●●●●●●●●●●●●●●●●●●●●●●●●●●●●●●●●●●●●●●●●●●●●●●●●●●●●●●●●●●●●●●●●●●●●●●●●●●●●●●●●●●●●●●●●●●●●●●●●●●●●●●●●●●●●●●●●●●●●●●●●●●●●●●●●●●●●●●●●●●●●●●●●●●●●●●●●●●●●●●●●●●●●●●●●●●●●●●●●●●●●●●●●●●●●●●●●●●●●●●●●●●●●●●●●●●●●●●●●●●●●●●●●●●●●●●●●●●●●●●●●●●●●●●●●●●●●●●●●●●●●●●●●●●●●●●●●●●●●●●●●●●●●●●●●●●●●●●●●●●●●●●●●●●●●●●●●●●●●●●●●●●●●●●●●●●●●●●●●●●●●●●●●●●●●●●●●●●●●●●●●●●●●●●●●●●●●●●●●●●●●●●●●●●●●●●●●●●●●●●●●●●●●●●●●●●●●●●●●●●●●●●●●●●●●●●●●●●●●●●●●●●●●●●●●●●●●●●●●●●●●●●●●●●●●●●●●●●●●●●●●●●●●●●●●●●●●●●●●●●●●●●●●●●●●●●●●●●●●●●●●●●●●●●●●●●●●●●●●●●●●●●●●●●●●●●●●●●●●●●●●●●●●●●●●●●●●●●●●●●●●●●●●●●●●●●●●●●●●●●●●●●●●●●●●●●●●●●●●●●●●●●●●●●●●●●●●●●●●●●●●●●●●●●●●●●●●●●●●●●●●●●●●●●●●●●●●●●●●●●●●●●●●●●●●●●●●●●●●●●●●●●●●●●●●●●●●●●●●●●●●●●●●●●●●●●●●●●●●●●●●●●●●●●●●●●●●●●●●●●●●●●●●●●●●●●●●●●●●●●●●●●●●●●●●●●●●●●●●●●●●●●●●●●●●●●●●●●●●●●●●●●●●●●●●●●●●●●●●●●●●●●●●●●●●●●●●●●●●●●●●●●●●●●●●●●●●●●●●●●●●●●●●●●●●●●●●●●●●●●●●●●●●●●●●●●●●●●●●●●●●●●●●●●●●●●●●●●●●●●●●●●●●●●●●●●●●●●●●●●●●●●●●●●●●●●●●●●●●●●●●●●●●●●●●●●●●●●●●●●●●●●●●●●●●●●●●●●●●●●●●●●●●●●●●●●●●●●●●●●●●●●●●●●●●●●●●●●●●●●●●●●●●●●●●●●●●●●●●●●●●●●●●●●●●●●●●●●●●●●●●●●●●●●●●●●●●●●●●●●●●●●●●●●●●●●●●●●●●●●●●●●●●●●●●●●●●●●●●●●●●●●●●●●●●●●●●●●●●●●●●●●●●●●●●●●●●●●●●●●●●●●●●●●●●●●●●●●●●●●●●●●●●●●●●●●●●●●●●●●●●●●●●●●●●●●●●●●●●●●●●●●●●●●●●●●●●●●●●●●●●●●●●●●●●●●●●●●●●●●●●●●●●●●●●●●●●●●●●●●●●●●●●●●●●●●●●●●●●●●●●●●●●●●●●●●●●●●●●●●●●●●●●●●●●●●●●●●●●●●●●●●●●●●●●●●●●●●●●●●●●●●●●●●●●●●●●●●●●●●●●●●●●●●●●●●●●●●●●●●●●●●●●●●●●●●●●●●●●●●●●●●●●●●●●●●●●●●●●●●●●●●●●●●●●●●●●●●●●●●●●●●●●●●●●●●●●●●●●●●●●●●●●●●●●●●●●●●●●●●●●●●●●●●●●●●●●●●●●●●●●●●●●●●●●●●●●●●●●●●●●●●●●●●●●●●●●●●●●●●●●
●
●●●●●
● ●
● ● ● ●
● ●
●
●
●
Population of US cities
10000 50000 500000 5000000
0.0005
0.0050
0.0500
0.5000
CDF
Figure 2.4: Empirical Cumulative Density Function of the population of US cities (points) and the fitted power-law function in red, both in logarithmic scale (data from the 2000 US Census)
been investigated whether the same holds for feature-related metrics. Understanding the distribution of these metrics affects our understanding of how Software Product Lines implemented with CPP are built in practice, and how we can extract thresholds from real software systems. For example, if they do follow a power-law distribution, the central limit theorem does not apply, and the sample mean and variance can not be used as estimators of the population mean and variance [Baxter et al., 2006].
2.5
Final Remarks
Chapter 3
Findings and Assumptions on the
Usage of
ifdefs
In this chapter, we present a systematic literature review conducted to identify empiri-cal findings and assumptions on the usage of ifdefs. We start by detailing the protocol that guided our search strategy, the study selection, the data extraction process, and how we organized and classified the findings and assumptions extracted from the liter-ature on ifdefs (Section 3.1). Finally, Section 3.2 discusses our findings.
3.1
Study Design
To identify empirical findings and assumptions on the usage of ifdefs to implement variability in practice, we follow a Systematic Literature Review (SLR) protocol based on the Kitchenham and Charters [2007] guidelines. This SLR aims to address the following research questions:
RQ #1: What are the most common findings related to the use of ifdefs?
RQ #2: What are the most common assumptions related to the use of ifdefs?
3.1.1
Search Strategy
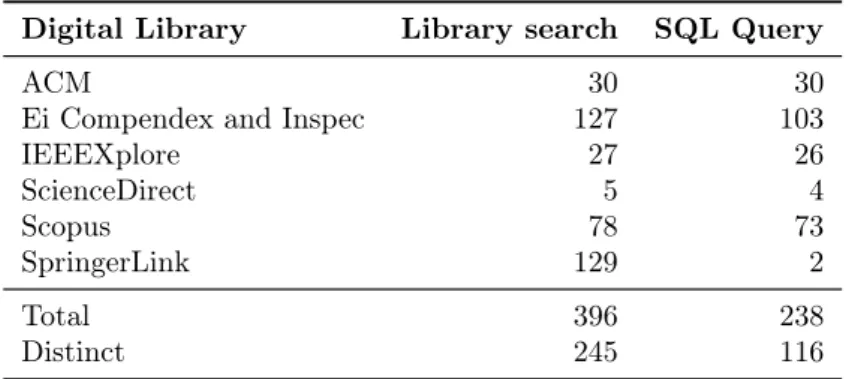
We performed an automatic search in the most relevant digital libraries for potentially relevant studies without restriction on the year of publication to increase the coverage of the review [Brereton et al., 2007; Kitchenham and Charters, 2007]. The selected libraries are as follows:
18 Chapter 3. Findings and Assumptions on the Usage of ifdefs
• ACM Digital Library (http://dl.acm.org)
• Ei Compendex and Inspec (www.engineeringvillage.com)
• IEEEXplore (http://ieeexplore.ieee.org)
• ScienceDirect (http://www.sciencedirect.com)
• Scopus (http://www.scopus.com)
• SpringerLink (http://link.springer.com)
The search was based on the keywords "c preprocessor" and "ifdef", including the variations found in a pilot search. The general search string is given as follows:
"c preprocessor" OR "c pre processor" OR "c++ preprocessor" OR "c++ pre processor" OR "preprocessor for c" OR "pre processor for c" OR ("cpp AND preprocessor") OR ("cpp AND pre processor") OR "ifdef"".
The search was performed within titles or abstracts, following conventional prac-tices [Brereton et al., 2007; Kitchenham and Charters, 2007]. When the library does not provide an option to limit the search within titles or abstracts, the search was per-formed within the full-text. Moreover, the search string was adapted to suit specific requirements or limitations of the different libraries. For example, the filters that can be included in the search string may differ. The corresponding strings used for each library are given in Appendix A.
3.1. Study Design 19
Digital Library Library search SQL Query
ACM 30 30
Ei Compendex and Inspec 127 103
IEEEXplore 27 26
ScienceDirect 5 4
Scopus 78 73
SpringerLink 129 2
Total 396 238
Distinct 245 116
Table 3.1: Number of articles resulting from the search process. The first column lists the search results from the digital libraries; the second column lists the number of papers resulting from the SQL filter.
3.1.2
Study Selection
To select studies from the potentially relevant papers, we applied the following inclusion criteria: (i) studies published in peer-reviewed journals or conference proceedings; (ii) studies in English; (iii) studies that have at least one finding or assumption about the use of ifdefs. All the inclusion criteria had to be satisfied to ensure that the selected study was within our targeted area of research. Some digital libraries provide filtering mechanisms that can be used to restrict the search to the inclusion criteria (i) and (ii) (details of each filter are listed in Appendix A).
To evaluate the inclusion criterion (iii), we manually inspected the 116 poten-tially relevant papers, as follows. Two researchers read the following sections of each paper: Introduction, Conclusion, and any section that reports findings and/or dis-cusses them. They kept track of papers that claim at least one finding concerning ifdef usage, or that make at least one assumption about this usage. We considered as finding any statement about the usage of ifdefs that is based on the results of the study reported in the paper (e.g., Liebig et al. [2010] reports that “programmers use fine-grained extensions infrequently” based on their analysis of 40 preprocessor-based systems). Statements on the usage of ifdefs that are explicitly declared using refer-ences to other papers (e.g., Kenner et al. [2010] reports that “a majority of industrial software product lines are implemented with the C preprocessor” based on the studies from Pearse and Oman [1997]), or as common knowledge (e.g., Feigenspan et al. [2013] reports that “Preprocessor directives are easy to use”) are considered as assumptions. Papers that do not report any finding, nor make explicit assumptions were excluded.
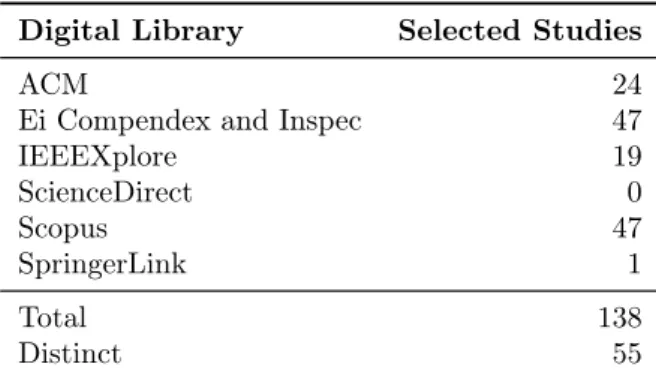
20 Chapter 3. Findings and Assumptions on the Usage of ifdefs
14 articles, resulting in 55 selected studies (see Appendix B). The distribution of the resulting articles among the digital libraries with overlapping and distinct results is given in Table 3.2.
Digital Library Selected Studies
ACM 24
Ei Compendex and Inspec 47
IEEEXplore 19
ScienceDirect 0
Scopus 47
SpringerLink 1
Total 138
Distinct 55
Table 3.2: Number of articles resulting from the selection process after inspection and consensus by two researchers.
3.1.3
Data Extraction
As the first step of the extraction, the author of this master dissertation read the selected papers entirely, keeping record of all the findings and assumptions regarding the use of ifdefs, as originally stated in the paper. In a second step, he rewrote the findings to eliminate redundant results in the same paper and to break different findings or assumptions from a single statement. An example is given as follows:
• Saebjoernsen et al. originally state that “C preprocessor (CPP) is generally con-sidered a source of difficulty for understanding and maintaining C/C++ pro-grams”. [Saebjoernsen et al., 2009]
This assumption regards two different problems: maintainability and understand-ability. We then split it into two different assumptions:
• “CPP is a source of difficulty for understanding C/C++ programs”
• “CPP is a source of difficulty for maintaining C/C++ programs”
3.1. Study Design 21
3.1.4
Data Classification and Ranking
With all the results in a spreadsheet, we identified 17 groups of findings/assumptions. Each finding or assumption could be classified in one or more group (when applicable). These groups with examples of findings or assumptions are listed next:
• Code comprehension (e.g., “Extensive use of the CPP across the code causes adverse consequences for code comprehension”, S44)
• Maintainability (e.g., “CPP leads to source code that is hard to maintain”, S37)
• Error-proneness (e.g., “CPP eases the introduction of subtle syntax errors”, S48)
• Testing (e.g., “As the number of variant features grows, programs become difficult to test”, S24)
• Feature scattering (e.g., “Feature scattering often occurs in practice”, S53)
• Tangling (e.g., “CPP leads to extremely tangled preprocessor code”, S18)
• Nesting (e.g., “Code with nested ifdef directives are hard to identify”, S45)
• Discipline (e.g., “Most of the #ifdefs are disciplined”, S35)
• Granularity (e.g., “Most extensions occur at a high level of granularity, such as if-statements or for-loops)”, S29)
• Performance (e.g., “CPP is often used to tune performance using in-line code”, S22)
• Code replication (e.g., “A minor fraction of all code clones occur within #ifdef ”, S36)
• Portability/reuse (e.g., “Portability accounts for almost half of conditional com-pilation directives”, S11)
• Tooling (e.g.,“There are no refactoring tools that can completely and safely trans-form C code because of the CPP”, S47)
• Variability model (e.g., “Inconsistencies between feature models and feature im-plementations in CPP are common”, S30)
• Coding guidelines (e.g., “Many programmers follow conventions on the use of cpp”, S25)
• CPP alternatives (e.g., “Applicability of alternative mechanisms such as aspects is hard to envision”, S44)
• Miscellaneous (e.g., “For reverse engineers, the connection between the preprocessor input and output is hard to precisely understand”, S12)
22 Chapter 3. Findings and Assumptions on the Usage of ifdefs
• “CPP files can be very difficult to understand” (S07)
• “CPP usage impairs readability of the base system” (S15)
• “CPP mechanisms are known to challenge code comprehension” (S38) These three assumptions were merged in a single assumption:
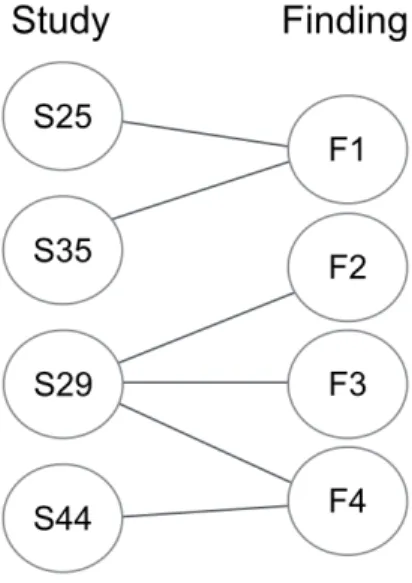
• “CPP has a negative effect on code readability and comprehension”(S07, S15, S38) From the mapping between findings/assumptions and their papers, we created a bipartite graph1
, where papers denote nodes on the left of the graph, and assumptions or findings denote nodes on the right of the graph. The lists of assumptions and findings were prioritized according to the number of its incoming edges as a ranking criteria. As an example, Figure 3.1 shows a graph including only four findings from four studies: S25 [Padioleau, 2009], S29 [Liebig et al., 2010], S35 [Liebig et al., 2011], and S44 [Jbara and Feitelson, 2013]—see Appendix B. The number of incoming edges is used as a ranking criteria, prioritizing the findings mentioned by more studies (e.g., finding F1 and finding F4 are both mentioned by two studies). The resulting ranking of this graph is given in Table 3.3. A similar procedure was performed for the list of assumptions. The final ranking including all findings and assumptions is discussed in Section 3.2.
Figure 3.1: Bipartite graph connecting selected studies and their findings (e.g., finding F1 is reported in studies S25 and S35; study S29 reports findings F2, F3 and F4)
1
3.2. Results 23
Table 3.3: Ranking of findings extracted from selected studies. The number of studies reporting the finding is used as a ranking criteria
Pos ID Finding Degree Studies
1 F1 Most of the #ifdefs are disciplined 2 S25, S35
1 F4 Nested #ifdefs are used moderately 2 S29, S44
2 F2 Few #ifdef extensions would benefit from alternatives like
aspects
1 S29
2 F3 Variability management with cpp does not cause excessive
code degradation
1 S29
3.2
Results
3.2.1
Overview
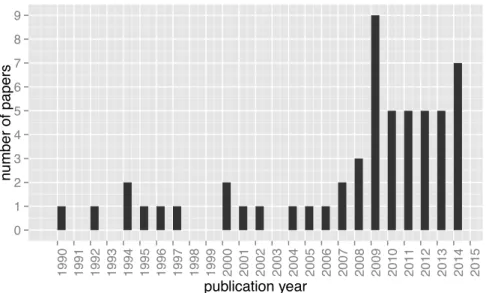
The search and selection processes resulted in 55 studies, which are listed in Ap-pendix B. Figure 3.2 shows the distribution of selected studies over the years. The first study we considered appeared in 1990 and the last one appeared in 2014. As the figure shows, empirical studies regarding the use of the C-preprocessor started to attract more research attention after 2009 (65% of the selected studies were published after 2009), which indicates that this area of research is currently highly active.
0 1 2 3 4 5 6 7 8 9
1990 1991 1992 1993 1994 1995 1996 1997 1998 1999 2000 2001 2002 2003 2004 2005 2006 2007 2008 2009 2010 2011 2012 2013 2014 2015
publication year
n
umber of papers
Figure 3.2: Selected studies over the years
24 Chapter 3. Findings and Assumptions on the Usage of ifdefs
distribution of assumptions and findings degrees. While 79 assumptions (60%) have degree=1 (i.e, they are cited by only one study), 52 assumptions (40%) are cited by, at least, two different studies. Most of the findings (46, 79%) are cited by only one study (degree=1). This was expected, since many results are very specific. However, we did find similar results regarding 12 findings (21%).
Interestingly, the most common assumptions identified in our study (assump-tions with degree>10) are confirmed or strengthened by some of the most common findings. The best ranked assumptions, findings, and their correlations are discussed in Sections 3.2.2 and 3.2.3.
0 10 20 30 40 50 60 70 80
0 1 2 3 45 6 7 8 9 10 11 12 13 14 15 16 17 18 19 20 21 22 23 24 25 26 27
degree (number of studies)
frequency
(a) assumptions
0 5 10 15 20 25 30 35 40 45
0 1 2 3 4 5 6
degree (number of studies)
frequency
(b) findings
Figure 3.3: Distribution of assumptions degree (a) and findings degree (b)
3.2.2
Best Ranked Assumptions
The most common assumptions of our study are as follows:
Assumption A001: “CPP is heavily used to implement variability” (Studies S06, S07, S09, S15, S17, S18, S21, S23, S24, S25, S28, S29, S30, S32, S33, S34, S38, S39, S41, S42, S45, S46, S47, S48, S49, S52, S55)
3.2. Results 25
Assumption A002: “CPP has a negative effect on code readability and comprehen-sion” (Studies S01, S02, S06, S07, S10, S11, S12, S15, S21, S22, S23, S27, S28, S33, S34, S36, S37, S38, S44, S45, S46, S47, S48, S55)
The second ranked assumption (A002) has degree=24 and is also shared by almost half of our studies (44%). These studies are distributed over an even wider range of years, from 1990 (S01) to 2014 (S55). This assumption concerns a recurrent problem on CPP usage: code comprehension. While some studies (S34, S36, S44) consider that CPP reduces readability or comprehensibility, other studies consider that preprocessor directives can be very hard or impossible to understand. For example, Study S06 states that “the presence of numerous #if directives makes the structure almost impossible to follow. Human readers are not able to take into account all the variants at a time”.
Assumption A003: “CPP impairs maintainability of code” (Studies S02, S06, S07, S08, S11, S12, S17, S21, S23, S27, S28, S29, S34, S36, S37, S49, S54)
The third ranked assumption (A003) has degree=17 and is also distributed over a wide range of years, from 1992 (S02) to 2014 (S54). This assumption is related to assumption A002, and highlights the lack of maintainability as a consequence of many problems caused by CPP directives in source code. As an example, S02 states that “preprocessor commands can obfuscate the program’s mechanics and, consequently, maintainability”. S06 states that “maintenance of complex preprocessor files is a nightmare”.
Assumption A004: “CPP is error-prone” (Studies S09, S13, S14, S21, S28, S29, S36, S38, S41, S43, S48, S49, S55)
The fourth ranked assumption (A004) has degree=13 and ranges from 2000 (S09) to 2014 (S55). Many studies state that the preprocessor can introduce subtle syntax errors in the host language, making variability implementation error-prone.
26 Chapter 3. Findings and Assumptions on the Usage of ifdefs
The fifth ranked assumption (A005) has degree=11 and ranges from 1992 (S02) to 2014 (S52). As the studies suggest, portability has traditionally been obtained with ifdefs. S16 suggests that C/C++ programs invariably achieve portability using the C-preprocessor: “in C and C++ programs portability is invariably managed using the CPP”.
3.2.3
Best Ranked Findings
The most common findings of our study are given as follows:
Finding F01: “CPP is heavily used to implement variability” (Studies S11, S22, S29, S38, S44, S52)
The first ranked finding (F01) is also the most common assumption A001, and is supported by six studies (degree=6). All these studies evaluate the preprocessor usage in real systems. Combined, they analyzed the preprocessor usage in more than 100 systems and packages, including implementations in C and FORTRAN, from different functional domains. The results confirm that despite all the criticism, the C preprocessor and its conditional compilation mechanisms are widely used to implement variability in program families, supporting assumption A001.
Finding F02: “Alternative mechanisms to cpp such as aspects are hard to envision” (Studies S18, S29, S44)
3.2. Results 27
Finding F03: “CPP introduces errors to code” (Studies S13, S48, S49)
The second ranked finding F03 also has degree=3 and is similar to the as-sumption A004. Study S48 performs an empirical study in 41 program family releases, and more than 51 thousand commits of 8 program families. They found 20 preprocessor-based syntax errors in commits, and 7 in releases. Study S49 analyzes releases of 12 C program families and found that incomplete annotations can cause semantic errors and also memory leaks. These findings confirm assumption A004.
Finding F04: “Most of the #ifdefs are disciplined” (Studies S25, S35, S52)
The second ranked finding F04 has degree=3. Although preprocessors are frequently criticized for their undisciplined usage, these findings reveal that most of the ifdefs are in disciplined form. These findings confirm assumption A012—“In practice most annotations are already in a disciplined form” (S28, S20, S32, S46, S49).
The following findings have degree=2, but are related to the high ranked assumptions A002, A003 and A005:
Finding F05: “CPP annotations complicate program comprehension” (Studies S44, S46)
Finding F05 confirms assumptions A002 and A003. Ranked in the third position, this finding is shared by two studies. Study S44 performs an analysis of the Linux kernel, including the configurability model and the source code. They found nearly 5000 real config options, suggesting extensive use of the CPP across the code. Study S46 is a controlled experiment with human subjects. They measured program comprehension evaluating the performance of the subjects regarding correctness and re-sponse time for solving tasks in annotated code. The experiment confirms that finding errors in the presence of preprocessor annotations is a tedious and time-consuming task.
28 Chapter 3. Findings and Assumptions on the Usage of ifdefs
The third ranked finding F10 confirms assumption A005. Study S11 analyzes 26 packages comprising 1.4 million lines of source code to evaluate C-preprocessor usage. The study reveals that portability accounts for 37% of conditional compilation directives (e.g., ifdefs used to enclose specific capabilities of the target machine or operating system). Study S32 evaluate an open-source web server with a type-checking tool (TypeChef). They found ifdefs implementing variability that can be both considered a feature in the sense of a product line and low-level portability. These findings confirm assumption A005.
3.3
Final Remarks
In the systematic literature review reported in this chapter, we searched and selected studies containing assumptions and findings regarding the usage of ifdefs. The high number of studies found in recent years reveals howifdefs are attracting more research attention. Based on data extracted from these studies, we ranked the results to identify the most common assumptions and findings reported in the literature. The results reveal how the most common assumptions identified in our study are confirmed or strengthened by some of the most common findings.
Chapter 4
The Shape of Feature Code
To reveal how feature annotations are used in source code, and how to extract thresh-olds to monitor and prevent excessive usage, we performed a study analyzing twenty C-preprocessor-based open-source software systems. In this study we analyzed the sta-tistical distribution of scattering, tangling, and nesting degrees and propose thresholds for the metrics we studied, which are derived such that they respect the statistical distributions we have observed.
In this chapter, we start by presenting the methodology to perform our study, including the subject systems, the process and tools we used to compute the feature-related metrics, and the procedure we followed in the statistical analysis of the collected data (Section 4.1). Next, Section 4.2 presents our results for the collected metrics, including a discussion on the statistical distributions that best describe our data. Sec-tion 4.3 discusses implicaSec-tions of our findings, in particular, regarding the extracSec-tion of thresholds for feature-related metrics. Section 4.4 reports threats to validity. Finally, Section 4.5 summarizes our findings and states our final remarks.
The study presented in this chapter has been preliminary published at a workshop [Queiroz et al., 2014] and later extended to a journal [Queiroz et al., 2015].
4.1
Methodology
In this section, we discuss the selection of subject systems (Section 4.1.1), the process and tools to compute feature-related metrics (Section 4.1.2), the statistical analysis of the data we collect (Section 4.1.3), and the method we use to propose thresholds (Section 4.1.4).
30 Chapter 4. The Shape of Feature Code
Table 4.1: Subject systems
System Version Year Since Domain SLOC
vi2
50325 2005 2000 Text editor 22 275
lighttpd 1.4.35 2014 2003 Web server 39 991
xfig 3.2.5c 2013 1985 Graphics editor 74 713
sendmail 8.14.9 2014 1983 Network service 92 204
sylpheed 3.4.2 2014 2000 E-mail client 116 454
git 2.1.0 2014 2005 Version control 152 018
apache 2.4.10 2014 1995 Web server 155 846
libxml2 2.9.1 2014 1999 Programming library 222 009
emacs 24.3 2013 1985 Text editor 249 932
openldap 2.4.39 2014 1998 Network service 291 781
subversion 1.8.10 2014 2000 Version control 328 878
imagemagick 6.8.9-7 2014 1987 Image editor 333 048
python 3.4.1 2014 1989 Program interpreter 353 485
php 5.6.0 2014 1985 Program interpreter 664 259
postgresql 9.3.5 2014 1995 Database system 676 435
gimp 2.8.14 2014 1996 Image editor 703 435
glibc 2.20 2014 1987 Programming library 826 502
mysql 5.6.19 2014 1995 Database system 1 577 874
gcc 4.9.0 2014 1987 Compiler framework 3 209 684
linux kernel 3.15 2014 1991 Operating system 11 964 075
4.1.1
Selection of Subject Systems
To analyze the statistical distributions describing feature-related metrics, we selected 20 open-source software systems that use C preprocessor directives to annotate feature code; Table 4.1 provides information on all subject systems.
Three criteria guided the selection of our subjects: First, we aimed at covering multiple application domains, therefore avoiding bias toward an specific domain. In Table 4.1, the 20 systems are distributed across 12 different domains. Second, each system has substantial history of development and use, as given by columnsYear (the year of the release of the system under analysis) andSince (the year of the first release). The rationale is that mature systems are more likely to have found a practical balance to when and how much to scatter, tangle, and nest preprocessor annotations than immature systems. Third, the selection includes systems of different sizes, to avoid bias toward a particular system size. We measured size using Source Lines of Code (SLOC), which is the total number of source lines of code of a given system. These numbers excludes blank lines and comments. Moreover, sequences of multilines (lines ending with a backslash) are counted as a single line.1
1
Multilines are convenient when spanning a long line across multiple ones; during compilation, sequences of multilines are taken as a single line.
2