A¢rmative action in university admission
and high school students’ pro…ciency
Bruno Ferman
Juliano Assunção
Department of Economics, PUC-Rio
September, 2005
Abstract
Economic theory suggests that a¢rmative action can either reduce or enhance incentives to invest in human capital. Empirical evidence on this matter, however, is still lacking. Using ‘di¤erence in di¤er-ence’ estimates, this paper evaluates the e¤ects of the quota system in the admission to Brazilian public universities on the pro…ciency of high school students. Our …ndings show that favored groups attained lower scores, suggesting a negative link between a¢rmative action and incentives for e¤ort and skill acquisition.
Introduction
Is a¢rmative action good or bad? What are the economic consequences of such policies? Do they undercut incentives? At …rst glance, it may seem that a¢rmative action only reduces the inequality between minority-majority groups to the detriment of economic e¢ciency. However, some theoretical arguments suggest that the e¤ects of such policies are more complex.
discrimination. In this context, a¢rmative action may serve to improve eco-nomic e¢ciency by encouraging minority groups to invest in their education. Notwithstanding, Coate & Loury (1993a, 1993b) state that there may be a reduction in investment incentives if …rms are obliged to contract less quali-…ed minority employees in order to meet a¢rmative action targets.
According to Fryer & Loury (2005), “it is theoretically possible that the existence of a¢rmative action could reduce incentives for e¤ort and skill ac-quisition in the targeted group, because the policy could make e¤ort and skill less important for achieving successful outcomes. On the other hand, a¢r-mative action could enhance incentives for the targeted group by creating a situation where opportunities previously thought of as out of reach come to be perceived by the applicant as attainable, and thus worth the expenditure of e¤ort to pursue.” Moreover, “con…dent a priori assertions about how af-…rmative action a¤ects incentives are unfounded. Indeed, economic theory provides little guidance on what is ultimately a subtle and context-dependent empirical question. First principles, commonsense intuitions, and anecdotal evidence are simply inadequate to the task here.”
In this paper, we explore the initiative of some Brazilian public univer-sities in introducing a system of quotas in their admission procedures as a unique opportunity to evaluate the e¤ects of such a¢rmative actions. Such procedures, introduced in 2002, were restricted to three institutions until 2004: two universities in the State of Rio de Janeiro, the “Universidade Es-tadual do Rio de Janeiro” (UERJ) and the “Universidade Estadual do Norte Fluminense” (UENF); and one in the State of Bahia, the “Universidade do Estado da Bahia” (UNEB). In the 2003 selection process, 50% of the admit-ted students in UERJ and UENF had to have attended public schools and 40% had to be black or mulatto. In the 2004 selection process, 20% of the admitted students had to have attended public schools, 20% had to be black and 5% had to be students with disabilities. For UNEB, in the 2003 entry process and in the 2004 entry process, 40% of the admitted students had to be black or mulatto and had to have attended public schools.
We document the impact of these quota systems on the academic pro…-ciency of favored high school students. We have used the methodology of dif-ferences in di¤erences, exploiting the characteristics of this quasi-experiment to build two distinct comparison groups.
states to attend undergraduate school in Brazil is very low, these students were not a¤ected by the quotas implemented in Rio de Janeiro and Bahia.
The second comparison group comprises non-favored students from states that had introduced a system of quotas in this period. It can be argued that these students were less a¤ected by these policies since there were also other public and private universities which had not implemented any system of quotas during this period. Although this hypothesis may appear controver-sial, our estimates suggest that, in fact, the impact of these systems of quotas on non-favored groups were not statistically di¤erent from zero.
Evaluating scores from senior high school students, our …ndings are that, in Rio de Janeiro, the scores of black students in public school were 5.7% lower as a consequence of the introduction of these quotas. In Bahia, the estimated e¤ect of this policy on the favored group (black or mulatto public school students) was a reduction in their scores of roughly 2.7%. These results are independent of the comparison group used.
Like every study in economics which does not employ designed experi-ments, our analysis is subject to limitations. We have considered therefore di¤erent alternatives in order to check the robustness of the results. First, we show that the estimated impact of these systems of quotas on non-favored students in Rio de Janeiro and Bahia was insigni…cant. Second, we evaluate whether the pro…ciency of favored junior high school students changed from 2001 to 2003. Since it is reasonable to expect these students to be less af-fected than senior high school students by these systems of quotas, but to be equally a¤ected by other states’ unobserved characteristics, this provides a useful check for our identi…cation hypothesis.Third, using data from 1999 and 2001, we tested if our results were driven by a time tendency, rather than by the systems of quotas implemented since 2002. Finally, the fact that some schools were surveyed both in 2001 and 2003 enabled us to control for unobserved characteristics of these schools.
We believe that our results contribute to a better understanding of the (ambiguous) relationship between a¢rmative action and incentives for e¤ort and skill acquisition. Empirical evidence on this matter is lacking, even considering the experimental study of Schotter & Weigelt (1992). Although we could not assess the total e¤ect of these quota systems on the economy, we have documented a (statistically signi…cant) negative e¤ect on incentives for e¤ort and skill acquisition.
universities. Section 2 discusses theoretical issues regarding a¢rmative action and the incentive to learn. Section 3 describes the data with some basic statistics. Section 4 shows our empirical strategy, explaining the choice of the two comparison groups. Section 5 depicts the main empirical results for Rio de Janeiro and Bahia. Section 6 proceeds with robustness checks, and …nally there are some concluding remarks.
1
Quotas in Brazilian Public Universities
The Brazilian public educational system is characterized by a combination of low quality schools and high quality universities, all of which free. The consequence of this is that few public school students are admitted to public universities, especially for highly demanded courses such as medicine, odon-tology, and engineering.1
To be admitted to a public university in Brazil the student must pass an admission test called the “vestibular” - there is no subjective assessment of the student. Public school students …nd it more di¢cult to get into a public university because of their lower level of education. As the vast majority of black students attend low quality public schools, only a few are admitted to public universities.
In 2002, two public universities from Rio de Janeiro, UERJ and UENF, and one from Bahia, UNEB, introduced a system of quotas in their selection process. In UERJ and UENF, in the 2003 process, the system was imple-mented by the government, without the consent of the universities. There were two laws that passed to regulate this. The …rst law stated that 50% of the admitted students had to have attended public schools, while the second one stated that 40% of the admitted students had to be (self-reported) black or mulatto. In the 2004 process, 20% of the admitted students had to have attended public schools, 20% had to be (self-reported) black and 5% had to be students with disabilities.
At the beginning of 2003, several news reports were published about the results of the UERJ and UENF 2003 admission process. First, data was presented showing that some favored students had been admitted with extremely low grades in the “vestibular” exam. In its edition of 02/08/2003, the newspaper “Folha de São Paulo” showed that the last non-favored student
1In Brazil, di¤erent from the United States, students choose their major before entering
admitted in the odontology course scored 77.5 points out of a total of 100 points, while the last favored student admitted in the same course scored only 6.25 points. Moreover, the last favored student admitted in the civil engineering course scored 4 points, and last favored student admitted in the mathematics course scored 12 points.
The dissemination of this data certainly engendered a belief among fa-vored students that it was not necessary to get a high score in the “vestibular” exam to be admitted to these public universities.
Secondly, during this period there was a …erce discussion about how the system of quotas should be implemented for the 2004 admission process, and there was uncertainty about which groups of students should be favored. In fact, changes were made in the UERJ and UENF’s system of quotas, and mulattos were no longer favored.
In UNEB, a system of quotas was implemented at the initiatives of the university itself. In both 2003 and 2004 admission processes, it was stated that 40% of the admitted students had to be (self-reported) black or mulatto and had to have attended public schools. In general, the Brazilian press did not covered the results of the UNEB’s system of quotas as they covered the results of UERJ and UENF’s system of quotas.
2
Quotas and Incentive to Learn
As the theoretical literature points out, it is likely that these a¢rmative action policies are changing incentives for e¤ort and skill acquisition among favored high school students in Brazil, because there is a higher probability that they will be admitted to those public universities (that implemented a system of quotas). In other words, the probability of being admitted to these universities increases for any given level of e¤ort.
make as much e¤ort to gain entry to university. Thus, to encourage students to study, the entry requirement for inclusion in the quota system must be neither too demanding nor too lax.
As the system of quotas makes knowledge and e¤ort less important to the outcome, if favored students are already trying to be admitted to university, and are making positive e¤orts by studying hard, it is likely that it will diminish their incentives to learn, especially if e¤ort is costly and the system of quotas is too lax.
As pointed by Fryer & Loury (2005), the net impact of a system of quotas on favored students’ incentive to learn is, a priori, ambiguous. In what fol-lows, we study one aspect of this relationship using the Brazilian experience with the quota system.
3
Data
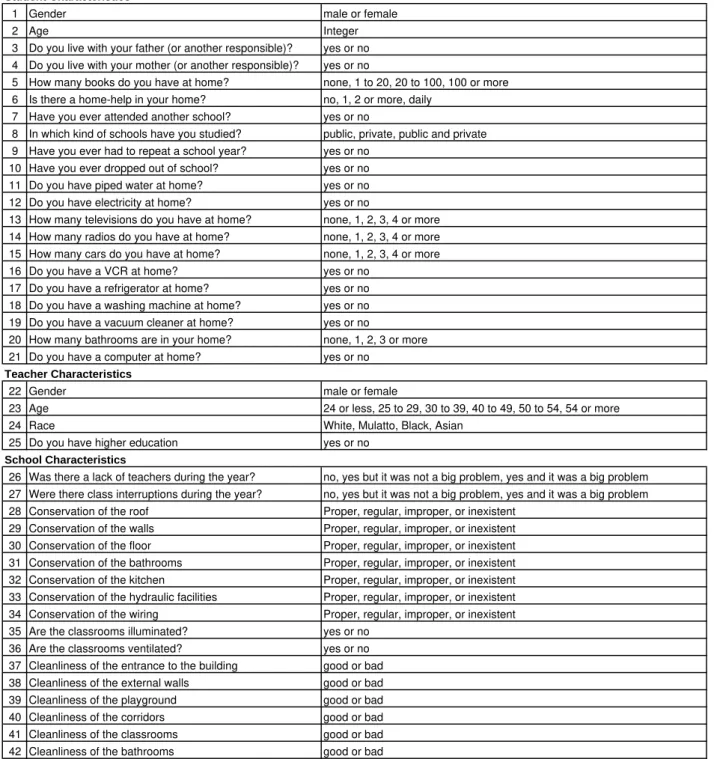
Our empirical analysis relies on the “Sistema Nacional de Avaliação da Ed-ucação Básica” (SAEB) survey data of 2001 and 2003. The data is a repre-sentative sample from elementary, junior high, and senior high school, con-sisting of about 300,000 students for each year. Each student’s pro…ciency is evaluated through a Math or Portuguese exam. It is important to note that the SAEB’s exam is totally independent of the university’s admission exam (the vestibular). The pro…ciency measure is comparable over time as it is calibrated through the ‘item response theory’ methodology. The sur-vey instrument contains a wide variety of information on the characteristics of students, teachers, and schools. Table 1 presents the description of the variables considered in our study.
[Table 1]
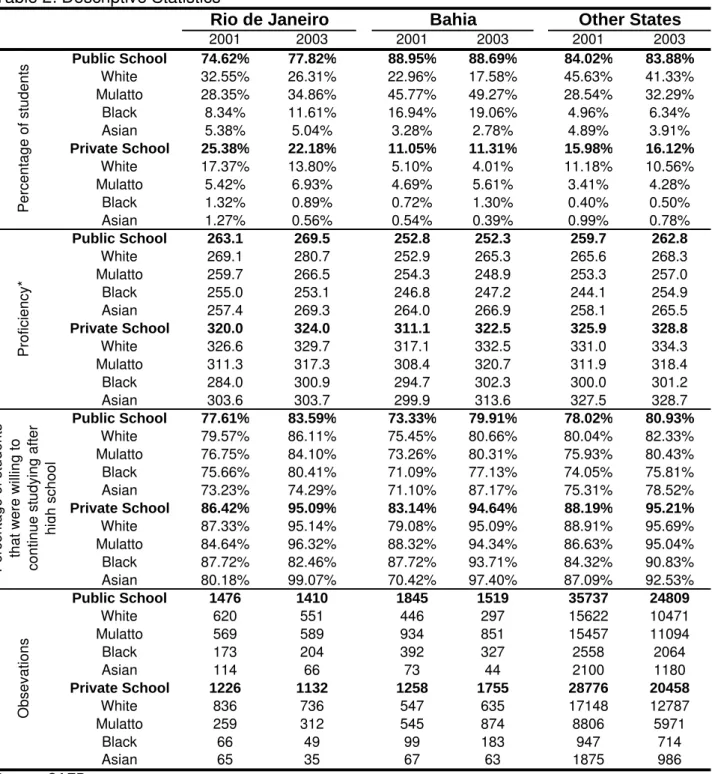
It can be seen from table 2 that the proportions of blacks and mulattos in public schools of Rio de Janeiro do not di¤er from those in other states, while these percentages are much higher in Bahia. The increase in the indicators from 2001 to 2003 in Rio de Janeiro and Bahia could, in principle, represent a change in the way students were describing themselves in order to be included in the program. However, we can reject this possibility for at least two good reasons. First, there is an overall and equivalent increase in the indicators for the remainder of the country, suggesting this is more related to a survey problem than something determined by the introduction of quotas. Second, a student could only bene…t from declaring himself as black or mulatto on the university’s application form, and not on the SAEB’s questionnaire.
[Table 2]
Table 2 also depicts pro…ciency means of these groups of students. As ex-pected, the pro…ciency of public schools is lower than that of private schools. Moreover, except in Bahia’s public schools, the pro…ciency of whites is, on average, higher than that of blacks and mulattos, even after controlling for the type of school.
Another important statistic presented in table 2 concerns whether these students wanted to continue or to stop studying after senior high school. As shown in Section 3, the incentive e¤ects of these quotas were more likely to be positive if favored students were not already trying to get into university in the absence of a system of quotas. Table 2 shows that, even in public schools, more than 70% of the students answered that they wanted to con-tinue studying after senior high school in 2001. These percentages increased for all groups of students (both favored and non-favored) analyzed in 2003. We do not believe therefore that these changes were due to the system of quotas.
4
Empirical Strategy
2003) with the same di¤erence before these systems of quotas were imple-mented (in 2001).
A public university …rst implemented a system of quotas in the 2003 ad-mission process (the vestibular exam for this process took place in 2002). Consequently, senior high school students surveyed in 2001 were not eligible to be favored in any system of quotas when they were taking their admis-sion exams. Moreover, as rumors of a possible system of quotas in public universities only started to circulate at the beginning of 2002, it is unlikely that senior high school students adopted any kind of anticipation strategy by 2001.
Rio de Janeiro and Bahia’s senior high school students surveyed in 2003, on the other hand, were taking the 2004 vestibular exams at a time when a system of quotas had been implemented in some public universities of their states. They also knew that these public universities had applied a system of quotas in the previous admission process. These dates are summarized in the timeline below.
2001 2002 2003
• SAEB’s 2001 survey
• 2003 vestibular exams
• 2004 vestibular exams
• SAEB’s 2003 survey
2001 2002 2003
• SAEB’s 2001 survey
• 2003 vestibular exams
• 2004 vestibular exams
• SAEB’s 2003 survey
Timeline
The …rst comparison group consists of favored group’s counterpart from states which did not introduced a¢rmative action before 2004. It is impor-tant to note that it is unlikely that these students tried to be favored by these systems of quotas. In Brazil, each university has its own admission exam, and it generally takes place in the state where the university is located – this is true for UERJ, UENF, and UNEB. Consequently, the cost of taking this admission exam reduces the possibility that students, especially those who are poor, will try to get into universities in other states.
Table 3 displays the percentage of undergraduate students who had pre-viously lived in another state. This information is taken from the “Pesquisa Nacional de Amostra Domiciliar” (PNAD) for the years of 2001, 2002, and 2003. While these statistics do not show exactly the percentage of undergrad-uate students who migrated to attend undergradundergrad-uate courses, this statistics are de…nitely an upper bound. In Rio de Janeiro, only 5.49% of undergrad-uate students had lived in another state at some time, while in Bahia this percentage is higher, at 11.07%. This percentage falls to 6.08% when only black students are taken into account. In summary, this data clearly shows that the number of students who migrate from their states to attend univer-sity in Brazil is very low, especially when compared with the United States.2
It is reasonable to assume therefore that students from outside Rio de Janeiro and Bahia were not a¤ected by these systems of quotas.
The second comparison group is comprised of non-favored students from Rio de Janeiro and Bahia. Since there were also other public and private universities which had not implemented any system of quotas during this period, it can be argued that the bene…ts granted to favored students were higher than the disadvantages imposed to non-favored students. For example, in Rio de Janeiro, UERJ and UENF admit 5664 students per year, of which about 2550 vacancies are for favored students. There are two other public universities in Rio de Janeiro (which did not employ a quota system) that admit a total of 9799 students per year. Thus, reserved vacancies correspond to roughly 17% of the vacancies in public universities. This percentage is even lower if we take into account private universities. Thus, it can be argued that the impact of these systems of quotas was higher for favored than for non-favored students. By analogy, if you drive to a parking lot and …nd that it is full up, the fact that there are free spaces for the cars of disabled drivers will not make any di¤erence to your decision to stay or leave. However, these spaces certainly in‡uence the decision of disabled drivers. As this hypothesis could be considered controversial, it is tested in Section 6.
Finally, some characteristics of the treatment group must be stressed. First, to be eligible to be included in the quotas as a public school student, both in Rio de Janeiro and Bahia, students should have completed all of their senior high school years in a public school. Since rumors of the possibility of a system of quotas in public universities started to circulate only at the
2According to the U.S. Department of Education, 17% of …rst-time freshmen enrolled
beginning of 2002, the decision about whether to enroll in a public or private school for students who were doing their third senior high school year in 2003 was not a¤ected by such rumors.
Moreover, we must consider if favored third year senior high school stu-dents surveyed in 2003, in Rio de Janeiro and Bahia, were enrolled in senior high school because of these systems of quotas, since the new admission pro-cedures increased the payo¤ of attending senior high school for the target group. It must be noted, however, that these students were attending their second senior high school year in 2002. Since drop out is more likely to occur when students complete junior high school and are expected to start senior high school than when they are already attending senior high school, it is unlikely that this is a major problem. According to PNAD, the number of students who stopped attending school after completing junior high school is roughly four times greater than the number of students who stopped studying in the …rst or the second senior high school year.
The basic DID estimate of the e¤ect of these quota systems on the pro-…ciency of favored students is obtained from the following ordinary least squares regression:
yi =c+ d
2003
i + d
T reat
i + d
2003
i d
T reat
i + 0Xi+"i;
where yi refers to the logarithm of the pro…ciency variable; d
2003
i indicates
whether studentiwas surveyed in 2001 or 2003;dT reat
i indicates whether stu-dent i belongs to the treatment or comparison group; and Xi is a vector of student, school, and teacher characteristics. The coe¢cient of interest is re-lated to the interaction betweend2003
i andd
T reat
i , , which can be interpreted as the average impact of the treatment on the treated - the percentual vari-ation of pro…ciency of favored students due to the introduction of the quota system.
5
Empirical Results
5.1
Rio de Janeiro
were very low. Second, they reported the possibility of changes in the con-…guration of the quota system, and this raised doubts among students as to whether or not certain classes of students would be eligible for inclusion in these quotas.
In Rio de Janeiro, only white and Asian students in private schools had no doubt about their status, since they would certainly not be favored. Black public school students were more likely to be favored, since they could be eligible if the system of quotas were either for black students, or for public school students, or both. All other groups could be signi…cantly a¤ected depending on whether quotas were established exclusively for black students or public school students. Consequently, di¤erent groups could, in principle, react di¤erently to the system of quotas.
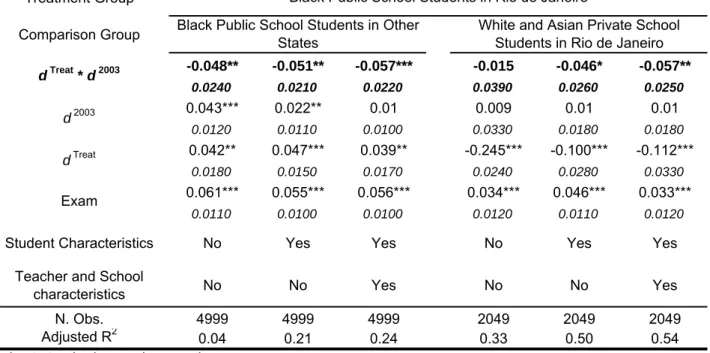
Table 4 shows estimates of the model using black students in public high schools in Rio de Janeiro as the treatment group. Estimates in columns 1 and 4 consider, as comparison groups, black students in public high schools of states that had not implemented a system of quotas during this period, and white and Asian students in private schools in Rio de Janeiro, respec-tively. No student, school, and teacher control variables were included. The estimated e¤ect on pro…ciency of being favored by the system of quotas is a reduction of 4.8% (signi…cant at 5%) or 1.5% (non-signi…cant at 10%), depending on the comparison group used.
[Table 4]
However, these results simply re‡ect the di¤erence of the di¤erence be-tween the pro…ciency mean of the treatment and comparison groups after these systems of quotas were implemented with the same di¤erence before these systems of quotas were implemented. These results must be analyzed with caution. They may re‡ect changes in the composition of the groups or changes in factors other than e¤ort that a¤ect the pro…ciency of the students. Columns 2 and 5 of table 4 show the same regressions where student characteristics were included. Among these characteristics, were indicators of student wealth, such as the number of televisions, the number of cars, and the number of bathrooms students have. Other characteristics considered were students’ ages, if students had ever repeated a year, and if student had ever dropped out of school.
(signi…cant at 5%) or 4.6% (signi…cant at 10%), depending on the comparison group used.
Another inherent problem of this analysis is that the fact that states other than Rio de Janeiro did not implemented a system of quotas during this period may re‡ect di¤erences between Rio de Janeiro and other states that a¤ect the pro…ciency of students. For example, government educational policies concerning public schools that may be correlated with the implemen-tation of this system of quotas and a¤ect student pro…ciency. To mitigate this problem, characteristics of schools and teachers were included in the re-gressions. Such characteristics included cases of class interruption and lack of teachers during the year. Moreover, there are a series of variables concerning school facilities, and teacher pro…le.
Results of these regressions, using two comparison groups, are presented in columns 3 and 6. The estimated e¤ect on pro…ciency of being favored by the system of quotas is a reduction of 5.7%, regardless of the comparison group. These coe¢cients are statistically di¤erent from zero at 1% or 5% signi…cance level, depending on the comparison group used.
In fact, a reduction in favored students’ incentives to learn is reasonable if one takes into account the scenario in which this system of quotas was implemented. First, more than 75% of the black students in public schools surveyed in 2001 said that they would like to continue studying, even though in 2001 there was no system of quotas. Consequently, it is probable that only few students decided to try to be admitted as a consequence of this system of quotas, which could have lead to an increase in student e¤ort. Furthermore, as stated in section 1, these students believed the score necessary for admit-tance to be extremely low, and this lead to a reduction in their incentives to learn, as studying is costly.
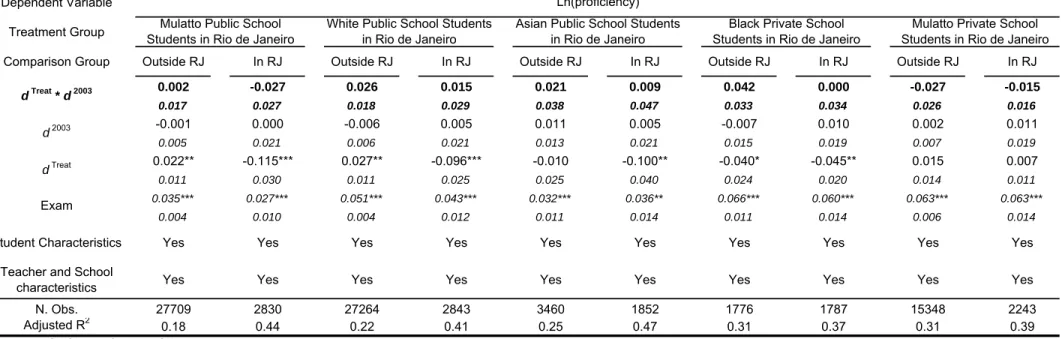
Table 5 displays the results of the model with other groups that were, or that could have been, favored in the 2004 UERJ and UENF’s admission process. None of these groups presents a statistically di¤erent from zero e¤ect of this system of quotas. These results may re‡ect the fact that these students were not sure that they would be eligible for inclusion in these quotas, and therefore did not want to run the risk of reducing e¤ort and then not being eligible.
Moreover, it is important to note that the percentage of black students in Rio de Janeiro is roughly 10%, and that 90% of these are public school students. More than 65% of the students in public schools of Rio de Janeiro are mulatto, white, or Asian. Since the system of quotas established that 20% of the admitted students should be black, and 20% of the students should be public school students, it means that there were relatively more quotas for black students than for public school students. If this fact was anticipated by these students, it is reasonable to assume that the e¤ect of these quotas was higher for black public school students.
5.2
Bahia
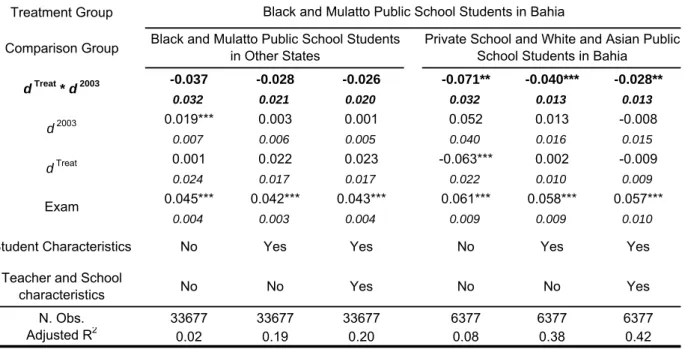
The system of quotas implemented by UNEB favored black and mulattos in public schools alike. Table 6 is analogous to Table 4 and presents estimates of the model using blacks and mulattos in public schools in Bahia as the treatment group.
[Table 6]
The regression displayed in columns 3 and 6 include the full vector of student, school, and teacher controls. The estimated e¤ect on pro…ciency of being favored by the system of quotas is a reduction of 2.6% or 2.8%, depending on the comparison group used. Note that these two coe¢cients are almost equal, although only the second is statistically di¤erent from zero. Although our estimates suggest that the impact of quotas on incentives to learn in Bahia is also negative, the magnitude of this e¤ect is lower than in Rio de Janeiro. These results may re‡ect the fact that the repercussion of the previous admission exam in Bahia was considerably lower than in Rio de Janeiro. Consequently, it may be the case that blacks and mulattos in public schools were not aware that they were eligible to meet these quotas. Moreover, news reports about the admission exam scores of the favored and non-favored students admitted in the previous year were only released in Rio de Janeiro. Thus, unlike favored students in Rio de Janeiro, Bahia’s favored students did not believe strongly that the necessary score for admittance was extremely low.
students. On the other hand, the situation in Rio de Janeiro is very di¤erent in that 20% of UERJ and UENF’s vacancies were reserved for blacks, who make up only 10% of Rio de Janeiro’s student population.
6
Caveats and Speci…cation Checks
In this section, we check some of the hypothesis that were assumed through-out the previous analysis.
6.1
The e¤ect of quotas on non-favored students
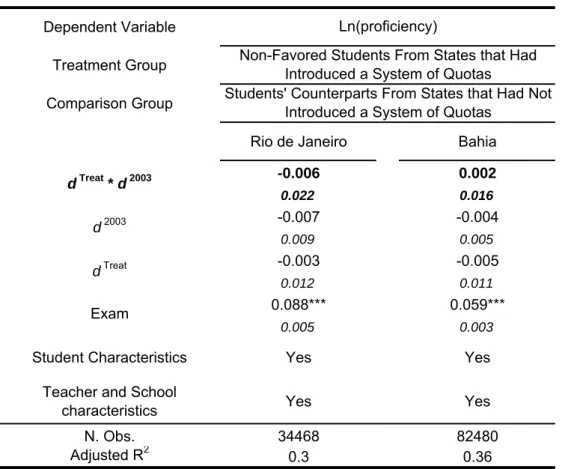
The consistency of our estimates when using non-favored students from Rio de Janeiro and Bahia relies on the hypothesis that these students’ incentives did not change, or, at least, that they were less a¤ected than favored students. Although it may seem that non-favored students were as a¤ected as fa-vored students, since the probability of their being admitted to universities that implemented a system of quotas decreased, it has been argued that they were less a¤ected than favored students as there were also other public and private universities in the same state that had not implemented any system of quotas during this period. This hypothesis may be checked by comparing the pro…ciency of non-favored students from states that had introduced a system of quotas with the pro…ciency of their counterparts from states that had not introduced a system of quotas.
Columns 1 and 2 of table 7 display the estimates for Rio de Janeiro and Bahia, respectively. For both states, the estimated e¤ects of these quotas on non-favored students are virtually zero, supporting the hypothesis that non-favored students were not signi…cantly a¤ected.
[Table 7]
6.2
Unobserved characteristics of states
could have lowered even though their e¤orts remained constant. This prob-lem was partially addressed by including variables related to characteristics of schools and professors in the regressions.
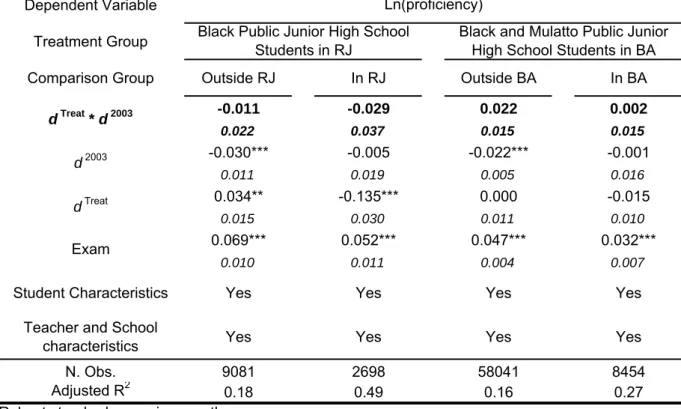
In this section, we evaluate whether the pro…ciency of favored junior high school students changed from 2001 to 2003. As these students were three years from taking their admission exams, it is likely that their incentives to learn were less a¤ected than favored senior high school students’. Nonethe-less, both senior and high school students are equally a¤ected by some state characteristics that a¤ect pro…ciency. If previous results were driven by un-observed state characteristics, then it is likely that junior high school students would display the same pattern.
Table 8 displays DID estimates for junior high school students in Rio de Janeiro and Bahia, using two comparison groups for each state. None of these DID coe¢cients is statistically di¤erent from zero. These results suggest that our senior high school student estimates were not driven by changes in unobserved state’s characteristics.
[Table 8]
6.3
Time Trend
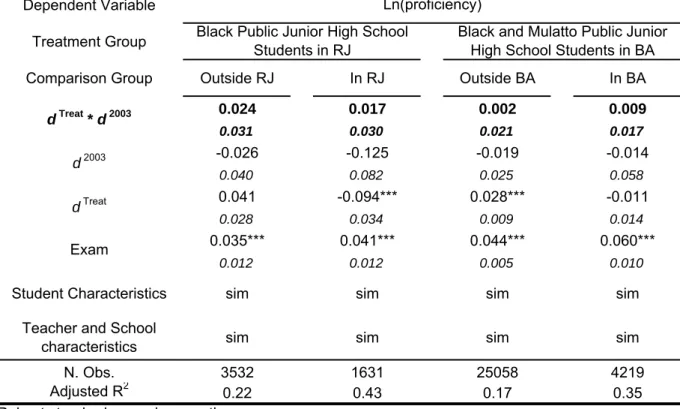
Another caveat that we should be aware of is whether this lower pro…ciency of favored students occurred after the implementation of these quota systems or whether there was a negative trend in the pro…ciency of these students even before these quota systems were implemented.
To deal with this problem, we estimate a DID model with data from 1999 and 2001.3 As we have already stated, there were no quota systems in any
Brazilian public university in 1999 and 2001. Neither were there any rumors concerning such systems. Thus, if there was not a negative trend in the pro…ciency of favored students, it can be expected that the DID coe¢cient will not be statistically di¤erent from zero.
Table 9 displays these estimates. As expected, none of the DID coef-…cients are statistically di¤erent from zero, suggesting that changes in the pro…ciency of favored students took place after the implementation of these quota systems.
3It was not possible to include all of the control variables used in the previous analysis
[Table 9]
6.4
Unobserved School Characteristics
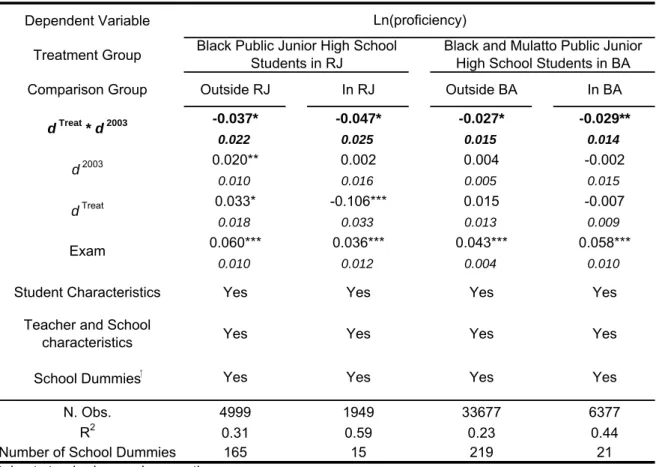
Finally, we exploit the fact that some schools were surveyed both in 2001 and in 2003. Table 10 displays our DID estimates including a dummy variable for each school that was surveyed in both years, and one dummy for all other schools. By doing this, we are able to control our estimates for any timeless unobserved characteristics of these repeated schools that a¤ect pro…ciency.
[Table 10]
In Rio de Janeiro, our DID coe¢cients suggest that the pro…ciency of black public school students was 3.7% lower (signi…cant at 10%) due to this system of quotas when black public school students from other states are used as a comparison group. When non-favored students from Rio de Janeiro are used as a comparison groups, our DID coe¢cient suggested that the pro…ciency of black public school students was 4.7% lower (signi…cant at 10%).
In Bahia, our estimates suggest that the pro…ciency of favored students was 2.7% lower (signi…cant at 10%) when other states’ students were used as a comparison group, and 2.9% lower (signi…cant at 5%), when non-favored students from Bahia were used as a comparison group. These results are close to our …ndings in section 5.
Conclusion
In 2002 and 2003, public universities from Rio de Janeiro and Bahia im-plemented a system of quotas in their admission procedures. This paper assesses the impact of these quota systems on the incentives to learn of fa-vored senior high school students. Although the theoretical literature points out that a¢rmative action may a¤ect incentives for e¤ort and human capital investments, the direction and magnitude of this e¤ect is unclear, and any clari…cation will depend on empirical study.
students from Rio de Janeiro were not a¤ected, which may re‡ect that they were not sure about their eligibility to be included in these quotas, and thus they did not want to run the risk of studying less and then not being eligible. These results provide the …rst empirical evidence that a¢rmative action policies may reduce incentives for e¤ort and skill acquisition. Although our results cannot be generally applied in other situations, analyzing the context and form in which these systems of quotas were implemented may provide useful insights into whether a¢rmative action is likely to lead to these neg-ative e¤ects.
Finally, it is important to stress that we are assessing the e¤ects of a¢r-mative action on incentives to e¤ort and skill acquisition in only one dimen-sion. We evaluate only one among many changes in incentive provided by the quota system. It is perfectly possible that the net e¤ect of such policies on the human capital investment is even positive rather than negative.
References
[1] Coate, S. and G. C. Loury (1993a) “Antidiscrimination Enforcement and the Problem of Patronization.” American Economic Review, 83(2): 92-98.
[2] Coate, S. and G. C. Loury (1993b) “Will A¢rmative-Action Policies Eliminate Negative Stereotypes.” American Economic Review, 83(5): 1220-1240.
[3] Fryer, R. and G. C. Loury (2005) “A¢rmative Action and Its Mythology.” Journal of Economic Perspectives, forthcoming.
[4] Holzer, H. and D. Neumark (2000) “Assessing a¢rmative action.”Journal of Economic Literature,38(3): 483-568.
[5] Holzer, H. and D. Neumark (1999) “Are a¢rmative action hires less qual-i…ed? Evidence from employer-employee data on new hires.” Journal of Labor Economics, 17(3): 534-569.
[7] Lundberg, S. J. and R. Startz (1983) “Private Discrimination and Social-Intervention in Competitive Labor-Markets.” American Economic Re-view,73(3): 340-347.
[8] Milgrom, P. and S. Oster (1987) “Job Discrimination, Market Forces, and the Invisibility Hypothesis.” Quarterly Journal of Economics, 102(3): 453-476.
Table 1: Control Variables Description
Student Characteristics
1 Gender male or female
2 Age Integer
3 Do you live with your father (or another responsible)? yes or no 4 Do you live with your mother (or another responsible)? yes or no
5 How many books do you have at home? none, 1 to 20, 20 to 100, 100 or more 6 Is there a home-help in your home? no, 1, 2 or more, daily
7 Have you ever attended another school? yes or no
8 In which kind of schools have you studied? public, private, public and private 9 Have you ever had to repeat a school year? yes or no
10 Have you ever dropped out of school? yes or no 11 Do you have piped water at home? yes or no 12 Do you have electricity at home? yes or no
13 How many televisions do you have at home? none, 1, 2, 3, 4 or more 14 How many radios do you have at home? none, 1, 2, 3, 4 or more 15 How many cars do you have at home? none, 1, 2, 3, 4 or more 16 Do you have a VCR at home? yes or no
17 Do you have a refrigerator at home? yes or no 18 Do you have a washing machine at home? yes or no 19 Do you have a vacuum cleaner at home? yes or no
20 How many bathrooms are in your home? none, 1, 2, 3 or more 21 Do you have a computer at home? yes or no
Teacher Characteristics
22 Gender male or female
23 Age 24 or less, 25 to 29, 30 to 39, 40 to 49, 50 to 54, 54 or more 24 Race White, Mulatto, Black, Asian
25 Do you have higher education yes or no
School Characteristics
26 Was there a lack of teachers during the year? no, yes but it was not a big problem, yes and it was a big problem 27 Were there class interruptions during the year? no, yes but it was not a big problem, yes and it was a big problem 28 Conservation of the roof Proper, regular, improper, or inexistent
29 Conservation of the walls Proper, regular, improper, or inexistent 30 Conservation of the floor Proper, regular, improper, or inexistent 31 Conservation of the bathrooms Proper, regular, improper, or inexistent 32 Conservation of the kitchen Proper, regular, improper, or inexistent 33 Conservation of the hydraulic facilities Proper, regular, improper, or inexistent 34 Conservation of the wiring Proper, regular, improper, or inexistent 35 Are the classrooms illuminated? yes or no
Table 2: Descriptive Statistics
2001 2003 2001 2003 2001 2003
Public School 74.62% 77.82% 88.95% 88.69% 84.02% 83.88%
White 32.55% 26.31% 22.96% 17.58% 45.63% 41.33%
Mulatto 28.35% 34.86% 45.77% 49.27% 28.54% 32.29%
Black 8.34% 11.61% 16.94% 19.06% 4.96% 6.34%
Asian 5.38% 5.04% 3.28% 2.78% 4.89% 3.91%
Private School 25.38% 22.18% 11.05% 11.31% 15.98% 16.12%
White 17.37% 13.80% 5.10% 4.01% 11.18% 10.56%
Mulatto 5.42% 6.93% 4.69% 5.61% 3.41% 4.28%
Black 1.32% 0.89% 0.72% 1.30% 0.40% 0.50%
Asian 1.27% 0.56% 0.54% 0.39% 0.99% 0.78%
Public School 263.1 269.5 252.8 252.3 259.7 262.8
White 269.1 280.7 252.9 265.3 265.6 268.3
Mulatto 259.7 266.5 254.3 248.9 253.3 257.0
Black 255.0 253.1 246.8 247.2 244.1 254.9
Asian 257.4 269.3 264.0 266.9 258.1 265.5
Private School 320.0 324.0 311.1 322.5 325.9 328.8
White 326.6 329.7 317.1 332.5 331.0 334.3
Mulatto 311.3 317.3 308.4 320.7 311.9 318.4
Black 284.0 300.9 294.7 302.3 300.0 301.2
Asian 303.6 303.7 299.9 313.6 327.5 328.7
Public School 77.61% 83.59% 73.33% 79.91% 78.02% 80.93%
White 79.57% 86.11% 75.45% 80.66% 80.04% 82.33%
Mulatto 76.75% 84.10% 73.26% 80.31% 75.93% 80.43%
Black 75.66% 80.41% 71.09% 77.13% 74.05% 75.81%
Asian 73.23% 74.29% 71.10% 87.17% 75.31% 78.52%
Private School 86.42% 95.09% 83.14% 94.64% 88.19% 95.21%
White 87.33% 95.14% 79.08% 95.09% 88.91% 95.69%
Mulatto 84.64% 96.32% 88.32% 94.34% 86.63% 95.04%
Black 87.72% 82.46% 87.72% 93.71% 84.32% 90.83%
Asian 80.18% 99.07% 70.42% 97.40% 87.09% 92.53%
Public School 1476 1410 1845 1519 35737 24809
White 620 551 446 297 15622 10471
Mulatto 569 589 934 851 15457 11094
Black 173 204 392 327 2558 2064
Asian 114 66 73 44 2100 1180
Private School 1226 1132 1258 1755 28776 20458
White 836 736 547 635 17148 12787
Mulatto 259 312 545 874 8806 5971
Black 66 49 99 183 947 714
Asian 65 35 67 63 1875 986
Source: SAEB
* This index ranges from 75 to 500
Ob se va tio n s P erc e nt age o f stu d ent s th at
were willing t
o c ont inue s tudy ing af te r hi g h s c hool P rof iciency* Other States Bahia P e rc ent age of s tudent s
Table 3: Percentage of undergraduate students who had lived in another state previously
Rio de Janeiro Bahia Other States
White or Asian 5.77% 14.03% 8.96%
Mulatto 3.75% 10.73% 10.46%
Black 6.55% 6.08% 8.39%
Total 5.49% 11.70% 9.24%
Table 4: Effect of the System of Quotas on Black Public School Students in Rio de Janeiro
Dependent Variable
Treatment Group
Comparison Group
-0.048** -0.051** -0.057*** -0.015 -0.046* -0.057**
0.0240 0.0210 0.0220 0.0390 0.0260 0.0250
0.043*** 0.022** 0.01 0.009 0.01 0.01
0.0120 0.0110 0.0100 0.0330 0.0180 0.0180
0.042** 0.047*** 0.039** -0.245*** -0.100*** -0.112***
0.0180 0.0150 0.0170 0.0240 0.0280 0.0330
0.061*** 0.055*** 0.056*** 0.034*** 0.046*** 0.033***
0.0110 0.0100 0.0100 0.0120 0.0110 0.0120
N. Obs. 4999 4999 4999 2049 2049 2049
Adjusted R2 0.04 0.21 0.24 0.33 0.50 0.54
Robust standard errors in parentheses
* significant at 10%; ** significant at 5%; *** significant at 1%
No No Yes
Yes
No Yes
Yes Teacher and School
characteristics
No Yes
No No
Yes dTreat * d2003
d2003
dTreat
Student Characteristics Exam
Black Public School Students in Other States
White and Asian Private School Students in Rio de Janeiro Ln(proficiency)
Table 5: Effect of the System of Quotas on Other Groups of Favored Students in Rio de Janeiro
Dependent Variable
Treatment Group
Comparison Group Outside RJ In RJ Outside RJ In RJ Outside RJ In RJ Outside RJ In RJ Outside RJ In RJ
0.002 -0.027 0.026 0.015 0.021 0.009 0.042 0.000 -0.027 -0.015
0.017 0.027 0.018 0.029 0.038 0.047 0.033 0.034 0.026 0.016
-0.001 0.000 -0.006 0.005 0.011 0.005 -0.007 0.010 0.002 0.011
0.005 0.021 0.006 0.021 0.013 0.021 0.015 0.019 0.007 0.019
0.022** -0.115*** 0.027** -0.096*** -0.010 -0.100** -0.040* -0.045** 0.015 0.007
0.011 0.030 0.011 0.025 0.025 0.040 0.024 0.020 0.014 0.011
0.035*** 0.027*** 0.051*** 0.043*** 0.032*** 0.036** 0.066*** 0.060*** 0.063*** 0.063***
0.004 0.010 0.004 0.012 0.011 0.014 0.011 0.014 0.006 0.014
N. Obs. 27709 2830 27264 2843 3460 1852 1776 1787 15348 2243
Adjusted R2 0.18 0.44 0.22 0.41 0.25 0.47 0.31 0.37 0.31 0.39
Robust standard errors in parentheses
* significant at 10%; ** significant at 5%; *** significant at 1%
Yes Yes
Yes Yes
Ln(proficiency)
dTreat * d2003
d2003
dTreat
Mulatto Public School Students in Rio de Janeiro
White Public School Students in Rio de Janeiro
Asian Public School Students in Rio de Janeiro
Black Private School Students in Rio de Janeiro
Mulatto Private School Students in Rio de Janeiro
Yes Teacher and School
characteristics
Student Characteristics Yes
Yes Yes
Yes Yes
Yes Exam
Yes
Yes Yes
Yes
Yes Yes
Table 6: Effect of the System of Quotas on Black and Mulatto Public School Students in Bahia
Dependent Variable
Treatment Group
Comparison Group
-0.037 -0.028 -0.026 -0.071** -0.040*** -0.028**
0.032 0.021 0.020 0.032 0.013 0.013
0.019*** 0.003 0.001 0.052 0.013 -0.008
0.007 0.006 0.005 0.040 0.016 0.015
0.001 0.022 0.023 -0.063*** 0.002 -0.009
0.024 0.017 0.017 0.022 0.010 0.009
0.045*** 0.042*** 0.043*** 0.061*** 0.058*** 0.057***
0.004 0.003 0.004 0.009 0.009 0.010
N. Obs. 33677 33677 33677 6377 6377 6377
Adjusted R2 0.02 0.19 0.20 0.08 0.38 0.42
Robust standard errors in parentheses
* significant at 10%; ** significant at 5%; *** significant at 1%
Yes
Yes d2003
dTreat
Yes Teacher and School
characteristics
No Yes
No Student Characteristics
Ln(proficiency)
Black and Mulatto Public School Students in Bahia
Black and Mulatto Public School Students in Other States
Private School and White and Asian Public School Students in Bahia
dTreat * d2003
No Yes No
No No
Dependent Variable
Treatment Group
Comparison Group
Rio de Janeiro Bahia
-0.006 0.002
0.022 0.016
-0.007 -0.004
0.009 0.005
-0.003 -0.005
0.012 0.011
0.088*** 0.059***
0.005 0.003
N. Obs. 34468 82480
Adjusted R2 0.3 0.36
Robust standard errors in parentheses
* significant at 10%; ** significant at 5%; *** significant at 1% Ln(proficiency)
Non-Favored Students From States that Had Introduced a System of Quotas
Students' Counterparts From States that Had Not Introduced a System of Quotas
Exam
Table 7: Effect of the System of Quotas on Non-Favored Students
Teacher and School characteristics
Yes Yes
Yes Yes
dTreat * d2003
d2003
dTreat
Table 8: Junior High School Estimates
Dependent Variable
Treatment Group
Comparison Group Outside RJ In RJ Outside BA In BA
-0.011 -0.029 0.022 0.002
0.022 0.037 0.015 0.015
-0.030*** -0.005 -0.022*** -0.001
0.011 0.019 0.005 0.016
0.034** -0.135*** 0.000 -0.015
0.015 0.030 0.011 0.010
0.069*** 0.052*** 0.047*** 0.032***
0.010 0.011 0.004 0.007
N. Obs. 9081 2698 58041 8454
Adjusted R2 0.18 0.49 0.16 0.27
Robust standard errors in parentheses
* significant at 10%; ** significant at 5%; *** significant at 1%
Ln(proficiency)
Exam
Yes
dTreat * d2003
Student Characteristics Yes Yes
Yes Black Public Junior High School
Students in RJ
Black and Mulatto Public Junior High School Students in BA
d2003
dTreat
Teacher and School
characteristics Yes Yes Yes
Table 9: 1999 - 2001 Estimates
Dependent Variable
Treatment Group
Comparison Group Outside RJ In RJ Outside BA In BA
0.024 0.017 0.002 0.009
0.031 0.030 0.021 0.017
-0.026 -0.125 -0.019 -0.014
0.040 0.082 0.025 0.058
0.041 -0.094*** 0.028*** -0.011
0.028 0.034 0.009 0.014
0.035*** 0.041*** 0.044*** 0.060***
0.012 0.012 0.005 0.010
N. Obs. 3532 1631 25058 4219
Adjusted R2 0.22 0.43 0.17 0.35
Robust standard errors in parentheses
* significant at 10%; ** significant at 5%; *** significant at 1%
Ln(proficiency)
sim sim sim
sim
sim Black Public Junior High School
Students in RJ
Black and Mulatto Public Junior High School Students in BA
sim
sim sim
dTreat * d2003
d2003
dTreat
Student Characteristics Exam
Table 10: School Dummies
Dependent Variable
Treatment Group
Comparison Group Outside RJ In RJ Outside BA In BA
-0.037* -0.047* -0.027* -0.029**
0.022 0.025 0.015 0.014
0.020** 0.002 0.004 -0.002
0.010 0.016 0.005 0.015
0.033* -0.106*** 0.015 -0.007
0.018 0.033 0.013 0.009
0.060*** 0.036*** 0.043*** 0.058***
0.010 0.012 0.004 0.010
N. Obs. 4999 1949 33677 6377
R2 0.31 0.59 0.23 0.44
Number of School Dummies 165 15 219 21
Robust standard errors in parentheses
* significant at 10%; ** significant at 5%; *** significant at 1% Only for Schools that were surveyed both in 2001 and 2003
Yes
Yes
Yes Yes
Black and Mulatto Public Junior High School Students in BA
School Dummies
Student Characteristics Yes Yes
Teacher and School
characteristics Yes Yes
dTreat * d2003
Ln(proficiency)
Black Public Junior High School Students in RJ
Yes Yes Yes Yes
Exam d2003