www.atmos-chem-phys.net/10/8513/2010/ doi:10.5194/acp-10-8513-2010
© Author(s) 2010. CC Attribution 3.0 License.
Chemistry
and Physics
Composition and temporal behavior of ambient ions in the boreal
forest
M. Ehn1, H. Junninen1, T. Pet¨aj¨a1, T. Kurt´en1, V.-M. Kerminen1,2, S. Schobesberger1, H. E. Manninen1, I. K. Ortega1,
H. Vehkam¨aki1, M. Kulmala1, and D. R. Worsnop1,2,3
1Department of Physics, P.O. Box 64, 00014, University of Helsinki, Finland
2Finnish Meteorological Institute, Research and Development, P.O. Box 503, 00101 Helsinki, Finland 3Aerodyne Research Inc, Billerica, MA 01821, USA
Received: 2 June 2010 – Published in Atmos. Chem. Phys. Discuss.: 16 June 2010 Revised: 20 August 2010 – Accepted: 24 August 2010 – Published: 9 September 2010
Abstract. A recently developed atmospheric pressure
in-terface mass spectrometer (APi-TOF) measured the negative and positive ambient ion composition at a boreal forest site. As observed in previous studies, the negative ions were dom-inated by strong organic and inorganic acids (e.g. malonic, nitric and sulfuric acid), whereas the positive ions consisted of strong bases (e.g. alkyl pyridines and quinolines). Sev-eral new ions and clusters of ions were identified based on their exact masses, made possible by the high resolution, mass accuracy and sensitivity of the APi-TOF. Time series correlograms aided in peak identification and assigning the atomic compositions to molecules. Quantum chemical cal-culations of proton affinities and cluster stabilities were also used to confirm the plausibility of the assignments. Acids in the gas phase are predominantly formed by oxidation in the gas phase, and thus the concentrations are expected to vary strongly between day and night. This was also the case in this study, where the negative ions showed strong diurnal be-havior, whereas the daily changes in the positive ions were considerably smaller. A special focus in this work was the changes in the ion distributions occurring during new parti-cle formation events. We found that sulfuric acid, together with its clusters, dominated the negative ion spectrum dur-ing these events. The monomer (HSO−4) was the largest peak, together with the dimer (H2SO4·HSO−4) and trimer
((H2SO4)2·HSO−4). SO−5 also tracked HSO−4 at around 20%
of the HSO−4 concentration at all times. During the strongest events, the tetramer and a cluster with the tetramer and
am-Correspondence to:M. Ehn
monia were also detected. Quantum chemical calculations predict that sulfuric acid clusters containing ammonia are much more stable when neutral, thus the detection of a single ion cluster implies that ammonia can be an important com-pound in the nucleation process. We also believe to have made the first observations of an organosulfate (glycolic acid sulfate) in the gas phase. This ion, and its cluster with sul-furic acid, correlates with the HSO−4, but peaks in the early afternoon, some hours later than HSO−4 itself. A list of all identified ions is presented in the supplementary material, and also a list of all detected masses not yet identified.
1 Introduction
Ions in the atmosphere are produced mainly by cosmic radia-tion and radioactive decay (e.g. Harrison and Carslaw, 2003). The primary ions formed in this process, such as N+2, O+2, O−2 and H3O+, subsequently collide with various trace gases,
which may result in charge transfer when energetically favor-able. In this way, over time, the charges will be transported, through a series of collisions leading to charge transfer, to-wards the compounds with the highest (positive charges) and lowest (negative charges) proton affinities. Once an ion col-lides with an aerosol particle or surface, it is considered to be lost. Thus, the ambient ion distribution obtains a pseudo steady state between ion production, transfer, and loss (e.g. H˜orrak et al., 2008, and references therein).
important source of cloud condensation nuclei, with poten-tially large implications on the Earth’s climate system (Wang and Penner, 2009; Merikanto et al., 2009; Andreae and Rosenfeld, 2008). The contribution of ions to atmospheric nucleation has been studied both theoretically (Kerminen et al., 2007; Yu and Turco, 2001; Kazil and Lovejoy, 2004; Yu et al., 2008) and by using various experimental approaches (Gagn´e et al., 2009; Eisele et al., 2006; H˜orrak et al., 2003; Mirme et al., 2010; Laakso et al., 2007). While many of these studies are suggestive of a minor contribution of ions to the overall nucleation rate (Kulmala et al., 2007; Kulmala et al., 2010), especially in the lower troposphere, no general con-sensus on this issue has been received (Enghoff and Svens-mark, 2008; Kazil et al., 2008). Regardless of their exact role in atmospheric aerosol formation, ions are expected to provide valuable information on this process, since the trace gases participating in nucleation are very likely to influence the number size distribution and chemical composition of at-mospheric small ions.
The concentration and size distribution of ions can be mea-sured with time resolutions of minutes or less by using var-ious kinds of ion spectrometers, such as the Balanced Scan-ning Mobility Analyzer (BSMA, Tammet, 2006), Air Ion Spectrometer (AIS, Mirme et al., 2007), and Neutral clus-ter and Air Ion Spectromeclus-ter (NAIS, Kulmala et al., 2007; Manninen et al., 2009b). With these instruments, physical characteristics of atmospheric ions have recently been in-vestigated in a number of different environments around the world (e.g. Suni et al., 2008; Vana et al., 2008; Laakso et al., 2008; Manninen et al., 2010). Unfortunately, due to the low mobility resolution associated with ion spectrometers (Asmi et al., 2009), no information on the chemistry of atmospheric ions has been obtained from these studies.
To determine the chemical composition of atmospheric ions, mass spectrometer (MS) techniques need to be em-ployed. The first mass spectrometric measurements of tropo-spheric ions were performed during the 1980s (Eisele, 1989a, b, and references therein), and the same or similar kind of in-struments have been used until the last decade (Eisele et al., 2006). These studies have shown that negative ions below a few hundred atomic mass units are dominated by strong acids, such as sulfuric and nitric acid, and their clusters, whereas positive ions consist of molecules and clusters of ammonia, amines and pyridines. The quadrupole MS is lim-ited in applicability due to close to integer mass resolution, in addition to the long integration times needed to sample the entire ion spectrum. With these instruments, a more specific determination of the chemical composition requires MS-MS operation, where additional information is gained by frag-menting selected ions.
Recently, a new atmospheric pressure interface time-of-flight mass spectrometer (APi-TOF) was developed and tested (Junninen et al., 2010). A time-of-flight MS provides a better mass and time resolution than a quadrupole MS. Thus, Junninen et al. (2010), identified several ions in the
ambi-ent air with high certainty, purely based on their (high res-olution) masses and temporal behavior, consistent with the previous characterization with the quadrupole MS methods (Eisele, 1989a, b).
In this study, we have deployed an APi-TOF in Hyyti¨al¨a, southern Finland, to measure the composition of ambient ions. The aim was to compare the composition of ions in the boreal forest with existing data available by Eisele (1989a, b) and Junninen et al. (2010), and continue the identification work. With the improved sensitivity, the temporal behavior of the ions could also be studied. A special focus was put on determining the changes in the ion composition during new particle formation events, and how this is related to the initial steps of nucleation and growth.
2 Materials and methods
This study utilized both experimental and theoretical meth-ods in the characterization of the ambient ion chemical com-position in a boreal forest environment. A suite of instru-ments were deployed at SMEAR II in Hyyti¨al¨a (Hari and Kulmala, 2005). The station is a rural site, located within the boreal forest, with a large range of basic meteorology, par-ticle and gas phase instruments measuring year-round. The experimental characterization of the ambient ions was con-ducted as a part of the EUCAARI project (Kulmala et al., 2009; Kerminen et al., 2010) intensive observation period in April–May, 2009. The results presented below were col-lected over the period 30 April–8 May 2009, starting in neg-ative ion mode, and switching to positive ion measurements on 5 May.
Quantum chemical calculations were performed to aid in the interpretation of the measured ion distributions. Proton affinities and gas phase acidities were calculated for several compounds, providing a measure for the stability of the ions. Although the bulk liquid values for proton affinity and acidity for a certain compound is well known, the gas phase values may differ from these. Additionally, formation free energies of selected molecular clusters were calculated. Specific com-putational details are presented in the supplementary mate-rial.
2.1 Ambient ion chemical composition
TOF, manufactured by Tofwerk AG in Switzerland, has a re-solving power specified to 3000 Th/Th and a mass accuracy
<20 ppm in “V mode”. The ion flight paths can be set to ei-ther single (“V mode”) or double (“W mode”) reflections, optimizing either for signal (V) or resolution (W). In this study only the V mode was used. We will use the Thomp-son (Th) as the unit form/Q, which closely corresponds to the mass unit Dalton (Da) for singly charged ions.
The APi-TOF currently provides mass spectra of ions with a transmission efficiency of 0.1–1% (Junninen et al., 2010) in the range 80–800 Th. Effectively the TOF is a band-pass filter for the ions, where there is a sharp cut-off at lowm/Q, a relatively stable transmission in the intermediatem/Qrange, and a slow decrease at highm/Q. The position of the sharp drop-off at lower sizes, and the rate of transmission loss at higher masses can to some extent be optimized to allow for better throughput of either the small or large ions. In this work, with a focus on studying new particle formation and growth, the transmission range was optimized for the larger ions, which in practice meant a sharp cut-off at around 70 Th (positive ions) and 80 Th (negative ions), and a transmission drop of at least a factor 10 at 1000 Th (both polarities).
In addition to the internal ion losses, the sampling inlet tubing will also produce (size dependent) losses. The inlet of the APi-TOF consisted of stainless steel tubing, roughly 60 cm in length. The first 45 cm was 10 mm outer diameter (OD) tube with a flow rate of 15 l min−1, followed by 15 cm
of 6 mm OD tube with a flow of 6 l min−1. Simulated
dif-fusion losses in the inlet tubing showed a transmission of 25–50% in the mass range 100–1000 Da, assuming laminar flow. The final total detection efficiency of the instrument during this campaign was determined by comparing the to-tal ion counts measured by the APi-TOF and a BSMA (see Sect. 2.2.2). No size dependence was taken into account, as this could not be done reliably enough. The uncertainty of the BSMA is reported to be<20%, and this uncertainty will translate to the reported APi-TOF concentrations.
In the expansion into lower pressure, and during ion-gas collisions in the guiding quadrupoles, weakly bound clusters may fragment. The most likely perturbation of the ions is the loss of clustered water molecules. In a recent comparison between the APi-TOF and two ion mobility instruments, very good agreement from sampled ambient ion distributions was found (Ehn et al., 2010). The transmission estimates from that comparison agreed well with the calibrations made in the laboratory, with molecules and clusters as described by Junninen et al. (2010). The fact that the instruments agreed, suggest that no major fragmentation happens inside the APi-TOF.
2.2 Ancillary instrumentation and data analysis
2.2.1 Gas phase sulfuric acid and malonic acid
A chemical ionization mass spectrometer (CIMS, Eisele and Tanner, 1993; Pet¨aj¨a et al., 2009) measured next to the APi-TOF, providing neutral sulfuric acid concentrations for the measurement period. The CIMS introduces NO−3 ions into its sample flow, and based on the selectivity of the nitrate ion, only a few stronger acids will transfer a proton to it, the strongest being H2SO4. Besides the normal measurement
mode of the CIMS, for this period it was also measuringm/Q
103 Th, believed to be de-protonated malonic acid.
2.2.2 Air ion physical characterization
A balanced scanning mobility analyzer (BSMA, Tammet, 2006) also measured during the EUCAARI intensive cam-paign in Hyyti¨al¨a. The BSMA consists of two plane-type dif-ferential mobility analyzers, one for each polarity. It scans 16 mobility channels in the range 3.2–0.032 cm2V−1s−1with a time resolution of 10 min. The extremely high flow rate of about 3000 l min−1provides good sensitivity and low diffu-sion losses inside the instrument.
2.2.3 Data analysis
The mass spectra were analyzed using the tofTools toolbox developed by Junninen et al. (2010). The BSMA was used as a reference to account for inlet and transmission losses in the APi-TOF. We compared the total ion concentrations mea-sured by the APi-TOF and the BSMA, and selected appro-priate multipliers for the APi-TOF data. The resulting values for the negative ions was 3000, and the positive ions 1000, corresponding to total transmissions of 0.033% and 0.1%, respectively. These values are low compared to the labora-tory calibrations performed by Junninen et al. (2010), but the calibrations did not include any inlet losses, and this is be-lieved to be the reason for the discrepancy. The difference between the polarities is most likely due to different tuning of the voltages in the APi.
3 Results and discussion
3.1 Typical features in the mass spectra
3.1.1 Negative spectra
200
150
100
50
0
Concentration [cm
-3 ]
600 500
400 300
200 100
3.0 2.5 2.0 1.5 1.0 0.5
0.0
Concentration [cm
-3]
410 405 400 395 390
mass/charge [Th]
40
30
20
10
0
Concentration [cm
-3]
600 500
400 300
200 100
mass/charge [Th] C3H3O4
-C3H4O4 NO3
-(H2SO4)2 HSO4
-HNO3 NO3
-HNO3 HSO4
Molecules/clusters with sulfuric acid Sulfur isotopes
Molecules/clusters with nitric acid Other species
H2SO4 HSO4
-HSO4
-SO5
-C3H4O4 HSO4
-(H2SO4)3 HSO4
-(H2SO4)3 HSO4
-NH3 (H2SO4)3 HSO4
-NH3 (H2SO4)3 HSO4
-SO4 NO3
-B A
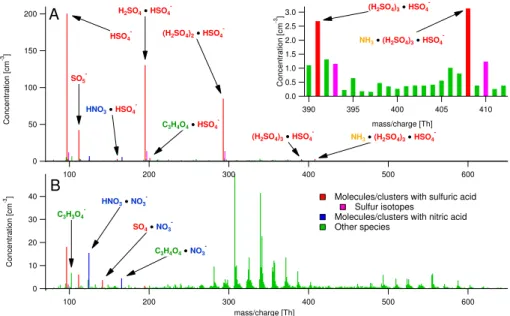
Fig. 1.Negative ion mass spectra during the measurements in Hyyti¨al¨a, averaged over 3 h.(A)shows a typical daytime spectrum and(B)a
typical nighttime spectrum. The ions are colored based on the identified composition.
The highest peaks were sulfuric acid monomer (96.96 Th), dimer (194.93 Th) and trimer (292.89 Th). The dimer/trimer in this context refers to a cluster of one/two H2SO4molecules
clustered with HSO−4. Other selected sulfuric acid peaks are also shown in Fig. 1, including clusters with nitric acid, mal-onic acid, and ammonia. Additionally, SO−5 (111.95 Th) was typically detected together with HSO−4, and the concentra-tion of SO−5 was roughly 20% of that of HSO−4. Several studies have presented data on HSO−4 in the atmosphere (e.g. Eisele, 1989b; Eisele et al., 2006), but to our knowledge the only previous atmospheric observations of the SO−5 ion was by Junninen et al. (2010). Model studies on the role of HSO5
in the nucleation process has also been performed by Kurt´en et al. (2009), and this metastable radical has been found to be significantly stabilized by hydration, i.e. by forming clus-ters with water molecules, in ambient conditions. However, if SO−5 would be produced by de-protonation of HSO5, there
would need to be a very high concentration of HSO5in the
atmosphere, but to our knowledge there are no reports of this. On the other hand, Salcedo et al. (2004) showed that SO2can
be ionized by CO−3, producing end products such as CO2,
SO−3 an SO−5. However, SO−5 tracks HSO−4 so closely in our data, that it cannot be formed purely from SO2which usually
peaks in the early morning.
The range around 400 Th in Fig. 1a is plotted in more de-tail in the inset figure. During this day we also observed the sulfuric acid tetramer, and the tetramer cluster with ammonia (NH3). Both of these peaks were very small, but had clear
negative mass defects, i.e. the peaks were clearly below the integer masses, distinguishing them from all the surround-ing (most likely organic) peaks. The same peaks were ob-served in the laboratory by Junninen et al. (2010) when
mix-ing a sulfuric acid laden sample with laboratory air. Further-more, Junninen et al. (2010) did not observe any NH3
affili-ated clusters smaller than the sulfuric acid tetramer, but at the higher masses the NH3-containing clusters dominated. That
may also be the case in this study, but the concentrations of the larger clusters were not high enough to be distinguished. The period shown in Fig. 1 coincided with a strong new par-ticle formation event, as will be shown in Sect. 3.3, and the implications of the observation of a H2SO4/NH3ion cluster
for the nucleation mechanisms are discussed in Sect. 3.4. Figure 1b shows a 3 h average from 00:00–03:00 on 1 May. During night the H2SO4 production was
consider-ably lower, but nevertheless HSO−4 was still one of the largest peaks in the spectrum. Other distinct peaks were found at 103.00 Th (malonic acid, C3H3O−4), 166.00 Th
(HNO3·C3H3O4−), 124.98 Th (HNO3·NO−3), and 157.94
(SO4·NO−3). All these have been previously identified by
Eisele and Tanner (1990) in Georgia, USA. The last ion may have a different molecular structure but the elemental com-position is probably correct.
Based only on the bulk liquid acidity of malonic acid (pKa = 2.83), it is surprising that the ambient concentrations of the ion were so high. However, the gas-phase acidity of small dicarboxylic acids, and especially malonic acid, is consider-ably higher than what would be expected based on their bulk liquid acidities, as measured by Kumar et al. (2005). They speculated that this is due to the formation of a strong internal hydrogen bond in the corresponding conjugate ions. For in-stance, for malonic acid, it has been computationally demon-strated (albeit at a fairly qualitative level of theory) that C3H3O−4 prefers a cyclic structure in the gas phase, but an
Our calculations confirm this hypothesis. The minimum-energy structures of de-protonated oxalic, malonic, and suc-cinic acids all contain an internal hydrogen bond (between the remaining COOH hydrogen and the negatively charged oxygen on the COO− group), as shown in Fig. A1 in Ap-pendix A. However, only the ring in the malonic acid ion contains precisely six atoms, which makes malonic acid a stronger acid in the gas phase than oxalic or succinic acid (calculated proton affinities found in Table A1, Appendix A). More importantly, in the gas phase, malonic acid is also sig-nificantly stronger than nitric acid, which explains the abun-dance of C3H3O−4 measured by the APi-TOF, and why
mal-onic acid can be detected with the CIMS instrument. The night time spectrum was dominated by a large amount of peaks at high masses. The largest pattern is seen in the range 300–400 Th, with a second pattern forming at 500– 600 Th. These peaks have not yet been identified with as high certainty as the previously mentioned ions, partly due to a decrease in the absolute mass accuracy at higher masses, and an increase in the amount of elemental composition per-mutations possible. A peculiarity is that all the largest peaks between 280 and 400 Th fall on even integer masses. This implies an odd number of N atoms in each ion, according to the nitrogen rule as described in the peak identification sec-tion in Junninen et al. (2010).
The instrument transmission for the negative ions during this experiment was optimized for larger masses, and thus there was a sharp cut-off in the lower end of the spectrum. The smallest detectable ions were seen at integer mass 80 Th. This means that we could not detect ions like NO−3 and CO−3. Especially the former is expected to be found in fairly high concentrations based on previous measurements by e.g. Eisele and Tanner (1990) and Junninen et al. (2010).
3.1.2 Positive spectra
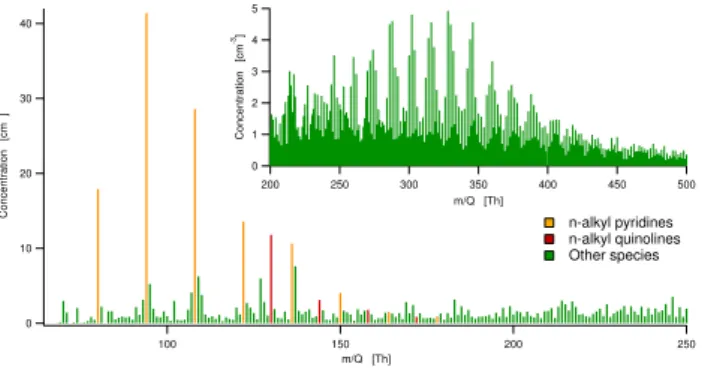
The positive ion spectra were more evenly spread out over many masses than the corresponding negative spectra, as seen in Fig. 2. Some positive ion peaks do stick out, mainly n-alkyl pyridines and quinolines, with protonated pyridine at 80.05 Th, and protonated quinoline at 130.07 Th. However, throughout the measurement range there are peaks visible at nearly every mass. The limit at whichm/Qwe no longer can identify peaks with a high degree of certainty is lower for the positive ions, as the signals are spread out over more masses, yielding generally lower signals. The inset figure shows the mass spectrum in 200–500 Th range, where a pattern typical for organic compounds. Only a daytime spectrum is shown for the positive ions, as the day and nighttime differences are much more subtle than for the negative ions. During the night, the pyridine peaks typically increase around a factor of two, whereas signals at the higher masses decrease.
Similar to the negative ion spectra, also the positive spec-tra suffer from a sharp spec-transmission cut-off at low masses. The most important ion that we cannot measure is protonated
40
30
20
10
0
Concentration [cm
-3]
250 200
150 100
m/Q [Th] 5
4 3 2 1 0
Concentration [cm
-3]
500 450 400 350 300 250 200
m/Q [Th]
n-alkyl pyridines n-alkyl quinolines Other species
Fig. 2.Typical daytime positive ion mass spectrum during the
mea-surements in Hyyti¨al¨a, averaged over 3 h.
ammonia (NH+4). If present, also protonated water (H3O+)
and small protonated water clusters would not have been de-tected.
3.2 Peak identification
Identifying the elemental composition of the detected peaks was done principally by looking at the high resolution masses. For a mass accuracy of∼20 ppm in the APi-TOF, the absolute mass can typically be calibrated to up to three decimals, up to a few hundred Thomson. To confirm this first result, and also to provide hints on the chemical formula of the ions, we used time series correlograms and Kendrick analysis (Junninen et al., 2010; Kendrick, 1963). Examples of both these techniques are presented below. A detailed list of all ions identified in this study can be found in the sup-plementary material, Tables S1 and S2. Tables S3 and S4 list all ions that were detected, but not necessarily identified. The large majority of the identified ions have received their charge by proton transfer to (positive ions) or from (negative ions) the originally neutral molecules. We will refer to pro-tonated and de-propro-tonated ions with the name of the corre-sponding neutral molecules, except where it may cause con-fusion.
3.2.1 Negative ions
The time series correlation of each integer mass with other integer masses was calculated after averaging the data to a time resolution of 30 min. Although higher mass resolution data were available, most unit masses were dominated by only one ion, so to optimize the signal to noise for the time series, only unit masses were used for this analysis. Once a correlation was observed, identification was performed based on the high resolution peaks.
1.0
0.9
0.8
0.7
0.6
0.5
0.4
0.3
Correlation coefficient, R
400 300
200 100
m/Q [Th]
Molecules/clusters with sulfuric acid Sulfur isotopes
Molecules/clusters with nitric acid Other species
SO3
-H3S2O9
-C2H3SO6
-H2SO4 C2H3SO6
-C3H4O4 C2H3SO6
-Fig. 3.Correlogram showing time-series correlation of ions with HSO−4. The dimer, trimer and tetramer all stand out, together with some
other peaks tagged in Fig. 1. Ions with typically lower concentration but high correlation are marked in the figure. The C2H3SO−6 ion may
be the first observation of an organosulfate in the gas phase. For reference, the coloring is kept the same as in Fig. 1 although additional peaks were found to contain sulfuric acid.
acid monomer, HSO−4, and very high correlations (R >0.8) are found between the monomer and the dimer, trimer and SO−5, at masses 195, 293 and 112 Th, respectively. Also the tetramer at 391 Th, and the HNO3·HSO−4 cluster at 160 Th
haveR >0.5. All of the aforementioned ions were tagged in Fig. 1, and are not tagged in Fig. 3. The peaks tagged in Fig. 3 are those with lower concentrations but that stand out in the correlogram. The first is SO−3 (at 80 Th), which may correspond to de-protonated HSO3which is a short-lived
in-termediate in the oxidation process of SO2into H2SO4.
An-other possibility was mentioned in Sect. 3.1.1, in which SO−3 is formed directly from reactions between SO2and CO−3 (and
possibly other ions). At 211 Th, the peak was identified as having the elemental formula H3S2O−9. This could possibly
be an ion cluster of H2SO4 and Caro’s acid (H2SO5), but
since the HSO−5 ion was not separately detected, we could not verify this using correlograms.
At integerm/Q155 Th, we detected an ion matching the elemental formula C2H3SO−6, and at m/Q253 and 259 Th
its probable clusters with sulfuric and malonic acid, respec-tively). At unit mass 201 in Fig. 1, the ion C4H5SO−8
was attributed to a cluster of sulfuric and malonic acid (C3H4O4·HSO4−). For C2H3SO−6 it is tempting to again
assume a cluster with sulfuric acid, which would result in C2H2O2·HSO−4, i.e. a cluster of glyoxal and sulfuric acid.
The quantum chemical calculations of formation energies of clusters for selected molecules with HSO−4 (Table A2 in Ap-pendix A) showed that, while malonic acid is strongly bound to HSO−4, glyoxal does not bind particularly strongly to it, as could be expected from its low dipole moment and lack of efficiently hydrogen-binding functional groups. In particular, the binding of glyoxal to HSO−4 is only slightly stronger than that of water to HSO−4. Given the much lower
concentra-tion of glyoxal compared to water in the atmosphere, and the fact that the H2O·HSO−4 clusters either are not present in the
ambient ion distribution, or evaporate in the instrument be-fore they can be detected, it does not seem plausible that the C2H4SO−6 peak would consist of HSO−4 – glyoxal clusters.
We are then left with two alternatives, the peak may corre-spond to a cluster of some other organic molecule with some other sulfur-containing molecule, or it may correspond to a single molecule. The former was ruled out, as no molecular combinations were found that produced particularly strongly bound clusters. However, the latter possibility is intriguing, as a peak at unit mass 155 Th was observed in the particle phase by Galloway et al. (2009) after reactions of glyoxal oxidation products on ammonium sulfate particles. Based on chromatography experiments, they attributed the peak to glycolic acid sulfate (C2H3O2HSO4).
We computed the proton affinities of both the organosul-fate ions proposed by Galloway et al. (2009) (see Fig. A3 in Appendix A for their structures and for more discus-sion) and we found them to be extremely low; 294.9 and 292.8 kcal mol−1 for glyoxal sulfate and glycolic acid sul-fate, respectively. These proton affinities are even lower than for HSO−4, indicating that these organosulfate ions, if they exist in the gas phase, are likely to be the most stable anions around, and the corresponding neutral organosulfates could be charged even by HSO−4. To our knowledge, this would be the first time organosulfates have been identified in the gas phase.
We have also detected another compound, C5H5O−6
-0.10 -0.05 0.00 0.05 0.10
Mass defect [Th]
400 300
200 100
0
m/Q [Th] Sulfate containing ions
HNO3 • NO3
IO3
Others
HOOC-R-COO
-, R = (CH2)n
(CH2O)n
(CH2O)n (CO)n
(CO)n
(H2SO4)n • HSO4
H:C = 1, O:C = 1
20 ppm accuracy
Fig. 4. Mass defects of the negative ion spectrum. The circles are
the measured ions, with sizes corresponding to their concentration. Inorganic ions had the lowest mass defects, and the majority of green circles with the highest mass defects are believed to be or-ganic molecules. The dashed lines are examples of where different molecules would show up on the graph. The dotted line corresponds to an organic aerosol ensemble with an O to C ratio of one, and an H to C ratio of one.
earlier speculated that the ion at integer m/Q 259 was C3H4O4·C2H3SO−6, but it may also be a cluster of C5H6O6
with HSO−4. The time series correlation between integerm/Q
155 and 259 Th was 0.59, whereas for 161 and 259 Th the corresponding value was 0.52.
The night time negative ion spectrum was dominated by a pattern of peaks at 280–420 Th, with a second similar, but weaker, pattern of peaks at around 460–620 Th. We will here focus on the first pattern, in which the majority of the large ions were found at even integer masses, implying an odd number of N in the molecules. The pattern suggests organic compounds. Based on this assumption, the high resolution masses, and anticipating that each ion contained one N atom, the best guess for the two dominant peaks at integerm/Q
308 and 340 Th, were C10H14NO−10 and C10H14NO−12.
Fig-ure S1 in the supplementary material shows how accurately this can be determined for the ion at 340 Th. Two other large peaks at 342 and 372 Th, are proposed to be C10H16NO−12
and C10H14NO−14. The lack of peaks with similar time traces
at lower masses suggests that these are single molecules and not clusters. As all of these compounds contain ten carbon atoms, it is tempting to attribute these molecules to highly oxidized products of monoterpenes (C10H16). At this high O
to C ratio and low H to C ratio, the molecules have to contain a large number of carboxyl groups, which in turn would fa-cilitate that they become ionized and subsequently detected by the APi-TOF. The best correlation at lower masses with the ions at 300–400 Th was found for tartaric (C4H5O−6,
149.01 Th) and malic acid (C4H5O−5, 133.01 Th), which both
have very high O to C ratios, possibly produced in reactions leading to fragmentation of the larger ions.
An overview of the entire negative spectrum can be gained by plotting the mass defects, i.e. exact mass – nominal mass, as a function of m/Q(Fig. 4). For instance, the ex-act mass of HSO−4 is 96.960 Da, which gives it a mass de-fect of 96.960 Da–97.000 Da=−0.040 Da. The plotted data
are a two-day average, and only peaks with a mean concen-tration above 0.5 cm−3 are plotted for clarity. The size of each marker is a measure of the ion concentration. The inor-ganic ions are easily distinguished based on their low mass defects. The dashed lines are examples of where specific combinations of functional groups fall on the graph. The shaded area around each line shows the 20 ppm accuracy of the instrument. As all identified organic molecules contain two carboxyl groups (COOH), the origin of these molecu-lar functions is oxalic acid (COOH-COO−). Adding CH
2
groups corresponds to simple dicarboxylic acids (dashed black line), of which malonic acid is the following one. How-ever, form/Q>150 Th, observed ions clearly have mass de-fects smaller than the simple dicarboxylic acids, indicative of higher oxygen content. At the other extreme, adding only carbonyl groups (CO, dashed orange line) produces molecules with too low mass defects. The middle two dashed lines (purple and blue) fit the data better, corresponding to ad-ditions of only hydroxyl groups (CHOH), or equal amounts of hydroxyl and carbonyl groups, respectively. In reality, the molecules with high carbon number are not expected to be straight chains, in which case they can contain more carboxyl groups, at the same time increasing their charging probabil-ity. As seen from the dashed lines, the O to C ratios can be narrowed down fairly well, although the larger organic ions cannot be unambiguously identified. No N atoms were con-sidered here, although the larger molecules were suggested to contain some nitrogen. The mass defect of N itself is only 0.003 and will not shift the molecules very much in Fig. 4. However, adding a functional group containing N may have very different effects, as an amino group (NH2)has a mass
defect of 0.018, and a nitroxy group (NO3)has a mass defect
of−0.012.
3.2.2 Positive ions
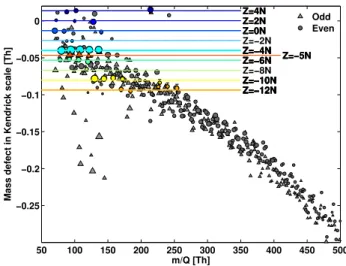
The temporal variability of the positive ions was smaller than that of the negative ions, and thus correlograms were not as effective tools in the peak identification. Mass defect dia-grams, as shown in Fig. 4, on the other hand can aid the detection of patterns in the mass spectra when alkyl groups of different lengths are typical building blocks of the ions. This is best done by changing to the Kendrick mass scale (Kendrick, 1963) where the mass of 12CH2 is defined as
14.0000. In other words, the measured mass of an ion is divided by m(12CH2)/14, and thus (CH2)n will always fall exactly on integer masses. As a result of this, the addition of CH2 groups will not change the mass defect, and molecule
groups differing by (CH2)nwill form a horizontal line. Fig-ure 5 shows a mass defect diagram in Kendrick mass scale of the positive ion mass spectrum, averaged over two days to include as many ions as possible (for a better comparison with Fig. 4, the unscaled mass defects are plotted in Fig. S2 in the supplementary material). As an example, pyridine and alkyl pyridines all fall on the same horizontal line, de-notedZ= −4 N. The Z value is described in detail elsewhere (Hughey et al., 2001; Junninen et al., 2010), but briefly, the number is a rough measure of how many rings and/or dou-ble bonds the molecules contain. The Z value is defined as
h−2c, where the letters signify the amount of H and C atoms in the molecule (as in CcHh). If the molecules contain other atoms than C and H, these are listed after the numeric value. All the molecules with the same Z value belong to the same homologous series. The colored dots on the horizontal lines in Fig. 5 mark where possible ions for each series could be found. The black dots show the ions with even integer masses, whereas the grey triangles represent the odd masses. According to the nitrogen rule, the even masses most likely contain an odd number of N atoms, and the odd masses an even number.
The clearest homologous series in Fig. 5 were−4 N and −10 N, corresponding to alkyl pyridines and alkyl
quino-lines, respectively. TheZ= −5 N series is in violation of the nitrogen rule, but is still believed to have been correctly identified. This series starts with C6H7N+, which is the
el-emental formula of phenylamine (aniline), but in this case it would have been charged by loss of an electron and not by addition of a proton as is the case for practically all other identified species. Another possibility is that C6H7N+forms
a stable seven membered ring of some sort. TheZ=0 N andZ= −2 N series are classified as alkyl pyrrolines and pyrroles, respectively. The 4N series corresponds to alkyl amines, which may be an important precursor for new par-ticle formation (Loukonen et al., 2010; Smith et al., 2009). A large peak at 214 Th may be an amine (C14H32N+), but
this could not be reliably determined. Recently Smith et al. (2009), measured the chemical composition of 10 nm par-ticles during a nucleation event in Hyyti¨al¨a, and found that the new particles contained considerable amounts of amines
50 100 150 200 250 300 350 400 450 500 −0.25
−0.2 −0.15 −0.1 −0.05 0
m/Q [Th]
Mass defect in Kendrick scale [Th]
Z=4N Z=4N Z=4N Z=2N Z=2N Z=2N Z=0N Z=0N Z=0N Z=−2N Z=−4N Z=−4N Z=−4N Z=−4N Z=−4N Z=−6N Z=−6N Z=−6N Z=−6N Z=−8N Z=−10N Z=−10N Z=−10N Z=−10N Z=−10N Z=−12N Z=−12N Z=−12N Z=−12N Z=−12N
Z=−5N Z=−5N Z=−5N
Odd Even
Fig. 5. Mass defects in Kendrick mass scale of the positive ion
spectrum. The mass defect becomes lower with increasing mass, possibly due to increasing ring structures, or additions of N and/or
O. The clearest homologuous series is that of alkyl pyridines atZ=
−4 N, and quinoline atZ= −10 N.
(23% of the detected ions were attributed to aminium salts). The ion atm/Q74 Th close to the 4 N line has been identified as an amine, but in the two day average used for this analysis, there is a double peak at thism/Qand thus the exact mass is not fit accurately enough for it to fall on the 4 N line.
One major feature of the positive mass spectrum is a steady decrease in the mass defect in the Kendrick mass scale with increasingm/Q(Fig. 5). Based on the ions identified so far, most of the positive ions include only C and H atoms, together with one N. If this is true also for the larger ions, they will most likely contain more ring structures, as the ad-dition of CH2groups would not cause a decrease in the mass
defect. Other possibilities are the additions of more nitrogen and oxygen. In Fig. 5, the majority of the ions fall closely on a decreasing curve, but there were approximately 10 ions, all at even masses in the range 70–150 Th, that clearly fell below this curve. Most of these have not been identified yet, but many of them seem to cluster readily with water. For in-stance, a series of peaks at 108.92, 126.93, and 144.94 Th are all separated by 18.01 Th, the mass of water being 18.010 Da. Considering the typical compounds identified in the pos-itive and negative ion spectra, an additional important re-sult was that the average bulk densities are very different between the polarities. The highly oxidized negative ions had very few H atoms, and the densities were mostly around 1.6 g cm−3 or above, whereas the positive ions contained
40
30
20
10
0
APi-TOF [cm
-3]
30.4.2009 1.5.2009 2.5.2009 3.5.2009 4.5.2009 5.5.2009 6.5.2009 Time
250
200
150
100
50
0
APi-TOF [cm
-3]
1000 800 600 400 200 0
Rad [W m
-2 ] & Conc [cm -3 ]
400 300 200 100 0
W dir [º]
60x106
50
40
30
20
10
0
CIMS H
2SO 4 [cm
-3
]
250x106
200
150
100
50
0
CIMS C
3H 4O 4 [cm
-3
]
CIMS H2SO4 HSO4
(H2SO4)2 • HSO4
H2SO4 • HSO4
SO5
Sub-5 nm particles Radiation Wind dir. C3H3O4
HNO3 • NO3
C3H4O4 • NO3
340.05 Th CIMS C3H4O4
A
B
C
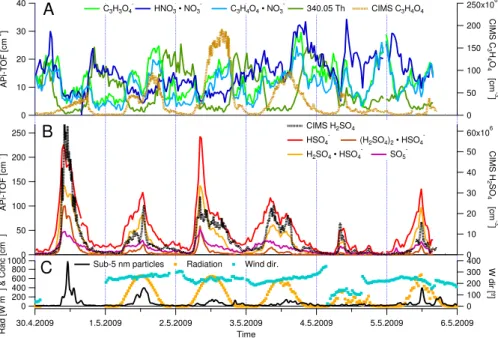
Fig. 6.Time trends of selected negative ions in Hyyti¨al¨a measured by the APi-TOF, with sulfate – related ions in the middle panel and nitric
acid and organics in the top panel. Also included in these are CIMS measurements of sulfuric and malonic acid (dotted lines). In the bottom panel radiation and wind direction are included (data for 30 April is missing), together with the concentration of sub-5 nm particles.
3.3 Time series and diurnal cycles
Owing to the high sensitivity of the APi-TOF, reasonable mass spectra could typically be observed for 5 min averag-ing. The longer the average, however, the better the obtained signal-to-noise ratio. When analyzing the time series of the selected ions, we used 30 min averages. Figure 6 shows the temporal behavior of some previously mentioned ions, to-gether with CIMS measurements (dotted lines) of H2SO4and
C3H4O4, and particle, radiation and wind direction
measure-ments at SMEAR II.
All the sulfuric acid related peaks had very similar time trends (panel B), as expected based on the high correlations presented in Fig. 3. The temporal behavior of HSO−4 mea-sured by the APi-TOF and neutral H2SO4concentration
re-ported by the CIMS agreed very well. This was not surpris-ing as HSO−4 is one of the anions with the lowest proton affin-ity, and is therefore very unlikely to transfer its charge upon collisions with other molecules. Thus the concentration of HSO−4 should follow the concentration of the neutral H2SO4.
This is not the case for the ions of weaker acids, which are limited not only by the neutral parent concentration, but also by the concentration of all the stronger acids to which they upon collision will donate their charge.
In Fig. 6a, the ion at 340.05 Th was used as a surrogate for all the night time molecules observed at the high masses, as their time behavior was similar. During the daytime, the signal of these peaks was down by a factor of 10 or more from their nighttime values. The malonic acid (103.00 Th) and malonic/nitric acid cluster (166.00 Th) signals tracked
each other very closely indicating that the cluster concentra-tion was mainly dependent on the malonic acid signal. The CIMS was designed and calibrated to measure sulfuric acid, but in this campaign it was also set to measure malonic acid. The ion signal was converted to a neutral concentration in the same way as for sulfuric acid and with the same calibra-tion coefficient (Pet¨aj¨a et al., 2009), which could introduce a bias. Nevertheless, during certain periods such as May 1 the trends were very similar. Malonic acid also seemed to be photochemically produced as the highest concentrations were observed during the sunny days.
Finally, the nitric acid dimer (124.98 Th) did not seem to have any clear diurnal cycle, although there was a fair amount of variability. As the H2SO4 dimer tracked the monomer
very well, we assumed that the nitric acid dimer also gave some representation of the nitric acid monomer behavior al-though we did not directly measure it due to negligible trans-mission below 80 Th for the APi-TOF configuration during this study.
For a closer look at average diurnal patterns, we plotted some selected negative ions as a function of time of day (Fig. 7) for the period shown in Fig. 6. Some picture of the prevailing meteorology during this period is seen in Fig. 6c. Pure sulfuric acid peaks and SO−5 behaved in a very similar way, roughly following the radiation intensity. SO−3 was at the edge of our transmission curve, and the signal was there-fore very low, but it also seemed to track the HSO−4 signal. On the other hand, when clustered with NO−3, both SO3and
120 100 80 60 40 20 0
Concentration [cm
-3]
18 12
6 0
Hour of day
6 5 4 3 2 1 0
Concentration [cm
-3
]
On right axis: C2H3SO6
H2SO4 • C2H3SO6
SO3
SO3 • NO3
SO4
SO4 • NO3
-On left axis: HSO4
H2SO4 • HSO4
(H2SO4)2 • HSO4
SO5
-In arbitrary units: Radiation Temperature
Fig. 7. Diurnal trends for selected sulfuric acid related negative
ions. The data is averaged over 30 April–5 May, 2009.
be a result of SO2typically peaking in the early morning, and
as briefly discussed in Sect. 3.1.1, being ionized to form SO−3 and possibly other charged sulfur oxides.
The two green traces representing the organosulfate and its cluster with H2SO4peaked in the afternoon, when the H2SO4
concentration was already going down. This could have been caused by a higher concentration of glyoxal (or its oxidation products) in the afternoon, producing more organosulfates through gas phase reactions at that time. Another possibility is that, as these molecules have been found in aerosol parti-cles (Galloway et al., 2009), the formation occurred via het-erogeneous reactions inside the particles and a small amount evaporated and was subsequently detected in the gas phase. This would explain the diurnal behavior which peaked a few hours after H2SO4, and thus a large amount of H2SO4had
al-ready condensed onto the particles, increasing the probability of reactions in the particle phase. Although evaporation of an organosulfate is thought to be very unlikely, the concen-tration peaked at the same time as the ambient temperature reached its maximum value, making it the most probable pe-riod when evaporated species could be detected. In Fig. 2 by Eisele et al. (2006), they presented a mass spectrum of neg-ative ions measured during high H2SO4 concentrations. It
showed a large unidentified peak at integerm/Q253 Th, and possibly a smaller peak at 155 Th, perhaps corresponding to a cluster of the organosulfate with sulfuric acid, and the pure organosulfate, respectively, suggesting that these are not spe-cific to Hyyti¨al¨a.
As seen in Fig. 8, malonic acid, nitric acid, and their clus-ter had very weak diurnal cycles. At the other extreme, the ions around 300–400 Th peaked during the night and were 10–20 times lower during the day. There was also an internal pattern visible, with 372.04 Th peaking first, and 308.06 Th peaking last. Assuming that the peaks were correctly identi-fied as C10H14NO−14 and C10H14NO−10, this implies that the
relative abundance of the most oxidized ions like 372.04 (O:C = 1.4) decreased during the night, and less oxidized
8
6
4
2
0
Concentration [cm
-3 ] 18 12 6 0
Hour of day 40
30
20
10
0
Concentration [cm
-3]
On right axis: 161.01 Th 224.00 Th 265.03 Th On left axis:
308.06 Th C3H3O4
340.05 Th C3H3O4 • NO3
342.07 Th HNO3 • NO3
372.04 Th
In arbitrary units: Radiation Temperature
Fig. 8. Diurnal trends for selected organic and nitric acid negative
ions. The data is averaged over 30 April–5 May, 2009.
ions like 308 (still with O:C = 1) increased. This makes sense qualitatively, as the primary night time oxidation hap-pens by O3and NO3(which is formed from O3), and the O3
in Hyyti¨al¨a usually decreased during night to reach a mini-mum in the early morning.
The last three plotted ions in Fig. 8 are related to the 161.01 Th peak (C5H5O−6, possibly a tricarboxylic acid). In
addition to C5H5O−6, its clusters with nitric acid and with
malonic acid were detected atm/Q224.00 and 265.03 Th, re-spectively. The diurnal patterns of these peak in the evening, with a local maximum in the early morning. In the previously discussed Fig. 2 in Eisele et al. (2006), a peak at 224 Th is tagged, possibly corresponding to HNO3·C5H5O−6.
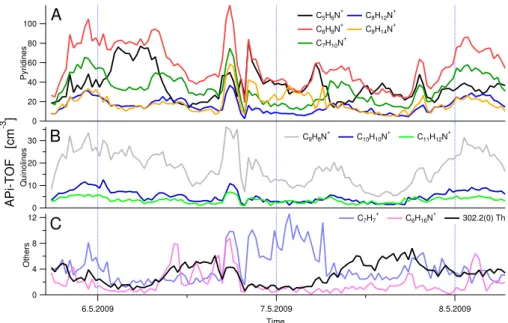
The time traces for positive ions (Fig. 9) do not show as much variability as the negative ions. All the n-alkyl pyridines, which are the most abundant ions, correlate fairly well with the exception of pure (protonated) pyridine, which at times even seems to anti-correlate with the pyridines with alkyl groups. The quinolines track both each other and most of the pyridines, implying that either the sources for these are the same, or that the lifetime of these molecules in the atmo-sphere is long enough that the ion concentration variations are controlled by the total amount of ions available.
Some ions that show more temporal variability are plotted in the bottom panel of Fig. 9. A very interesting ion was the tropylium ion C7H+7 (91.05 Th), to our knowledge measured
for the first time in ambient air, which is the only positive ion that we have identified which did not contain a nitrogen atom. The largest amine peak was C6H16N+detected at 102.13 Th,
100
80
60
40
20
0
Pyridines
6.5.2009 7.5.2009 8.5.2009
Time 30
20
10
0
Quinolines
12
8
4
0
Others
C5H6N +
C8H12N + C6H8N
+ C9H14N
+ C7H10N
+
C9H8N +
C10H10N +
C11H12N +
C7H7 +
C6H16N +
302.2(0) Th
APi-TOF [cm
-3 ]
A
B
C
Fig. 9.Time trends of selected positive ions in Hyyti¨al¨a measured by the APi-TOF, with pyridines in the top panel, quinolines in the middle,
and other ions in the bottom panel.
3.4 Implications for new particle formation
mechanisms
Ion-induced nucleation typically accounts for about 10% of the total nucleation in Hyyti¨al¨a (Gagn´e et al., 2009, and ref-erences therein). If the majority of the nucleation and growth occurs via neutral pathways, we must assess what insight into the new particle formation we can gain through the investi-gation of ambient ions.
The main candidate for the initial nucleation steps has long been sulfuric acid (Weber et al., 1997; Kulmala et al., 2006). Since sulfuric acid ionizes very easily, the APi-TOF is very sensitive to it, and also its clusters, as shown above. The composition of the neutral clusters and molecules and the ions are not expected to be exactly the same, but the ion composition is governed by available neu-tral molecules. The total ion concentration is determined by production (mainly cosmic rays/radon) and loss (coag-ulation/deposition/recombination) rates, but the distribution of the ions is determined by the concentrations and proton affinities of the neutral molecules/clusters. If the composi-tion of the new particles/clusters is mainly sulfuric acid, then they should also be easily ionized and thus detected by the APi-TOF. At ambient pressure and RH, most neutral sulfu-ric acid molecules and clusters will have water molecules at-tached to them. Although to a much lesser extent than ammo-nia or amines, water can also stabilize pure sulfuric acid clus-ters. Recently Smith et al., 2009, proposed that the stability of newly nucleated particles is largely due to acids and bases forming salts. In this case, the APi-TOF would be optimal for measuring the precursor vapors, as the strongest bases and acids should make the most stable salts, and should also
be most easily ionized in the atmosphere. However, once the salts have been formed in the new particles/clusters, they will no longer become easily charged, and any mass spectromet-ric detection with the APi-TOF without a charging mecha-nism is no longer possible.
Although only clearly visible during one day, the detec-tion of the sulfuric acid tetramer clustered with ammonia can be a very strong indication of a particle formation path-way. As seen in Fig. 6c, the highest sub-5 nm concentra-tions were also measured during that specific day. Accord-ing to the results of Hanson and Lovejoy (2006) and Ortega et al. (2008) pure, neutral sulfuric acid clusters are not ther-modynamically stable enough to be present in any significant concentrations in the lower troposphere. However, if nega-tively charged, or if clustered with e.g. ammonia or amines, the clusters become much more stable. The observation of clusters with the APi-TOF requires them to be charged, but the evaporation rate of NH3from ion clusters with low
H2SO4/NH3ratio is very high (Hanson and Lovejoy, 2006),
which explains why we have not measured ammonia clus-tered with the H2SO4 dimer or trimer. The detection of a
charged sulfuric acid/ammonia cluster strongly implies the presence of many more of corresponding neutral clusters.
in Hyyti¨al¨a is of the order of 1 cm−3s−1(Manninen et al.,
2009a; Dal Maso et al., 2005), the absolute cluster concen-trations need not be very high to be important.
Organosulfates were identified in the gas phase, implying that chemical reactions of sulfuric acid in the gas or parti-cle phase are occurring during photochemical production of H2SO4and secondary organics. The importance of this
find-ing is still unclear. The same organosulfate was detected pre-viously in a chamber study (Galloway et al., 2009), and pos-sibly also observed (though not firmly identified) on another continent (Eisele et al., 2006).
4 Conclusions
The APi-TOF was deployed in a boreal forest site in southern Finland, where it measured the composition of positive and negative ambient ions. Although the reported measurements only cover 9 days during the peak new particle formation sea-son in Hyyti¨al¨a, we believe that these measurements make a good representation of spring/early summer time ion compo-sition and dynamics in this region. The elemental composi-tion of close to 80 ions was identified with a high degree of certainty. Several of these ions were identified for the first time, and for many ions also the molecular formulas were estimated. Quantum chemical calculations were carried out to assist the identification process. A list of all identified ions is given in the supplementary material, together with a com-plete list of masses of all observed ions.
During sunny days the negative ion spectrum is dominated by sulfuric acid and its clusters. SO−5 was also observed, usually making up∼20% of the HSO−
4 signal. The di-, tri-,
and tetramer sulfuric acid clusters correlated with new par-ticle formation events in Hyyti¨al¨a, in line with studies on the important role of sulfuric acid in atmospheric nucleation (Weber et al., 1997; Pet¨aj¨a et al., 2009; Sipil¨a et al., 2010). Additionally, the sulfuric acid tetramer was found in a cluster with ammonia, suggesting that sulfuric acid/ammonia nucle-ation may be significant in Hyyti¨al¨a. The observnucle-ation of a H2SO4/NH3ion cluster means that these clusters are
abun-dant in the neutral cluster distributions.
No strong diurnal behavior was seen in the positive ion spectrum. In both day and night time, the spectrum below 200 Th was dominated by alkyl pyridines and quinolines, and at 200–400 Th a more continuous spectrum of peaks was vis-ible. Kendrick analysis revealed additional homologous se-ries below 200 Th, of alkyl amines, pyrroles, and pyrrolines. The first observations of organosulfates in the gas phase were made during this study, possibly formed from the reac-tion of sulfuric acid with the oxidareac-tion products of glyoxal, either in the particle phase or the gas phase. Whatever the formation mechanism, these organosulfates are expected to be extremely low-volatile, and formed from sulfuric acid, a low-volatility trace gas itself, making the expected concen-trations extremely low. Nevertheless, they are visible in the
ion spectrum, proving how sensitive the APi-TOF can be to certain species. The importance of these molecules for new particle formation is still unclear.
During night, the negative ion spectrum was dominated by ions in the range 280–420 Th. These are thought to be highly oxygenated organic acids, possibly formed from the oxida-tion of monoterpenes emitted from the vegetaoxida-tion, but more work needs to be done to confirm the composition of these ions, as is the case with the ions at similar masses in the pos-itive spectrum. The average mass defect of the negative ions corresponds to O:C:H ratio of 1:1:1, very similar to the com-position of highly oxidized organics observed in secondary aerosol via high resolution mass spectrometry.
We established the APi-TOF measurements of ambient ions as a powerful tool in studying nucleation in the atmo-sphere, whether neutral or ion-induced. In the future, the peak identification schemes will be improved and the APi-TOF instrument as an ambient ion detector will be deployed in various environments to probe the differences in the chem-ical composition of the atmospheric ions. Ionization schemes will be developed to be able to quantitatively investigate the composition of neutral clusters in the atmosphere.
Appendix A
Quantum chemical calculations
A1 Computational details
All calculations were performed using the Gaussian 09 pro-gram suite (Frisch et al., 2009) and the CBS-QB3 method (Montgomery et al., 1999, 2000). CBS-QB3 is a compos-ite method involving geometry optimizations and harmonic vibrational frequency calculations with the B3LYP density functional and a triple-zeta basis set, followed by a series of energy calculations aiming at estimating the basis-set limit CCSD(T) energy. Errors in vibrational frequencies and the imbalance of electron spin contributions are accounted for by using empirical scaling factors. For a test set of single molecules, the CBS-QB3 binding energies are accurate to within about 1 kcal/mol (Montgomery et al., 2000). Proton affinities (PA) for all species X were computed as−1 times the standard (298 K and 1 atm reference pressure) enthalpy change of the X+H+=>XH+ reaction, with the enthalpy
Table A1. Deprotonation electronic energies, conjugate anion proton affinities and gas-phase acidities for selected acids, computed at the CBS-QB3 level.
Species Deprotonation Proton affinity of Gas-phase
1Eelec, kcal/mol conjugate anion, kcal/mol acidity, kcal/mol
C2H2O4(oxalic acid) 329.6 322.6 314.6 (316.2±0.15a)
C3H4O4(malonic acid) 326.5 318.2 311.3 (314.8±0.03a)
C4H6O4(succinic acid) 331.1 322.8 316.3 (317.8±0.01a)
HNO3(nitric acid) 332.1 323.5 (324.5±0.2b) 317.2 (317.8±0.2b)
CH3SO3H (methylsulfonic acid) 323.5 317.3 310.5 (315.0a)
H2SO4(sulfuric acid) 317.4 311.1 (306.4±3.1c) 302.7 (299.0±3.1c)
aExperimental value, (Kumar et al., 2005); bExperimental value; (Davidson et al., 1977); cExperimental value, (Wang et al., 2000).
Fig. A1. Minimum-energy structures (at the CBS-QB3 level) of hydrogenoxalate (left), hydrogenmalonate (center) and hydrogensuccinate
(right) ions. Color coding: red = oxygen, brown = carbon, white = hydrogen.
in the chemical sense (i.e. low numerical PA values for the conjugate ions or low numerical GA values for the acids).
A2 Computed proton affinities and gas-phase acidities,
and error analysis
The computed de-protonation electronic energies (not in-cluding zero-point energies), conjugate base anion proton affinities and gas-phase acidities for oxalic, malonic, suc-cinic, nitric, sulfuric and methylsulfonic acid are given in Ta-ble A1. AvailaTa-ble experimental data are also given. All data agree on the general relative ordering of these six species. In the gas phase, sulfuric acid is the strongest acid, followed by methylsulfonic, malonic, oxalic, succinic and nitric acid. The values for methylsulfonic and malonic acid are very close to each other, as are the values for succinic and nitric acid.
As shown in Fig. A1, the hydrogenoxalate, hydrogen-malonate and hydrogensuccinate ions all contain an inter-nal hydrogen bond. While the rings formed by the hydrogen bonding in the hydrogenoxalate and hydrogensuccinate ions contain five and seven atoms, respectively, and are somewhat strained, the ring in the hydrogenmalonate ion contains pre-cisely six atoms, and is hence much stronger. This is reflected in the computed hydrogen bond lengths (1.669 ˚A for hy-drogenoxalate, 1.364 ˚A for hydrogenmalonate and 1.437 ˚A for hydrogensuccinate) as well as the proton affinities of the ions and gas-phase acidities of the acids (Table A1).
Given the 1 kcal/mol accuracy of the CBS-QB3 method for the test set of Montgomery et al., 2000, the differences of around 2–4 kcal/mol between the experimental and com-puted proton affinities or gas-phase acidities for all but the nitric and succinic acids (and corresponding ions) are both surprising and disappointing. For oxalic and malonic acid, part of the difference between computed and measured val-ues is likely caused by internal rotations in the neutral acid molecules, which serve to lower the entropy and thus sta-bilize the neutral acids compared to the more rigidly bound ions. This leads to larger GA values (weaker acidities) than predicted using the harmonic oscillator approximation. Test calculations using the hindered rotor package of the Gaussian 09 program indicate that the magnitude of this error is around 0.5 kcal/mol with respect to the free energies. The free acids are also likely to have a larger number of low-energy con-formers, which might further increase their entropy, and af-fect the GA values by a similar amount. For sulfuric acid, part of the errors in the free energies are likely caused by the internal rotations of the HSO−4 ion, as described e.g. by Kurt´en et al. (2007). Methylsulfonic acid may be associated with similar problems due to the almost unhindered rotation of the methyl group.
Fig. A2.Minimum-energy structures of the HSO−4·C2H2O2(left) HSO−4·C3H4O4(middle) and C3H3O4−·C3H4O4(right) clusters, at the CBS-QB3 level. Color coding: yellow = sulfur, red = oxygen, brown = carbon, white=hydrogen. Note that the minimum-energy structure of
HSO−4·C3H4O4actually corresponds to H2SO4·C3H3O−4 as the negatively charged carbonyl oxygen is stabilized by two strong hydrogen
bonds (one intramolecular and the other intermolecular). Also, the C3H3O−4·C3H4O4minimum-energy structure is predicted to contain only
one intermolecular hydrogen bond, as two of the hydroxyl groups prefer to participate in intramolecular bonds.
Fig. A3.Minimum-energy structures of the neutral (left) and ionic
(right) forms of glycolic acid sulfate (top) and glyoxal sulfate (bot-tom), at the CBS-QB3 level. Color coding: yellow = sulfur, red = oxygen, brown = carbon, white = hydrogen.
and the potential energy surface is described by a double well rather than a single minimum. This leads to very large errors in the computed vibrational frequencies. Instead of one typ-ical bonded O-H stretching vibration around 3000 cm−1, the hydrogenmalonate ion has four different vibrations in the re-gion between 1500 and 2000 cm−1, all of which correspond
to some type of motion of the O-H. . . O group. A test cal-culation at the MP2/6-311++G(2d,2p) level yielded a similar structure and similar frequencies, indicating that the problem is neither the lack of diffuse functions in the basis set nor the (known) deficiencies in the B3LYP description of hydro-gen bonding. An anharmonic frequency calculation using the same level of theory as the CBS-QB3 geometry optimiza-tion (B3LYP/6-311G(d,p)) decreased two of the O-H. . . O group’s vibrational frequencies to below 800 cm−1 (a
de-crease of over 1000 cm−1!) indicating the large effect of the double well potential on the computed values. Note that the anharmonic frequencies, which are also computed assuming a single minimum, are certainly not a good starting point for entropy calculations, either – they simply illustrate the mag-nitude of the problem. A full statistical-mechanical treatment of vibrational motion in a multidimensional double-well
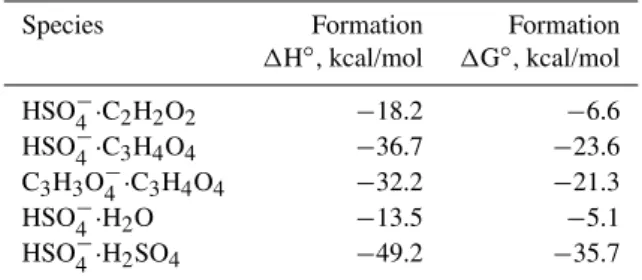
po-Table A2. CBS-QB3 formation enthalpies and free energies (at
298 K and 1 atm reference pressure) for selected anion dimer clus-ters.
Species Formation Formation
1H◦, kcal/mol 1G◦, kcal/mol
HSO−4·C2H2O2 −18.2 −6.6
HSO−4·C3H4O4 −36.7 −23.6
C3H3O−4·C3H4O4 −32.2 −21.3
HSO−4·H2O −13.5 −5.1
HSO−4·H2SO4 −49.2 −35.7
tential is beyond the scope of this study. Similar problems are encountered in treating the short internal hydrogen bond of butene diol (H. Kjaergaard, personal communication, 2010). Other possible error sources, in addition to inaccuracies in the CBS-QB3 energies, may include different definitions for the thermodynamic values for the free proton, as well as issues related to the choice of reference compounds in the ex-periments. For our purposes, the precise values in any case matter less than the relative ordering, on which all the differ-ent data agree.
A3 Clustering
To investigate the possible chemical identity of the peaks seen at 155 and 201 Th (corresponding to elemental compo-sitions of C2H3SO−6 and C4H5SO−8, respectively) we
com-puted the formation enthalpies and free energies of clusters of HSO−4 with glyoxal and malonic acid, as these could ex-plain the two peaks. Several structural isomers have been studied for each cluster type, but only the most stable ones are displayed and discussed here. These are given in Ta-ble A2. The corresponding cluster structures are shown in Fig. A2. Shown also for comparison are the binding ener-gies for HSO−4·H2O and HSO−
4·H2SO4clusters, as well as
structures). As for hydrogenmalonate, the low proton affini-ties are caused by the formation of very strong intermolecular hydrogen bonds in the ions.
When comparing clusters of HSO−4 with sulfuric acid and malonic acid, it should be noted that the evaporation rates corresponding to these formation free energies are both low enough to be completely negligible. Evaporation rates are on the order of 10−16s−1 and 10−8s−1 for HSO−4·H2SO4
and HSO−4·C3H4O4, respectively. Thus, the difference in the
formation free energies does not in practice play a role in determining their relative concentrations. For practical pur-poses, whenever a cluster of HSO−4 with sulfuric or malonic acid is formed, it never evaporates, but is removed solely by growth, coagulation and/or neutralization. Similar consider-ations very probably apply also for clusters of the hypotheti-cal 155 Th organosulfate ion with other strong acids such as sulfuric acid. It is important to stress that the concentrations of the small ionic clusters is not in thermodynamic equilib-rium (in which e.g. free HSO−4 would not exist at all) but at best in a dynamic steady state, to which the evaporation in the measurement instrument adds its own signature.
Supplementary material related to this article is available online at:
http://www.atmos-chem-phys.net/10/8513/2010/
acp-10-8513-2010-supplement.pdf.
Acknowledgements. We thank the CSC IT centre for scientific
computing for computer time. T. K. thanks H. G. Kjaergaard for helpful discussions on intramolecular H-bonding. This work has been supported by the European Commission 6th Framework pro-gram project EUCAARI (contract no 036833-2), Advanced Grant EU-FP7-ATMNUCLE (project no 227463), and by the Academy of Finland Center of Excellence program (project no 1118615).
Edited by: A. Wiedensohler
References
Aiken, A. C., DeCarlo P. F., Kroll, J. H., Worsnop, D. R. Huffman, J. A., Docherty, K., Ulbrich, I. M., Mohr, C., Kimmel, J. R. Sueper, D., Zhang, Q., Sun, Y. Trimborn, A., Northway, M., Ziemann, P. J., Canagaratna, M. R., Onasch, T. B., Alfarra, R., Prevot, A. S. H., Dommen, J., Duplissy, J., Metzger, A., Baltensperger, U., and Jimenez J. L.: O/C and OM/OC Ratios of Primary, Secondary, and Ambient Organic Aerosols with High Resolution Time-of-Flight Aerosol Mass Spectrometry, Environ. Sci. Technol., 42, 4478–4485, doi:10.1021/es703009q, 2008.
Andreae, M. O. and Rosenfeld, D.:
Aerosol-cloud-precipitation interactions. Part 1. The nature and sources
of cloud-active aerosols, Earth-Sci. Rev., 89, 13–41,
doi:10.1016/j.earscirev.2008.03.001, 2008.
Asmi, E., Sipil¨a, M., Manninen, H. E., Vanhanen, J., Lehtipalo, K., Gagn´e, S., Neitola, K., Mirme, A., Mirme, S., Tamm, E., Uin, J., Komsaare, K., Attoui, M., and Kulmala, M.: Results of the first air ion spectrometer calibration and intercomparison workshop,
Atmos. Chem. Phys., 9, 141–154, doi:10.5194/acp-9-141-2009, 2009.
Dal Maso, M., Kulmala, M., Riipinen, I., Wagner, R., Hussein, T., Aalto, P. P., and Lehtinen, K. E. J.: Formation and growth of fresh atmospheric aerosols: eight years of aerosol size distribution data from SMEAR II, Hyyti¨al¨a, Finland, Boreal Env. Res., 10, 323– 336, 2005.
Davidson, J. A., Fehsenfeld, F. C., and Howard, C. J.: Heats of
For-mation of NO3- and NO3- Association Complexes with HNO3
and HBr, Int. J. Chem. Kinet., 9, 17–29, 1977.
DeCarlo, P. F., Kimmel, J. R., Trimborn, A., Northway, M. J., Jayne, J. T., Aiken, A. C., Gonin, M., Fuhrer, K., Horvath, T., Docherty, K. S., Worsnop, D. R., and Jimenez, J. L.: Field-deployable, high-resolution, time-of-flight aerosol mass spectrometer, Anal. Chem., 78, 8281–8289, doi:10.1021/Ac061249n, 2006. Ehn, M., Junninen, H., Schobesberger, S., Manninen, H. E.,
Franchin, A., Sipil¨a, M., Pet¨aj¨a, T., Kerminen, V.-M., Tam-met, H., Mirme, A., Mirme, S., H˜orrak, U., Kulmala, M., and Worsnop, D. R.: An instrumental comparison of mobility and mass measurements of atmospheric small ions, Aerosol Sci. Tech., submitted, 2010.
Eisele, F. L.: Natural and transmission line produced positive ions, J. Geophys. Res. A., 94, 6309–6318, 1989a.
Eisele, F. L.: Natural and anthropogenic negative ions in the tropo-sphere, J. Geophys. Res. A., 94, 2183–2196, 1989b.
Eisele, F. L. and Tanner, D. J.: Identification of ions in continental air, J. Geophys. Res. A., 95, 20539–20550, 1990.
Eisele, F. L. and Tanner, D. J.: Measurement of the gas-phase
con-centration of H2SO4and methane sulfonic-acid and estimates of
H2SO4production and loss in the atmosphere, J. Geophys. Res.
A., 98, 9001–9010, 1993.
Eisele, F. L., Lovejoy, E. R., Kosciuch, E., Moore, K. F., Mauldin, R. L., Smith, J. N., McMurry, P. H., and Iida, K.: Negative at-mospheric ions and their potential role in ion-induced nucleation J. Geophys. Res. A., 111, D04305, doi:10.1029/2005jd006568, 2006.
Enghoff, M. B. and Svensmark, H.: The role of atmospheric ions in aerosol nucleation – a review, Atmos. Chem. Phys., 8, 4911– 4923, doi:10.5194/acp-8-4911-2008, 2008.
Frisch, M. J., Trucks, G. W., Schlegel, H. B., Scuseria, G. E., Robb, M. A., Cheeseman, J. R., Scalmani, G., Barone, V., Men-nucci, B., Petersson, G. A., Nakatsuji, H., Caricato, M., Li, X., Hratchian, H. P., Izmaylov, A. F., Bloino, J., Zheng, G., Sonnenberg, J. L., Hada, M., Ehara, M., Toyota, K., Fukuda, R., Hasegawa, J., Ishida, M., Nakajima, T., Honda, Y., Kitao, O., Nakai, H., Vreven, T., Montgomery, J. J. A., Peralta, J. E., Ogliaro, F., Bearpark, M., Heyd, J. J., Brothers, E., Kudin, K. N., Staroverov, V. N., Kobayashi, R., Normand, J., Raghavachari, K., Rendell, A., Burant, J. C., Iyengar, S. S., Tomasi, J., Cossi, M., Rega, N., Millam, J. M., Klene, M., Knox, J. E., Cross, J. B., Bakken, V., Adamo, C., Jaramillo, J., Gomperts, R., Stratmann, R. E., Yazyev, O., Austin, A. J., Cammi, R., Pomelli, C., Ochter-ski, J. W., Martin, R. L., Morokuma, K., ZakrzewOchter-ski, V. G., Voth, G. A., Salvador, P., Dannenberg, J. J., Dapprich, S., Daniels, A. D., Farkas, O., Foresman, J. B., Ortiz, J. V., Cioslowski, J., and Fox, D. J.: Gaussian 09, Wallingford CT, 2009.