Some factors affecting on the behavior of steel electrode in citric
acid solutions.
A.Diab
1, 2and S. M. Abd El Haleem
11
Chemistry Department, Faculty of Science, Zagazig University, Zagazig, Egypt. 2
Chemistry Department, Faculty of Science, Gizan University, Gizan (KINGDOM OF SAUDI ARABIA).
Abstract
Potential-time curves are constructed for the steel electrode in naturally aerated citric acid solutions devoid of
and containing some aggressive and inhibitive compounds. Cl- and SO42- ions cause the destruction of passivity
and initiation of pitting corrosion. The rate of oxide film growth by citric acid and oxide film destruction by Cl-
and SO42- ions follows a direct logarithmic law as evident from the linear relationships between the open-circuit
potential and the logarithm of immersion time. Urea, phenylhydrazine and 1,2-phenylenediamine compounds inhibit the pitting corrosion of steel. The rate of oxide film healing and thickening increases with their concentrations. In presence of constant inhibitor concentration, the efficiency of pitting inhibition increases in the order: (weak) urea<phenylhydrazine<1,2-phenylenediamine(strong).
Key words:
Steel, Citric acid, Oxide film thickening, Aggressive, Corrosion, Inhibition.I.
Introduction
Iron and its alloys (e.g. steels) are always exposed to the action of acids in industry [1]. Processes in which acids play a very important part are acid pickling, industrial acid cleaning, cleaning of oil refinery equipment, oil well acidizing and acid descaling [1, 2]. The exposures can be most severe but in many cases, corrosion inhibitors are widely used in the industry to prevent or to reduce the corrosion rates of metallic materials in these media.
Corrosion: Corrosion is the gradual physiochemical
destruction of materials by the action of environment. It is also known as the deterioration of materials or its properties because of reaction with its environment. The word corrosion comes from the Latin word
“corrodere”, which means to gnaw away. It usually
begins at the surface of a material and occurs because of the spontaneous tendency of the materials to return to their thermodynamic stable state or to one of the forms in which they were originally found. Metals are generally prone to corrosion because most of them occur naturally as ores, which is the most stable state of low energy and there is a net decrease in free
energy ΔG from metallic to oxidized state [3].
Acid corrosion inhibitors find vast application in the industrial field as components in acid descaling, oil well acidizing, acid pickling, acid cleaning, etc. Most of the efficient corrosion inhibitors used in industry are organic compounds having multiple bonds and hetero atoms like N, O, S through which they are adsorbed on the metal surface [4-11]. The influence of such organic compounds on the corrosion of steel in acidic solution has been investigated by several researchers [12-14]. The
inhibition property of these compounds is attributed to their molecular structure [15].
Citric acid is the natural organic acid produced in oranges and other citric fruits. It is generally regarded as safe for use in food products. It is a common material used in many food and beverages sold on the market. This means that citric acid is compatible with the environment and can usually be blended into sanitary sewage systems with environmental agency approval. The electrochemical behavior of steel electrode immersed in citric acid solutions has been followed and discussed using potential measurements under open-circuit conditions [16]. The effect of increasing concentrations, temperature of solution and addition of some organic compounds are also investigated. It is found that, the steel electrode can be passivated in naturally aerated solutions of citric acid and the rate of oxide film growth follows a direct logarithm law, as evident from the linear relationship between the open-circuit potential and the logarithm of immersion time. The rate of oxide film growth decreases by raising the solution
temperature. The addition of some organic
compounds as urea, phenylhydrazine and 1,2-phenylenediamine decrease the destruction of the passive film and thus increase the inhibition process [16].
The aim of the present work is to shed more light on the effect of chloride and sulphate ions on the rate of oxide film formed on a steel electrode in citric acid solutions. The effect of increasing concentrations of
Cl- and SO42- ions and temperature changes
(25-55oC) on the rate of oxide film healing and destructed
phenylenediamine on the stability of the oxide film formed is also examined.
II.
Experimental
The steel electrodes were made from steel samples produced by the Egyptian Mill steel Company (Helwan- Cairo) and having the following chemical composition:
C Si Mn P S Fe
0.32 0.24 0.89 0.024 0.019 98.507 mass %
The steel electrodes were fixed to borosilicate glass tubes with epoxy resin so that the total exposed
surface area was 1.33 cm2. Electrical contacts were
achieved through thick copper wires soldered to the ends of the steel rods not exposed to the solution. Before being used, the steel electrodes were abraded into uniform surfaces by a grinding machine (model Jean Wirtz TG 200, Germany) using successive 0-, 00- and 000-grades emery papers, rinsed with acetone and finally washed with triply distilled water before immersing in the test solution.
The potential of the steel electrode was measured in naturally aerated 0.5 M citric acid solutions to the nearest mV on a Wenking potentiometer Type PPT 70 relative to the saturated calomel electrode (SCE). The steady- state potentials were considered as those values which did not change by more than 1 mV in 10 minutes. Furthermore, the effect NaCl and
Na2SO4 on the passivity of steel electrode in citric
acid solution was investigated. Addition of some organic inhibitors including urea, phenylhydrazine and 1,2-phenylenediamine on the behavior of steel in citric acid was also investigated. Scanning electron micrographs for steel samples, after immersion in the tested solutions for 2 h, were undertaken using a
Jeol scanning electron microscope, JSM-T
100(Japan).
Electrolytic solutions were prepared from analytical grade reagents and triply-distilled water. Solutions of citric acid with different concentrations were prepared by dissolving the corresponding quantitative weights of solid citric acid in the appropriate volumes of distilled water. The effect of
adding variable concentrations of NaCl, Na2SO4
ranged from 1x10⁻⁴M to 1M was tested in the
presence of definite concentration of citric acid as 0.5M. The addition of increasing concentrations of urea, phenyl hydrazine and 1,2-phenylenediamine were prepared with a tested concentration of citric acid 0.5M and the adjusted concentration of
aggressive Cl- ion as 0.1M .The cell has a double
wall jacket through which water, at the adjusted temperature, was circulated. Measurements were
carried out at a constant temperature 25 0.1C,
except those related to the effect of temperature. The cell temperature was controlled using an ultra-thermostat type polyscience (USA). The main joint of
the cell contains openings for both the steel electrode and the reference electrode (SCE). The effect of
temperature on 0.5Mcitric acid + 0.1M Cl- ions was
carried out at (25C - 55C). No trails were made to
measure the oxygen content of the solution.
III.
Results and discussion
3.1. Effect of chloride and sulphate ions on the behavior of the steel electrode in naturally aerated citric acid solution
The curves in Fig. 1(A and B) represent the variation of the open-circuit potential, E, of the steel electrode with time in naturally aerated solutions of 0.5 M citric acid devoid of- and containing increasing
concentrations of NaCl and Na2SO4, respectively.
Inspection of the curves of this figure reveals that the
steady-state potentials, Est, of the steel electrode in
aggressive ions-free citric acid solutions are
invariably approached from negative values
0 20 40 60 80 100 120 140 160 180 -660
-640 -620 -600 -580 -560 -540 -520 -500 -480 -460 -440 -420 -400
Time, min.
E
le
c
t
r
o
d
e
p
o
t
e
n
t
ia
l,
m
V
(
S
C
E
)
1 0 M NaCl
2 1x10⁻⁴
M NaCl
3 5x10⁻⁴
M NaCl
4 1x10⁻³
M NaCl
5 5x10⁻³
M NaCl
6 1x10⁻²
M NaCl
7 0.1 M NaCl
8 0.5 M NaCl
9 0.75 M NaCl
10 1 M NaCl
1 2
3 4 5 6 7
8
9 10
(A)
0 20 40 60 80 100 120 140 160 180 -720
-700 -680 -660 -640 -620 -600 -580 -560 -540 -520 -500 -480 -460 -440 -420 -400
E
le
c
tr
o
d
e
p
o
te
n
tia
l,
m
V
(
S
C
E
)
Time, min.
1 0 M Na 2SO4 2 1x10⁻⁴
M Na2SO4
3 5x10⁻⁴ M Na2SO4
4 1x10⁻³ M Na
2SO4 5 5x10⁻³
M Na2SO4
6 1x10⁻² M Na2SO4
7 5x10⁻² M Na
2SO4 8 0.5 M Na2SO4
9 0.75 M Na2SO4 10 1 M Na2SO4 1
2
3
4
5 6
7
8 9
10
Fig.1 (A and B) Variation of the open circuit potential, E, of the steel electrode with time in solutions of 0.5 M citric acid in presence of increasing addition of (A) NaCl and (B) Na2SO4.
(B)
latter ions increases, oxide film destruction predominates oxide film healing and growth. (iii) At still higher concentrations of the aggressive ions (1 M solution), the final steady-state potentials are reached from less negative values and become more active the higher the concentration of the aggressive anions. The shift of the open-circuit potential of the steel electrode to more negative values is related to the destruction and the continuous dissolution of the protective passive film by the present aggressive anions with the initiation of localized attack, the extreme of which is pitting corrosion.
(A)
(B)
(C)
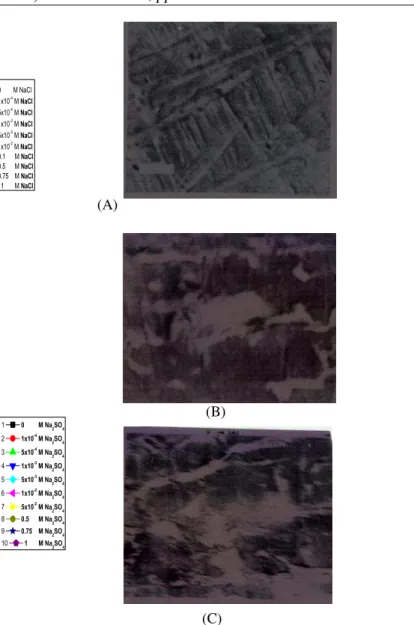
Fig. 2. SEM micrographs of steel electrode surface
after immersion for a period of 2 h in (A) 0.5 M citric acid (free) and 0.5 M citric acid in presence of
(B) 0.1 M Cl- ions and (C) 0.1 M SO42- ions,
respectively.
Fig. 2(A–C) represent the scanning electron
micrographsof thesteel electrode samples immersed for 2 h in naturally aerated 0.5 M citric acid solutions
devoid of and containing 0.1 M of Cl- and SO42- ions,
-4 -3 -2 -1 0 -750 -700 -650 -600 -550 -500 -450 -400 Est , m V ( S C E )
log Cagg., M
Fig.3. Variation of the steady state potential, E
st., with log Cagg., for steel electrod
in 0.5 M citric acid in different concentration of NaCl and Na
2SO4.
Na2SO4
NaCl
The curves in Fig. 3 represent the variation of the
steady-state potential, Est, of the steel electrode in
solutions of 0.5 M citric acid, with the logarithm of
the molar concentration of Cl- and SO4
2- ions. Sigmoidal S-shaped curves are obtained which reveal that the initiation of pitting corrosion on the steel by chloride and sulphate ions takes place by the way of an adsorption mechanism. The way by which the open-circuit potential of the steel electrode, E, approaches the final steady-state values in solutions of citric acid devoid of- and containing increasing
concentrations of the aggressive Cl- and SO42- ions
is of interest. As can be seen from the curves in Fig. 4(A and B), E varies linearly with the logarithm of
the immersion time, t, in minutes according to[17,18–
24]:
E = a1+ b1 log t (1)
where a1 and b1 are constants. The value of the
constant b1 decreases with increasing the aggressive
ions concentration. This behavior indicates that oxide film thickening and/or destruction on the steel
electrode, under the prevailing experimental
conditions, follows a direct logarithmic growth law. A brief review of the oxidation theories indicates that no sound theory of general applicability exists for the direct logarithmic oxidation kinetics of metals at low temperatures [25, 26].
The linearity of the open-circuit potential with the logarithm of time during oxide film growth has been modeled by several investigators. In general, the growth of oxide films is controlled by the diffusion of ions and electrons under the influence of gradients in their concentration and electric potential
[25–29].A generic model describing the kinetics of
oxide film growth on metals, at low temperatures, under theeffect of a high electric field was proposed byCabrera and Mott [28]. This model is based on the
0.6 0.8 1.0 1.2 1.4 1.6 1.8 2.0 2.2 2.4 -720 -700 -680 -660 -640 -620 -600 -580 -560 -540 -520 -500 -480 -460 -440 -420 -400 -380
1 0 M NaCl 2 1x10⁻⁴ M NaCl
3 5x10⁻⁴ M NaCl
4 1x10⁻³ M NaCl
5 5x10⁻³ M
NaCl
6 1x10⁻²
M NaCl
7 0.1 M NaCl
8 0.5 M NaCl
9 0.75 M NaCl
10 1 M NaCl
E le c tr o d e p o te n ti a l, E , m V ( S C E ) 1 2 3 4 5 6 7 8 9 10 log time, min.
(A)
0.6 0.8 1.0 1.2 1.4 1.6 1.8 2.0 2.2 2.4 -660 -640 -620 -600 -580 -560 -540 -520 -500 -480 -460 -440 -420 -400 -380
log time, min.
E le c tr o d e p o te n ti a l, m V ( S C E )
1 0 M Na 2SO4 2 1x10⁻⁴
M Na 2SO4
3 5x10⁻⁴ M Na
2SO4
4 1x10⁻³ M Na
2SO4
5 5x10⁻³ M Na
2SO4
6 1x10⁻² M Na2SO4
7 5x10⁻² M Na2SO4
8 0.5 M Na 2SO4
9 0.75 M Na 2SO4
10 1 M Na2SO4
Fig.4 Variation of the open circuit potential, E, of the steel electrode immersed in 0.5 M citric acid in presence of increasing addition of (A) NaCl and (B) Na2SO4 respectively, with the logarithm of immersion time.
1 2 3 4 5 6 7 8 9 10 (B)
assumption that cation migration occurs under the influence of a potential build up across the growing oxide film and explains the logarithmic kinetics of oxide film thickening on copper and iron [29]. Shimizu et al. [27] explained the linear relationships between the open-circuit potential and time on the basis that electron tunneling through the growing oxide is the rate determining step for the cathodic process. Burstein and Organ [23, 24], on the other hand assumed that oxide film growth follows the
high field equation [27–32], while others
[33,34]proposed the direct logarithmic equation to describe the kinetic form of the linear increase of potential with the logarithm of time. All iron oxides tend to be non-stoichiometric. With the exception of
α-Fe2O3, the structure of iron oxides may be
visualized as cubic close packed arrays of oxide ions
with certain number of Fe2+ and/or Fe3+ ions
high field strength, Ohm‟s law does not apply, and
ion transport is governed by the familiar
Guntherschulze& Betz relationship [31]. ia=Kaexp(βH) (2)
where Kaand β are constants, and H is the effective
field strength. Under open circuit conditions, ia can
originate from the specific adsorption of the present anions on the oxide covered metal [18]. This creates image charges of the same magnitude but of opposite sign at the oxide/metal interface, sufficient to promote ion transferthrough the oxide to the film/solution interface. The field strength depends on the nature and charge of the anions, and to a lesser extent on its concentration. Assuming, however, that all the potential differences in the electrical chain: Cu (connecting lead)/Steel electrode/Fe oxides/citric acid solution/SCE-Cu (connecting lead) other than the one across the oxide film, are constant and small, the field
strength H of Eq. (2) is substituted by the term E/δ,
where E is the measured potential relative to the
reference half cell, and δ is thethickness of the oxide
film. The oxidation of Fe in aerated citric acid solutions leads exclusively to the increase in the thickness of theoxide film on the steel surface. At the
initial stages of oxide growth, the increase in δ
necessitates a corresponding equivalent change in potential, E, so as to keep the field strength constant. Following this reasoning, one can apply Eq. (3), derived theoretically by Abd El Kader and Shams El
Din [18], which describes the variation of the
open-circuit potential of the metal, E, with time, t, via:
E = const.+2.303δ
-/βblog t (3)
where δ
represents the rate of oxide film thickening
per unit decade of time, and β is a constant which is
identified as [35]:
β=(nF/RT)αδʹ
(4)
where α is the transfer coefficient similar to that
encountered innormal electrochemical reactions [21],
(0 < α < 1), and δʹ
is thewidth of the energy barrier
surmounted by the ion during transfer.
Assuming that the thickening of the oxide film on the steel surfaceoccurs by way of the diffusion of the
Fe2+ ions to the oxide/metalinterface, so that „„n” in
Eq. (4) amounts to 2 and α acquires a valueof 0.5 and
δʹ the value of 1 nm, the constant β acquires the value
of39 nm/V. From the slopes of the straight lines of Fig. 4(A and B),relating the variation of E with log t,
the values of the rate of oxide
thickening, δ
-, in naturally aerated 0.5 M citric acid solutions in absence and presence of increasing
concentrations of Cl- and SO4
ions have been calculated. Further inspection of the curves present in Fig. 4 (A and B) and reveals that the open-circuit potential of the steel electrode varies, in all cases, linearly with the logarithm of the immersion time, t, until reaching the final steady-state values. Three different behaviors could also be recognized
depending on the anion type and concentration. Thus,
in presence of lower concentrations ofCl-, E varies
with log t according to Eq. (1). The slope, b1, ofthe
straight line portion of the curves decreases with increasing the concentration of the aggressive anions due to a decreased rate of oxide film growth. The extent of this decrease becomes noticeable with the
increase in the concentration of the Cl- anions, Fig.
4(A). Similar behavior is found in presence of SO4
2-ions of concentrat2-ions up to 1 M, Fig. 4(B). However,
in presence of moderate concentrations of Cl- ions, E
remains more/or less independent of the immersion time until reaching the final steady potential. This behavior could be attributed, as previously noted, to a competitive process of oxide film growth by citric acid and oxide film destruction by the aggressive ions [19]. On the other hand, in the presence of higher
concentrations of both Cl- and SO42- ions, E varies
with log t according to:
E = a2+ b2log t (5)
where a2 and b2 are constants. Table 1shows the
values of the constant a2 and b2 for both Cl- and SO4
2-anions in 0.5 M citric acid solutions. The values of
the constant b2depend on both the type and the
concentration of
Table 1
The values of the constants a2, b2, A and B for Cl
and
SO42- anions in 0.5M citric acid
Constant Cl- SO4
2-a2 (mV) -646 -704
b2 (mV) -41.385 -22.178
A 0.461 0.256
B -0.263 -0.231
the aggressive anions. For one and the same anion, b2
decreases with increasing the concentration of the added ions due to a decreased rate of oxide film thickening or increased rate of oxide film destruction. However, the values of the intersection of these
parallel straight lines, a2, reflect the specific
aggressiveness of each anion towards oxide film destruction which decreases in the order: (strong)
SO42->Cl- (weak) [36]. The same trend was also
observed from the variation of the final steady-state
potentials, Est, with the concentration of the
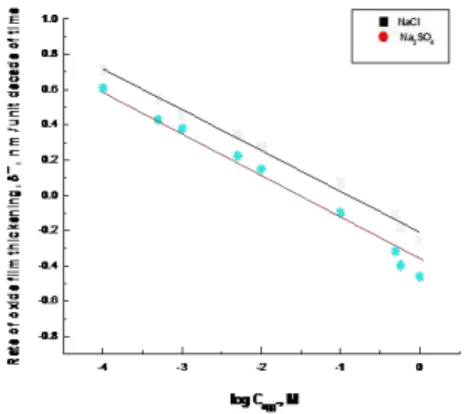
aggressive anions, Fig. 3(A and B). From the slopes of the straight lines of Fig. 4(A and B), the values of
the rate of oxide film thickening, δ
-, in presence of the aggressive ions could be determined [19]. In Fig. 5and Table 1the rate of the oxide film thickening on the steel surface in naturally aerated 0.5 M citric acid solutions are plotted, as function of the logarithm of
the molar concentration of the aggressive Cl- and
SO42-anions. Parallel straight lines are obtained
satisfying the relation:
where A and B are constants. In Table 1, the values of the constants A and B are also depicted. The constant A represents the rate of oxide film
destruction in presence of 1 M of the aggressive Cl
-and SO42- ions. From these relations, it is quite clear
that the rate of oxide film thickening is decreased while the rate of oxide film destruction is increased with increasing
the concentration of the present aggressive anions. The nearly constant value of the slope, B of the straight lines of Fig. 5 indicates that the mechanism
of oxide film destruction and dissolution by Cl- and
SO42- anions is the same.
3.2. Effect of temperature
The curves of Fig.6A, represent the variation of the open-circuit potential of the steel electrode, E, with time in naturally aerated 0.5 M citric acid + 0.1M NaClat temperatures varying between 25 and
55oC. Inspection of the curves of this figure reveals
that raising the solution temperature is accompanied by a marked effect on the value of the steady state
potential, Est. The latter varies with temperature in
according with the straight line of Fig. 7(A).
0 20 40 60 80 100 120 140 160 -650
-600 -550
Fig. 6. (A) Variation of the open circuit potential, E, of the steel electrode with time in 0.5 M citric acid + 0.1 M NaCl at different tepmeratures.
Time, min.
E
le
c
tr
o
d
e
p
o
te
n
tia
l,
E
,
m
V
(
S
C
E
)
1 288 oK
2 298 oK
3 308 oK
4 318 oK
5 328 oK
1 2 3 4 5
(A)
It is quite clear that raising the temperature decreases the initial rate of oxide film growth or enhances the corrosion of the steel and the extent of
280 290 300 310 320 330 -600
-580 -560 -540
Fig. 6. (B) Variation of the steady state potential, Est, with temp. oK, for
steel electrod in 0.5 M citric acid containing 0.1 M Cl
ions.
Est
,
m
V
(
S
C
E
)
Temp., o K
(B)
corrosion promotion increases with raising the temperature, as reflected by the shifting of the final steady potential in the negative direction. This could be attributed to the decrease of solution viscosity and the consequent increase in the mobility of ions with raising the solution temperature [26].
0.6 0.8 1.0 1.2 1.4 1.6 1.8 2.0 2.2 -660
-640 -620 -600 -580 -560 -540 -520
Fig. 7. (A) Variation of the open circuit potential, E, of the steel electrode in 0.5 M citric acid solutions + 0.1 M NaCl at different tepmerature withlogaeithm the time, t.
log time, min.
E
le
c
tr
o
d
e
p
o
te
n
tia
l,
E
,
m
V
(
S
C
E
)
1 288 o K 2 298 oK 3 308 o
K 4 318 o
K 5 328 o
K 1
2 3 4 5
(A)
The straight lines present in Fig. 7(A) relate the variation of the open-circuit potential of the steel-electrode with the logarithm of the immersion time, t, in aerated 0.5 M citric acid solutions+ 0.1M NaCl at
temperatures varying between 25 and 55oC,
respectively. The slopes of these straight lines decrease with raising the temperature. The calculated values of the initial rate of oxide film thickening on the steel electrode, at varying temperatures, are
plotted as function of 1/T (K-1) in Fig. 7 (B).From
0.0030 0.0031 0.0032 0.0033 0.0034 0.0035 -1.2 -1.3 -1.4 -1.5 -1.6 -1.7
Fig. 7. (B) Variation of the rate of oxide film thinking,, of the steel electrode in 0.5 M citric acid solutions containig 0.1 M NaCl with 1/T, K-1.
R a te o f o x id e f il m t h ic k e n in g n m p e r u n it d e c a d e o f ti m e
1/T , K-1
(B)
3.3. Effect of addition of some organic compounds on the behavior and kinetics of oxide film growth on the steel electrode
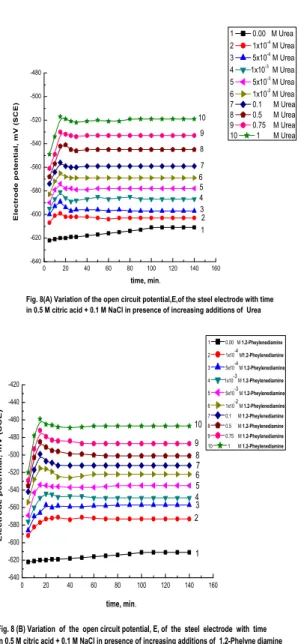
Increasing concentrations ofurea, phenylhydrazinand 1,2 phenylenediamine, are used to inhibit the pitting corrosion of the steel in naturally aerated 0.5 M citric
acid solution in presence of 0.1 M Cl- ions as pitting
corrosion agent. The open-circuit potential of the steel electrode is followed as function of time and inhibitor concentration till steady-state potentials are reached. The curves in Fig. 8 (A and B) represent such behavior in presence of urea and 1,2-phenylenediamine compounds, as examples of the other used additives. Inspection of the curves in Fig. 8 (A and B) and the likes reveals two different actions of these additives which depend on their type and concentration. Thus, in presence of low concentrations of these compounds, the steady-state
potentials, Est, are approached from negative values
and shift to the noble direction to reach values which are more positive the higher the concentration of the additives. However, after a certain time, which increases with increasing the additives concentration, the open-circuit potentials, E, shift suddenly and directly into the negative direction to reach steady-state values which are less active the higher the inhibitor concentration. This behavior could be attributed to a competitive process, involving oxide film healing and thickening by the inhibitor anions
andoxide film destruction by the aggressive Cl- ions.
In this range of the inhibitors concentrations, oxide film destruction predominateoxide film repair and thickening.Higher concentrations of theadditives, on the other hand, cause the potential E to shift directlyinto noble direction to reach steady-state values which are more positive the higher the inhibitor concentration indicating oxide film healing and thickening.The curves of Fig. 9represent the
variation of the steady-state potential, Est, of the steel
electrode, in 0.5 M citric acid + 0.1M Cl- ions, as a
function of the logarithm of the molar concentration of the added inhibitive compounds.Like s-shaped curves are obtained indicating thedomain of oxide
0 20 40 60 80 100 120 140 160 -640 -620 -600 -580 -560 -540 -520 -500 -480
Fig. 8(A) Variation of the open circuit potential,E,of the steel electrode with time in 0.5 M citric acid + 0.1 M NaCl in presence of increasing additions of Urea
time, min. E le c tr o d e p o te n ti a l, m V ( S C E )
1 0.00 M Urea
2 1x10⁻⁴
M Urea
3 5x10⁻⁴
M Urea
4 1x10⁻³
M Urea
5 5x10⁻³
M Urea
6 1x10⁻²
M Urea
7 0.1 M Urea
8 0.5 M Urea
9 0.75 M Urea
10 1 M Urea
1 2 3 4 5 6 7 8 9 10
0 20 40 60 80 100 120 140 160
-640 -620 -600 -580 -560 -540 -520 -500 -480 -460 -440 -420
Fig. 8 (B) Variation of the open circuit potential, E, of the steel electrode with time in 0.5 M citric acid + 0.1 M NaCl in presence of increasing additions of 1.2-Phelyne diamine
time, min.
E le c t r o d e p o t e n t ia l, m V ( S C E )
1 0.00 M 1.2-Pheylenediamine
2 1x10⁻⁴ M1.2-Pheylenediamine
3 5x10⁻⁴ M 1.2-Pheylenediamine
4 1x10⁻³ M 1.2-Pheylenediamine
5 5x10⁻³ M 1.2-Pheylenediamine
6 1x10⁻² M 1.2-Pheylenediamine
7 0.1 M 1.2-Pheylenediamine
8 0.5 M 1.2-Pheylenediamine
9 0.75 M 1.2-Pheylenediamine
10 1 M 1.2-Pheylenediamine
1 2 3 4 5 6 7 8 9 10
-4 -3 -2 -1 0
-600 -550 -500 -450
Fig. 9. Variation of the steady state potential, Est., of steel electrod in 0.5 M citric acid + 0.1M NaCl in presence of studied inhibitors.
log C inhibitor , M
Est , m V (S C E ) Urea phenyle hydrazine 1.2-Phenylenediamine
filmdestructionand initiation of pitting corrosion in
inconcentrations below 1x10⁻³ M. When the
concentration of these compounds reaches 1x10⁻² M,
oxide film repair and thickening predominates oxide film destruction and passivation of steel surface takes place. Referring to the S-shaped curves present in Fig. 9, it is assumed that whatever the actual inhibiting action of each of the present additive compounds, they are all first adsorbed on the active sites of the oxide film covered steel surface in
competition with Cl- ions [32, 37–40]. When their
concentration exceeds a threshold value, passivation of the surface is completed.
Fig. 10 (A and B) represents SEM micrographs for the surface of the steel electrodes attacked in solutions of 0.5M citric acid + 0.1M NaCl in presence of 1M of urea and 1,2-phenylhydrazine, respectively, as examples of the other inhibiting additives. Inspection of these micrographs shows that urea and
1,2-phenylhydrazine compounds act as good
inhibitors for pitting corrosion of steel by Cl- ions.
The number and size of the pits formed are remarkably decreased relative to that observed in inhibitor free solutions, Fig. 2(B). There are no large corroded areas as those observed in inhibitors free solutions.
(A)
(B)
Fig. 10. SEM micrographs of steel electrode surfaces
immersed for a period of 2 h in 0.5M citric acid + 0.1M NaCl in presence of (A) 1Murea and (B) 1M
1,2-phenylenediamine, respectively.
The curves in Fig. 11(A and B) represent the variation of the open-circuit potential, E, of the steel electrode with the logarithm of the immersion time, t, in naturally aerated 0.5 M citric acid solution
containing 0.1 M Cl- ions, upon the addition of
increasing concentrations of urea and
1,2-phenylenediaminecompounds, respectively.
Similarcurves are also obtained in presence of phenylhydrazin compound as pitting corrosion inhibitors (curves not shown here).
0.6 0.8 1.0 1.2 1.4 1.6 1.8 2.0 2.2 -640
-620 -600 -580 -560 -540 -520 -500 -480
Fig. 11(A) Variation of the open circuit potential, E, of the steel electrode with logarithm of immersion time in 0.5 M citric acid + 0.1 M NaCl in presence of increasing additions of Urea.
log time, min.
E
le
c
t
r
o
d
e
p
o
t
e
n
t
ia
l,
m
V
(
S
C
E
)
1 0.00 M Urea 2 1x10⁻⁴ M Urea 3 5x10⁻⁴ M Urea 4 1x10⁻³ M Urea 5 5x10⁻³
M Urea 6 1x10⁻²
M Urea 7 0.1 M Urea 8 0.5 M Urea 9 0.75 M Urea 10 1 M Urea
1 2 3 4 5 6 7 8 9 10
(A)
0.6 0.8 1.0 1.2 1.4 1.6 1.8 2.0 2.2
-640 -620 -600 -580 -560 -540 -520 -500 -480 -460 -440 -420
Fig. 11(B) Variation of the open circuit potential,E,of the steel electrode with logarithm of immersion time in 0.5 M citric acid + 0.1 M NaCl in presence of increasing additions of 1.2-Phelynediamine.
log time, min.
E
le
c
tr
o
d
e
p
o
te
n
ti
a
l,
m
V
(
S
C
E
)
1 0.00 M 1.2-Phelynediamine
2 1x10⁻⁴ M
1.2-Phelynediamine
3 5x10⁻⁴
M 1.2-Phelynediamine
4 1x10⁻³
M 1.2-Phelynediamine
5 5x10⁻³
M 1.2-Phelynediamine
6 1x10⁻²
M 1.2-Phelynediamine
7 0.1 M 1.2-Phelynediamine
8 0.5 M 1.2-Phelynediamine
9 0.75 M 1.2-Phelynediamine
10 1 M 1.2-Phelynediamine
1 2 3 4 5 6 7 8 9 10
(B)
Inspection of the curves present in Fig. 11(A and B) and the like reveals that, in all solution concentrations studied, E varies with log t until reaching the steady-state potentials according to the relation:
E =a3+ b3log t (7)
where a3 and b3 are constants. Following the
behaviors could be recognized. Thus, in presence of low concentrations of the additive anions, the open-circuit potentials drop into the negative direction to reach new steady-state values which become less active the higher the concentration of the present inhibitors. When the concentration of the additives
reaches 1x10²- M or more, the potentials move into
the positive direction to reach steady-state values which are also more noble the higher the additives
concentration. The slope b3 of the straight line
portion of the E–log t curves is slightly increased
with increasing the inhibitor concentration indicating oxide film growth rather thanfilm destruction.
-4 -3 -2 -1 0
0.5 1.0 1.5 2.0 2.5
Urea phenylehydrazin 1,2-phenylenediamine
Fig. 12. Variation in the rate of oxide film thinking,, of the steel electrode in 0.5 M citric acid + 0.1M NaCl with the logarithm of the inhibitorsconcentrations.
log C
inhibitor ,M
R
a
t
e
o
f
o
x
id
e
f
il
m
t
h
in
k
in
g
,
n
m
p
e
r
u
n
it
d
e
c
a
d
e
o
f
t
im
e
From the slopes of the E –log t curves in Fig . 11(A
and B) and thelike, the rate of oxide film thickening ,
δ ̅, is calculated. In Fig. 12,the variation of the rate of
oxide film thickening with the logarithmof the molar concentration of the added inhibitors is depicted. As can be seen, the rate of the oxide film thickening changes linearly with the logarithm of the molar
concentration of the inhibitors, Cinh, according to:
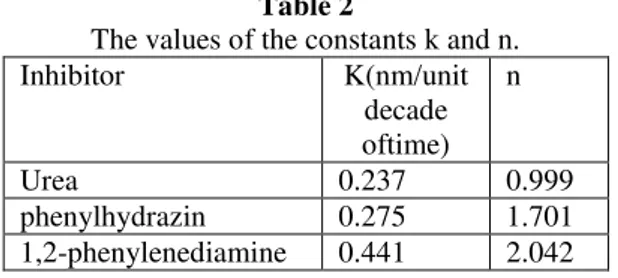
Rate of oxide film thickening = k +nlogCinh (8)
where k and n are constants given in Table 2. The constant k represents the rate of oxide film thickening (nm/unit decade of time) in presence of 1 M inhibitors. The slope n increases with increasing the concentration of organic additives. From the values of the constants k and n of Eq. (8), Table 2, the efficiency of the studied compounds as corrosion inhibitors of steel decreases in the order: (strong)
1,2phenylenediamine>phenylhydrazine> urea
(weak).
Table 2
The values of the constants k and n.
Inhibitor K(nm/unit
decade oftime)
n
Urea 0.237 0.999
phenylhydrazin 0.275 1.701
1,2-phenylenediamine 0.441 2.042
IV.
Summary and conclusions
From measurements of the open-circuit potential of the steel electrode in naturally aerated citric acid solutions devoid of- and containing increasing
concentration of Cl- and SO4
as aggressive agents and 1,2-phenylenediamine, phenylhydrazin and urea as inhibitors, the following conclusions could be drawn:
(i) The rate of oxide film thickening in citric acid
solutions devoidof- and containing Cl- and SO42- ions
follows a direct logarithmic law as evident from the linear relationships between the open-circuit potential and the logarithm of immersion time.
(ii) Threshold concentrations of both Cl- and SO4
2-anions decrease the rate of oxide film thickening and finally cause the destruction of passivity and initiation of visible pits.
(iii) urea, phenylhydrazin and 1,2-phenylenediamine,
compoundsinhibit the pitting corrosion of steel by Cl
-ions. The rate of oxide film healing and thickening in presence of these compounds increases with their concentrations and varies linearly with the logarithm of the inhibitor concentrations. The efficiency of these anions as pitting corrosion inhibitors decreases
in the order: (strong) 1,2-phenylenediamine
>phenylhydrazin> urea (weak).
References
[1.] Gardner G.I, Nathan C. C. Ed, (2000),
“Corrosion inhibitors”, NACE, p.156.
[2.] Abd El Rehim S.S, Ibrahim M.A.M and
Khalid K.F,(2001), The Inhibition of 4 – (2`-
amino-5‟ Methylphenylazo) anti pyrine on
corrosion of mild steel in HCl solution. Material Chemistry and Physics, 70, p.268.
[3.] Ogunleye I. O., Adeyemi G. J and Oyegoke
A.O.V. Effect of grape fruit juice on the corrosion behaviour of mild steel in acidic
medium ., Am. J. Sci. Res., 2011, 2(4):
611-615.
[4.] Reinhard G and Rammet U 1985 in
Proceedings 6th European symposium on
corrosion inhibitors (Ferrara: Ann.
University)p. 831.
[5.] Abd El-Rehim S S, Ibrahim M A M and
Khaled K F 1999 J. Appl. Electrochem. 29
[6.] Quraishi M A and Jamal D 2002 J. Appl.
Electrochem. 32 425
[7.] EmregulKaan C, KurtaranRaif and
AtakolOrhan 2003 Corros. Sci. 45 2803.
[8.] Khaled F, Babic-Samardzija K and
Hackerman N 2004 J. Appl. Electrochem.
34 697.
[9.] Wang Hui-Long, Liu Rui-Bin and XinJian
2004 Corros. Sci.46 2455.
[10.] Bentiss F, Lebrini M and Lagrenee M 2005
Corros. Sci. 47 2915.
[11.] ZorSibel, Dogan Pinar and YaziciBirgul
2005 Corros. Rev. 23217
[12.] Quraishi M A, Jamal D and Singh R N 2002
Corrosion 58 201.
[13.] Popova A, Christov M, Raicheva S and
Sokolova E 2004 Corros. Sci. 46 1333.
[14.] Vishwanatham S and Anil Kumar 2005
Corros. Rev. 23 181.
[15.] Mora-Mendoza J L, Chacon-Nava J G,
Zavala-Olivares G, Gonzalez-Nunez M A
and TurgooseS, 2002 Corros. Eng. 58 608.
[16.] S.M. Abd Haleem, A. Diab, AzaaAbd
El-Megeed and M. Elgharabawy., IJMTER, 2
(8)(2015) 188.
[17.] S.M. Abd El Haleam, E.E. Abd El Aal, S.
Abd El Wanees, A. Diab, in: Taiba International Chemistry Conference, Al
Madinah, Saudi Arabia, March 23–25,2009,
p. 272.
[18.] J.M. Abd El Kader, A.M. Shams El Din,
Film thickening on nickel in aqueous solutions in relation to anions type and
concentration, British Corrosion Journal 14
(1979) 40–45.
[19.] E.E. Abd El Aal, S.M. Abd El Haleem,
Kinetics of oxide film growth and
destruction on iron surface in carbonate solutions, Corrosion Engineering Science
and Technology 43 (2008) 219–224.
[20.] C.M.A. Brett, I.A.R. Gomes, J.P.S. Martins,
The electrochemical behaviour and
corrosion of aluminium in chloride media, the effect of inhibitor anions, Corrosion
Science 36 (1994) 915–923.
[21.] H.A. El Shayeb, F.M. Abd El Wahab, E.A.
El Meguid, Electrochemical behavior of molybdenum electrodes in various aqueous and buffered solutions and their use in
titration, British Corrosion Journal 36 (2001)
215–220.
[22.] E.E. Abd El Aal, Oxide film formation on
zinc in borate solutions under open circuit,
Corrosion Science 50 (2008) 41–46.
[23.] G.T. Burstein, R.J. Cinderey, Evolution of
the corrosion potential of
epassivatingaluminium surfaces, Corrosion
Science 33 (1992) 475–492.
[24.] G.T. Burstein, R.M. Organ, Repassivation
and pitting of freshly generated aluminium surfaces in acidic nitrate solution, Corrosion
Science 47(2005)2932–2955.
[25.] F.P. Fehlner, N.F. Mott, Cabrera–Mott
mechanism for oxidation of metals,
Oxidation of Metals 2 (1) (1970) 59–99.
[26.] D.J. Young, M.J. Dignam, „„Logarithmic”
kinetics in thin film tarnishing, Oxidation of
Metals 5 (5) (1972) 241–249.
[27.] K. Shimizu, K. Kobayashi, G.E. Thompson,
G.C. Wood, Contribution to the paper on evolution of the corrosion potential of repassivatingaluminium surfaces by G.T. Burstein and R.J. Cinderey, Corrosion
Science 34 (1993) 701–704.
[28.] N. Cabrera, N.F. Mott, Theory of the
oxidation of metals, Reports on Progress in
Physics 12 (1948) 163–184.
[29.] H.H. Uhlig, Corrosion and Corrosion
Control, J.W. & Sons Inc., N.Y., London, 1971. 189.
[30.] E.J.W. Verwey, Electrolytic conduction of a
solid insulator at high fields the formation of the anodic oxide film on aluminium,
Physica2 (1935) 1059–1063.
[31.] A. Guntherschulze, H. Betz, Die
Bewegungderionengitter von
isolatorenbeiextremenelektrischenFeldstärke
n, ZeitschriftfürPhysik92 (1934) 367–374.
[32.] G.T. Burstein, A.J. Davenport, The current–
time relationship during anodic oxide film growth under high electric field, Journal of
the Electrochemical Society 136 (1989)
936–941.
[33.] C.Y. Chao, F. Liu, D.D. Macdonald, Point
defect model for anodic passive films,
Journal of the Electrochemical Society 128
(1981) 1187–1194.
[34.] N. Sato, M. Cohen, The Kinetics of anodic
oxidation of iron in neutral solution, Journal
of the Electrochemical Society 111 (1964)
519–536.
[35.] K.J. Vetter, in: H. Fisher, K. Hanfe, W.
Wederholt (Eds.), PssivierendeFilme und Deckschichten, Springer Verlag, Berlin, 1956, p. 72.
[36.] J.M. Abd El Kader, A.A. El Warraky, A.M.
Abd El Aziz, Corrosion inhibition of mild steel by sodium tungstate in neutral solution. Part 1: Behaviour in distilled water, British
Corrosion Journal 33 (1998) 139–144.
[37.] A.M. Shams El Din, S.M. Abd El Haleem,
Variation of the potential of the zinc electrode in relation to the concentration of
the aggressive anions,
[38.] S.M. Abd El Haleem, Initiation and inhibition of pitting corrosion in alkali solutions under
potentiostatic polarization conditions, Werkstoffe u. Korrosion30 (1979) 631–637.
[39.] M.A. Deyab, S.S. Abd El Rehim, Inhibitory effect of tungstate, molybdate and nitrite ions on the
carbon steel pitting corrosion in alkaline formation water containing Cl- ion, ElectrochimicaActa53
(2007) 1754–1760.
[40.] Z.F. Foroulis, M.J. Thubrikar, Contribution to the study of the critical pitting potential of oxide