ACPD
9, 3265–3306, 2009Pollution in the regional mixed layer
of central Mexico
D. Baumgardner et al.
Title Page
Abstract Introduction
Conclusions References
Tables Figures
◭ ◮
◭ ◮
Back Close
Full Screen / Esc
Printer-friendly Version
Interactive Discussion
Atmos. Chem. Phys. Discuss., 9, 3265–3306, 2009 www.atmos-chem-phys-discuss.net/9/3265/2009/ © Author(s) 2009. This work is distributed under the Creative Commons Attribution 3.0 License.
Atmospheric Chemistry and Physics Discussions
This discussion paper is/has been under review for the journalAtmospheric Chemistry and Physics (ACP). Please refer to the corresponding final paper inACPif available.
Evolution of anthropogenic pollution at
the top of the regional mixed layer in the
central Mexico plateau
D. Baumgardner1, M. Grutter1, J. Allan2, C. Ochoa1, B. Rappenglueck3, L. M. Russell4, and P. Arnott5
1
Centro de Ciencias de la Atm ´osfera, Universidad Nacional Aut ´onoma de M ´exico, Mexico City, Mexico
2
School of Earth, Atmospheric & Environmental Science, University of Manchester, Manchester, UK
3
Earth and Atmospheric Sciences Dept., University of Houston, Houston, TX, USA
4
Scripps Institution of Oceanography, University of California San Diego, La Jolla, CA, USA
5
Dept. of Physics, University of Nevada, Reno, NV, USA
Received: 3 December 2008 – Accepted: 15 December 2008 – Published: 30 January 2009 Correspondence to: D. Baumgardner ([email protected])
ACPD
9, 3265–3306, 2009Pollution in the regional mixed layer
of central Mexico
D. Baumgardner et al.
Title Page
Abstract Introduction
Conclusions References
Tables Figures
◭ ◮
◭ ◮
Back Close
Full Screen / Esc
Printer-friendly Version
Interactive Discussion
Abstract
The concentrations of gases and properties of aerosol particles have been measured at the mountain site of Altzomoni approximately equidistant from Mexico City, Puebla and Cuernavaca, at an altitude of 4010 m. At this location there is a diurnal transition from local to regional mixed layer air whose properties depend on prevailing winds and larger 5
scale circulation. Three days during March 2006 have been evaluated during which time the synoptic scale air flow was from the east, southeast and southwest. In general the properties of gases and particles were similar when the regional mixed layer (RML) was below the research site, regardless of the direction of flow. When the RML reached the site, the highest concentrations of CO, O3and aerosol particles were from the east, 10
decreasing as the flow shifted to the southeast then to the southwest. The maximum concentration of condensation nuclei (CN) was greater than 25×10−3when winds were
from the east. The highest mass concentrations of organic matter (OM), sulfate (SO4−), and Nitrate (NO3+) were 80, 4 and 8µg m−3, at standard temperature and pressure in air from the east. The mass concentration of OM in the RML was greater than 70% of 15
the total mass, regardless of the air mass origin. This compares to less than the 60% that has been reported for Mexico City.
At night, the mass fraction of sulfate went up by a factor of ten from the daytime value when air arrived from the east. The relationship between the CO and OM suggests that the majority of the daytime OM is from biomass burning and at night it is from wood 20
burning.
Whereas the maximum CO at Altzomoni, 0.35 ppm, was approximately one tenth of the CO measured at the same time in the center of Mexico City, the maximum O3 of 120 ppb was approximately the same as in the city. The maximum nighttime values of O3was 60 ppb, indicating the presence of residual pollution.
25
ACPD
9, 3265–3306, 2009Pollution in the regional mixed layer
of central Mexico
D. Baumgardner et al.
Title Page
Abstract Introduction
Conclusions References
Tables Figures
◭ ◮
◭ ◮
Back Close
Full Screen / Esc
Printer-friendly Version
Interactive Discussion
that are dispersed throughout the region. This mixture rapidly erases the signature of a unique Mexico City “plume” and suggests that the environmental impact of this region should be considered as one that stems from a large area source rather than a single megacity.
1 Background
5
Many papers have addressed the issues of the regional and global impact of anthro-pogenic emissions from Mexico City, a large urban area classified as a megacity due to its population of greater than 18 million people. Since the early 1990s there have been several major field programs that focused on characterizing the pollution pro-duced by this city and evaluating its impact on health and climate. The first of these 10
programs, Project Aguila, was the only one to study the vertical structure of pollution in Mexico City prior to 2006. This program deployed the NSF/NCAR King Air for two weeks in February of 1991 (Nickerson et al., 1992, 1993; Perez and Raga, 1998) and, in addition to revealing the large variation in gas and particle concentrations over diff er-ent parts of the city, it was the first time that the vertical profiles of particles and gases 15
were directly measured. As shown in Fig. 1, there were elevated layers of ozone (O3) and condensation nuclei (CN) that were detected in the morning sounding at 11:00 LST during this flight on 13 February 1991. These were daily features that were verified on other days. The maximum in O3 at the top of the mixed layer was subsequently sim-ulated by Raga and Raga (2000) who showed that it was the light absorbing layer of 20
aerosols at the top of the mixed layer that led to a decrease in actinic flux and hence a higher photochemical production rate of ozone at the top than at the bottom of the layer. Elevated layers of aerosols also lead to local heating that further stabilizes the mixed layer (Raga et al., 2000), increasing the concentration of aerosols that further enhance photochemical reactions (Dickerson et al., 1997).
25
ACPD
9, 3265–3306, 2009Pollution in the regional mixed layer
of central Mexico
D. Baumgardner et al.
Title Page
Abstract Introduction
Conclusions References
Tables Figures
◭ ◮
◭ ◮
Back Close
Full Screen / Esc
Printer-friendly Version
Interactive Discussion
rise with the growth of the mixed layer can reach elevations as high as the mountain passes, whose altitudes are marked on this figure.
In 1997 another major field campaign, the Investigacion sobre Materia Particulada y Deterioro Atmosferico – Aerosol and Visibility Research (IMADA-AVER) was con-ducted in February and March (Edgerton et al., 1999). During that project measure-5
ments were made with wind profilers that provided further evidence that the Mexico City mixed layer grows as much as 3000 m above the basin of the city (Whiteman, 2000).
The vertical structure of the atmosphere measured by aircraft and wind profilers suggests that the city’s pollution will rise to levels where prevailing winds then transport it regionally. Indeed, various modeling studies that followed the 1997 field program 10
simulated the transport of particles out of the Mexico City basin (Fast et al., 1998; Whiteman et al., 2000); however, until recently there have been no measurements that could quantify the magnitude of anthropogenic pollution that was transported through any of the mountain passes around the city.
In late 2005 a research site was established on the Altzomoni ridge that is located in 15
the Pass of Cortez between the volcanoes of Popocatepetl and Iztacc´ıhuatl that rise to the southeast of Mexico City. This site was selected because of its altitude of 4010 m and its location in one of the mountain passes where the previous modeling studies (Fast et al., 1998; Whiteman et al., 2000) indicated that air masses from Mexico City would eventually arrive by midday. Preliminary measurements of carbon monoxide 20
(CO), O3 and other gases had also been made near this location in late April and early May of 1999 using a van provided by the Mexico City government (Jimenez, 2004). Figure 2 is an example of CO and O3 measured during three days in that period compared to measurements made on the same days at Merced, a site in the center of the city, also operated by the city government as part of its Red Autom ´atica 25
ACPD
9, 3265–3306, 2009Pollution in the regional mixed layer
of central Mexico
D. Baumgardner et al.
Title Page
Abstract Introduction
Conclusions References
Tables Figures
◭ ◮
◭ ◮
Back Close
Full Screen / Esc
Printer-friendly Version
Interactive Discussion
were sampled during an intensive operation period (IOP) in March 2006.
2 Instrumentation
The suite of instruments that was operated during the IOP consisted of sensors for es-tablishing the meteorological state of the atmosphere, the concentration of the principal trace gases and analyzers for determining the physical, optical and chemical proper-5
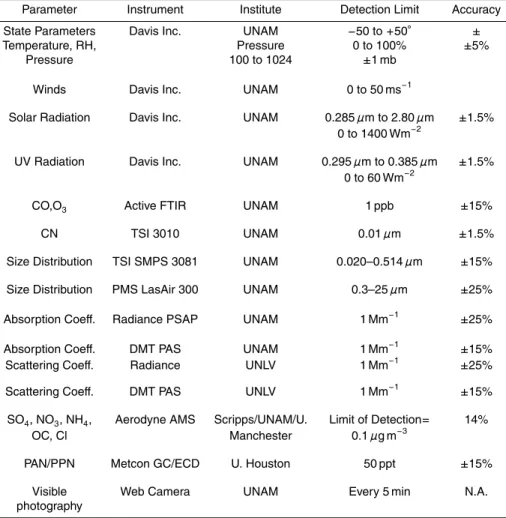
ties of aerosol particles. The complete list of instrumentation is listed in Table 1 along with the associated parameter that was measured, the responsible institute and their sensitivity and accuracy.
The state parameters, winds and the solar and UV radiation were recorded once per minute from the weather station1 that was located at an altitude of two meters 10
AGL. Measurements of CO and O3 were made with an active Fourier Transform In-frared (FTIR) spectrometer, operated with a path length of 350 m. The spectra from this remote sensing system, acquired at a rate of 1 Hz and 0.5 cm−1 resolution, were averaged to a sample interval of every five minutes. The concentration of Peroxiacetil-nitratos (PANs) were made with a dual column gas chromatograph2 equipped with an 15
electron capture detector.
The concentration of particles larger than approximately 10 nm was measured with a TSI3model 3010 that was part of the TSI scanning mobility particle sizer (SMPS) that also provided size distributions from 20 to 514 nm. The upper threshold was limited due to the restriction on high voltage when operating at elevated altitudes where corona 20
discharge occurs if a voltage of 5000 V is exceeded. Size distributions for particles larger than 300 nm were measured with the LasAir Model 3104 that optically sized
1
Davis Instruments
2
Metcon Inc., K ¨onigstein, Germany
3
Thermal Systems Incorporated, St. Paul, MN
4
ACPD
9, 3265–3306, 2009Pollution in the regional mixed layer
of central Mexico
D. Baumgardner et al.
Title Page
Abstract Introduction
Conclusions References
Tables Figures
◭ ◮
◭ ◮
Back Close
Full Screen / Esc
Printer-friendly Version
Interactive Discussion
particles from 0.3 to 25µm.
The absorption and scattering coefficients were measured with two systems, a Par-ticle Soot Absorption Photometer (PSAP)5and a Nephelometer5, both operating at a wavelength of 550 nm and a Photoacoustic Soot Spectrometer (PASS)6 that used a laser with a wavelength of 850 nm. The chemical properties were measured with an 5
Aerodyne Aerosol Mass Spectrometer7(Canagaratna et al., 2007). Particle data were acquired with several different data systems before merging after time synchronization and averaging to a common time base of a sample every fifteen minutes for the analysis presented in this study.
Sub-micron filter samples were taken every 12 h and Fourier Transform Infrared 10
Spectroscopy (FTIR) was used to quantify particulate organic functional groups, in-cluding saturated aliphatic (alkane), unsaturated aliphatic (alkene), aromatic, alcohol, carbonyl, amines, and organosulfate compounds (Maria et al., 2002, 2003; Gilardoni et al., 2007).
All of the instruments were housed in a lightly insulated utility shed with no environ-15
mental controls of temperature or humidity. All the particle instruments, with the ex-ception of the LasAir, sampled aerosols from a PM1.0cyclone separator8. The sample line from the cyclone to the nephelometer, PSAP and CN counter was heated to ap-proximately 40◦C to maintain the particles at low humidity. The purpose of the cyclone was to minimize truncation errors in the measurement of the scattering coefficient with 20
the nephelometer and the aerosols were dried to prevent humidity enhancement of the absorption coefficient measured by the filter-based PSAP. The LasAir was operated in front of the cyclone in order to sample the coarse mode particles. The nephelometer was calibrated in accordance with the recommendations of the manufacturer, correc-tions were applied to the measurements of the PSAP to account for scattering effects 25
5
Radiance Research, Seattle, Wa
6
Droplet Measurement Technologies, Boulder, CO
7
Aerodyne Inc., Billerica, Ma
8
ACPD
9, 3265–3306, 2009Pollution in the regional mixed layer
of central Mexico
D. Baumgardner et al.
Title Page
Abstract Introduction
Conclusions References
Tables Figures
◭ ◮
◭ ◮
Back Close
Full Screen / Esc
Printer-friendly Version
Interactive Discussion
(Bond et al., 1999) and the aerosol mass spectrometer was calibrated twice during the project while installed at the research site.
3 Results
3.1 Measurement site
As shown in Fig. 3, Altzomoni (19.117◦N, 98.654◦W, 4010 m a.s.l.) is located approx-5
imately equidistance southeast of the center of Mexico City, northeast of Cuernavaca and east of Puebla. During the month of March, a number of different large scale circulation patterns evolved (Fast et al., 2007) during which time the air that arrived at Altzomoni came from nearly all quadrants. Three days have been selected for the current evaluation based upon the analysis of back trajectories produced by the NOAA 10
HYSPLIT program and using the final analysis (FNL) of the Global Forecasting System for the 650 mb level (the average pressure at Altzomoni was 630±5 mb). The days
selected were 16, 18 and 19 March, during which times the air mass trajectories were from the east, southeast and southwest, respectively, during daytime and night time. These days were selected as those with no influence from local biomass burning or 15
heavy clouds and precipitation. The yellow lines in Fig. 3 show the 24 h trajectories for the three days where the end times of the trajectories was 14:00 (all times will hereafter be reported in local standard time). It should be noted that the 500 mb winds for these days (Fast et al., 2007) were from south (16 March) and southwest (18 and 19 March). The measurement site was situated at the highest point on the ridge with an un-20
obstructed view in all directions (Fig. 4). As seen in Fig. 5, the terrain slopes toward the west more abruptly than the east, a feature that will be discussed in greater de-tail in Sect. 4.0 as it relates to the differences between air masses of different origins. In addition to its strategic location with respect to nearby urban areas, there are no significant local sources of contaminants since it is situated in the national park of 25
ACPD
9, 3265–3306, 2009Pollution in the regional mixed layer
of central Mexico
D. Baumgardner et al.
Title Page
Abstract Introduction
Conclusions References
Tables Figures
◭ ◮
◭ ◮
Back Close
Full Screen / Esc
Printer-friendly Version
Interactive Discussion
weekend tourists to the park center that is approximately five km to the southeast of the research site. The days selected for the current study were those where the RML was clearly observed to grow to above the measurement site, as illustrated in Fig. 6, and whose daily trends in gas and particle concentrations exhibited a sharp gradient, as will be shown in the analysis below. The photos shown in Fig. 6 were taken with 5
a web camera looking westwards whose images were recorded every five min during daylight hours throughout the project.
In the following analysis, the measurements are grouped according to the direction of the 24 h trajectories and the results are shown as diurnal averages for the three cases, where each data point is a fifteen minute average. Hence, in each of the figures 10
with time series, the blue, black and red curves are for the days when air was arriving from the east, southeast and southwest, respectively.
3.2 Meteorology
The general meteorological conditions for the March 2006 period have been discussed in detail by Fast et al. (2007), the month when the Megacities Initiative: Local And 15
Global Research Observations (MILAGRO) international field campaign (Molina et al., 2008) was being conducted. Figure 7 shows the daily averages of temperature, relative humidity (RH), and the local wind speed and direction for the three cases. The air masses from the east are generally a couple of degrees warmer in the morning hours (Fig. 7a). The temperature in the southwesterly flow eventually increases until it is the 20
same as in the easterly flow by 08:00 LST. Note that there is no meteorological data on days with air from the southwest between 10:00 and 17:00 due to a problem with downloading data during that time period.
In the early morning hours the relative humidity (RH) of air from the southwest (Fig. 7b) was five time as high as easterly and southeasterly air, but all of the cases 25
ACPD
9, 3265–3306, 2009Pollution in the regional mixed layer
of central Mexico
D. Baumgardner et al.
Title Page
Abstract Introduction
Conclusions References
Tables Figures
◭ ◮
◭ ◮
Back Close
Full Screen / Esc
Printer-friendly Version
Interactive Discussion
the easterly flow remained low until 18:00 when the winds fell to almost zero and the RH increased to a constant value of 50% throughout the remainder of the evening.
The wind velocities varied widely throughout the day (Fig. 7c). The southwesterly flow had the weakest winds that varied between 2–4 ms−1. The winds from the eastern sector were much stronger, varying between 2–14 ms−1
. The winds in the easterly and 5
southeasterly flows remained strong from midnight until 13:00 when they decreased to their minimum values between 18:00 and 20:00.
As shown in Fig. 7d, although the larger scale flow comes from the east, southeast and southwest, the local winds remains nearly constant at 135◦ in the easterly and southeasterly flow and between 180◦ and 225◦ in the southwesterly flow. After 14:00, 10
when the wind velocity was nearly zero, the wind directions have no meaning.
3.3 Gas concentrations
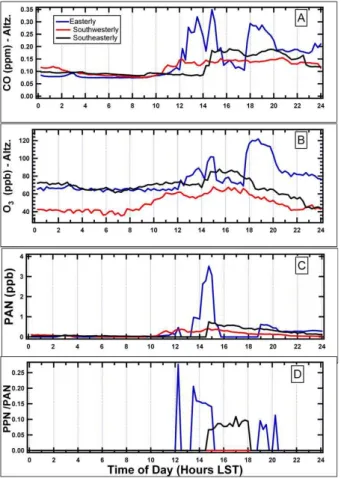
The daily averages of CO, O3 and Peroxyacetyl nitrate (PAN) are shown in Fig. 8a– c, along with the ratio of peroxypropionyl nitrate (PPN) to PAN (Fig. 8d). The CO at Altzomoni remains at its minimum of 0.10 ppm, regardless of air mass origin, from mid-15
night to 10:00. The CO in the air mass from the east and southwest begins to increase at that time. In the southwest air mass the CO gradually increases throughout the af-ternoon and evening, reaching its maximum concentration of 0.15 ppm at 18:00. The concentration of CO in the easterly air flow increases rapidly before reaching the first maximum of 0.30 ppm at 13:30 and another maximum of 0.35 ppm at 15:00. It then de-20
creases to a minimum of 0.10 ppm at 17:30 before abruptly increasing to a concentra-tion of 0.28 ppm at 18:00 after which time it decreases to a constant value of 0.20 ppm at 20:00 and remains there throughout the evening. The increase in concentration at 18:00 is associated with the period of very low wind velocity. The southeasterly flow maintains the minimum value of 0.10 ppm until 14:00 at which time it reaches its max-25
imum value of 0.20 ppm in a one hour period and remain at this concentration until 20:00 when it begins.
ACPD
9, 3265–3306, 2009Pollution in the regional mixed layer
of central Mexico
D. Baumgardner et al.
Title Page
Abstract Introduction
Conclusions References
Tables Figures
◭ ◮
◭ ◮
Back Close
Full Screen / Esc
Printer-friendly Version
Interactive Discussion
same times for peaks. The maximum in the O3concentration from the east is 120 ppb and 80 ppb in air from the southeast. The O3from the southwest has a different trend than the CO, increasing from a minimum of 40 ppb at 08:00, reaching a maximum of 70 ppb at 15:00 before decreasing back to a minimum value at 22:00. The night time concentrations of O3 in the easterly and southeasterly flow are between 60 and 5
80 ppb, compared to night time, minimum values of 20 ppb measured in Mexico City at the same time at the Merced air quality monitoring station operated as part of the RAMA network.
The PAN (Fig. 8c) is below the detection limit until 11:00, regardless of the direction of flow. In the southwest flow the PAN concentration, although less than 1.0 ppb, has 10
the same trend as CO during that period. The PAN in the flow from the east doesn’t exceed the detection level until 13:30 at which time it increases to a maximum near 4.0 ppb before decreasing again below detection levels at 16:00. It does not reflect the first maximum at 13:30 that was seen in the CO for this day. The PAN from the southeast has a trend similar to the CO and reaches its maximum of 0.5 ppb at 15:00. 15
Given that PPN is primarily a result of fresh, anthropogenic emissions (Gaffney, 1998) the ratio of PPN to PAN (Fig. 8d) shows that only the PAN in the flow from the eastern sector has anthropogenic influence.
3.4 Particle properties
The daily trends in the particle number and mass concentrations are plotted in Fig. 9, 20
normalized to standard temperature and pressure (273.16◦C, 1023.25 mb) to facilitate easier comparison with measurements made at other altitudes and locations during MILAGRO. The number and mass concentrations generally follow the trends in CO, regardless of the air flow direction, showing the same times for maxima in number and mass. The maximum in CN of greater than 25×10−3 in the airflow from the east is
25
almost twice the maxima from the southeast and southwest, both of about 15×10−3. It
ACPD
9, 3265–3306, 2009Pollution in the regional mixed layer
of central Mexico
D. Baumgardner et al.
Title Page
Abstract Introduction
Conclusions References
Tables Figures
◭ ◮
◭ ◮
Back Close
Full Screen / Esc
Printer-friendly Version
Interactive Discussion
Compared to the CN measurements that are dominated by the particles less than 0.1µm, the measurements from the LASAir optical particle counter (OPC) are of par-ticles>0.3µm, which include part of the accumulation mode and most of the coarse mode particles. The OPC concentrations (Fig. 9b) mirror those of CN and are quite high, exceeding 1000 cm−3 in the easterly flow. The behavior of particles larger than 5
0.3µm is magnified when the number concentrations are converted to mass concentra-tions. The mass concentrations in particles less than 1.0µm and 10µm, also known as PM1.0and PM10, were derived from the size distributions of the number concentrations measured with the OPC. These number distributions were converted to volume distri-butions assuming spherical particles, then multiplied by an average particle density of 10
1.9 g cm−3
estimated from the relative mass fraction of ions measured by the AMS and from black carbon (BC) derived from the PSAP, following the equation of DeCarlo et al. (2004). The trends in PM1.0 and PM10 are shown in Fig. 9c and d. As expected, the mass concentrations follow a similar pattern to the OPC number concentration with the exception of the PM10in the flow from the east that has a very large peak at 11:30. 15
Given that this peak is not reflected in the CN or PM1.0 these large mass concentra-tions are likely a result of dust from a local source. The area immediately east of the research site is largely devoid of trees and consists of small scrub brush and dry soil; hence, the particles larger than a few micrometers are probably locally generated dust. The ion mass concentrations and effective black carbon (EBC), also normalized to 20
standard temperature and pressure, are displayed in Fig. 10. The EBC is not a true measure of the BC because it is derived from the absorption coefficient measured with the PSAP by using a specific absorption coefficient, ωa, of 10 m2g−1 to convert to BC mass. As discussed in detail by Bond and Bergstrom (2006),ωa can vary widely depending on the properties of the BC. The value used in the present study is taken 25
from the literature as being the most common, but with the caveat that the numbers presented here have at least an uncertainty of±50%. A second caveat is that during
ACPD
9, 3265–3306, 2009Pollution in the regional mixed layer
of central Mexico
D. Baumgardner et al.
Title Page
Abstract Introduction
Conclusions References
Tables Figures
◭ ◮
◭ ◮
Back Close
Full Screen / Esc
Printer-friendly Version
Interactive Discussion
The mass concentration of organic matter (OM), shown in Fig. 10a, is the largest in air coming from the east. The maximum OM concentration is almost 80µg m−3 compared to 20µg m3 from the southeast and 10µg m−3 in air from the southwest. The OM in the easterly flow has multiple peaks during the day, similar to those seen in the CN but not always at the same time. The concentration increase in OM starts 5
earlier from the southwest then reaches a constant value at 11:00, never changing throughout the remainder of the day and evening. The OM in the southeasterly flow increases later than in the easterly flow then decreases very slowly throughout the day, reaching the minimum value by midnight.
The sulfate ion mass concentration, SO4−, seen in Fig. 10b, has distinctly different 10
patterns depending on the origin of the air mass. In the easterly flow, sulfate does not start increasing until after 13:00, unlike the OM that abruptly increased at 12:00. After reaching a peak value of 3.0µg m−3, its follows a trend similar to the CO where the concentration decreases until 17:30 before rapidly increasing to an even higher maximum of 3.9µg m−3 at 18:00. In the southwest flow, the sulfate is much lower in 15
concentration and also tracks the changes in CO. The maximum value is 2.0µg m−3. The sulfate in the southeasterly flow varies between 1.0 and 2.5µg m−3
during the morning hours from midnight until 08:00 when it decreases to a minimum at midday before increasing once again to a concentration of 2.5µg m−3 where it remained until 23:30.
20
As shown in Fig. 10c and d, the ion mass concentrations of nitrate, NO3+, and ammo-nium, NH4−, have nearly identical trends that match those of the SO4− concentrations in the flows from all directions.
The EBC (Fig. 10e) shows trends in the easterly and southeasterly flows similar to the nitrate but the EBC in the southwesterly flow is not correlated with any of the other 25
gas or particle concentrations. The maximum concentration of EBC is from the east with a value of over 1000 ng m−3, twice the concentration in the southeasterly flow and three times that of the EBC in the air from the southwest.
ACPD
9, 3265–3306, 2009Pollution in the regional mixed layer
of central Mexico
D. Baumgardner et al.
Title Page
Abstract Introduction
Conclusions References
Tables Figures
◭ ◮
◭ ◮
Back Close
Full Screen / Esc
Printer-friendly Version
Interactive Discussion
daytime when the site was in the RML, 11:00–18:00, and then above the RML at night and early morning, 18:00–11:00 (following day), for the days when winds were from the east and southwest. The daytime proportion of the alcohol and alkane groups, 53% and 17%, respectively, were the same regardless of flow direction. The amines were higher from the east, 26% vs. 15% and carboxylic acids were a larger percentage 5
from the southwest, 14% vs. 5%. The principal difference in the organic composition between the easterly and southwesterly air masses is in the alcohol and alkane groups at night. The alcohol group dominates the organics making up 69% in the easterly flow while alkanes make up 45% of the organics in the southwesterly flow. Carboxylic acids in the southwesterly flow make up another 30% of the organics compared to only 7% 10
in the easterly flow.
The daily trends in the absorption, scattering and extinction coefficients and the sin-gle scattering albedo are displayed in Fig. 14a–d. The absorption coefficient, Babs, matches the pattern in EBC, previously described, since the EBC was derived directly fromBabs. The scattering coefficient,Bsct, reflects the trends in the OM for all air flow 15
directions.
4 Discussion
The daily trends in gas and particle concentrations are consistent with a meteorological pattern in which the morning boundary layer in the regions below Altzomoni begins to increase in depth by turbulent mixing as the surface is heated by solar radiation and 20
larger scale eddies are generated by the vertical wind shear. As described by Fast et al. (1998) and Whiteman et al. (2000) the dynamics in the region of Mexico City are complex but on average, during the March time frame, flow up the sides of the mountains develops due to the thermal gradient produced by solar heating of both sides of the surrounding mountains. As the depth of the RML increases the larger 25
ACPD
9, 3265–3306, 2009Pollution in the regional mixed layer
of central Mexico
D. Baumgardner et al.
Title Page
Abstract Introduction
Conclusions References
Tables Figures
◭ ◮
◭ ◮
Back Close
Full Screen / Esc
Printer-friendly Version
Interactive Discussion
of free tropospheric air at the top of the boundary layer. In the absence of any new sources, the primary gases and particles will be diluted as they are transported and dispersed.
In 2006, the RML, as measured by wind profilers, radiosondes and lidar (Shaw et al., 2007) grew to an average depth of 3000±1000 m AGL by 17:00 LST±1 h. Based
5
on these measurements, made at several locations 30–50 km to the northeast of Mex-ico City, the RML would reach the height of 1700 m, the relative height of Altzomoni above the Mexico City basin, at 12:00±1 h. The concentration of gases and particles
at Altzomoni will begin to increase as the RML reaches the site, mixing with the local environment and achieving a maximum value as the top of the RML, where entrain-10
ment and mixing is most vigorous, continues to ascend above the ridge. After this time the concentrations will either decrease as dilution with free tropospheric air continues or, depending on the strength of the source and the local dynamics, the concentrations will remain approximately constant until the source of turbulent mixing is removed. By late afternoon, as the solar heating decreases, the surface begins to cool and the ther-15
mal structure boundary layer become more stable, cutting off the principle source of energy and initiating the decrease in the mixed level depth. In the region of Altzomoni the cooling of the mountain slopes produces a gradient flow down the hill sides with a subsequent decoupling between some fraction of the air in the upper portion of the RML and the air below. This forms an elevated, residual layer with higher concentra-20
tions of pollutants that remains after the lower of RML has receded below the altitude of the research site.
The CO and particle concentrations (Figs. 8 and 9) in the easterly and southwesterly flows show the first indication RML air between 10:00 and 11:00. The southwesterly flow reaches its peak concentrations first at 12:00, followed by the easterly at 13:30 25
anthro-ACPD
9, 3265–3306, 2009Pollution in the regional mixed layer
of central Mexico
D. Baumgardner et al.
Title Page
Abstract Introduction
Conclusions References
Tables Figures
◭ ◮
◭ ◮
Back Close
Full Screen / Esc
Printer-friendly Version
Interactive Discussion
pogenic emission are closer to Altzomoni on the west side than on the east where the change in altitude is much more gradual.
The interaction of topography and dynamics can also lead to oscillations in the depth of the RML so that the top of this layer can move up and down during the day. This is the likely source of the decrease then increase in the concentrations during the day 5
when the flow is from the east as the RML first grows above the Altzomoni site at 14:00, recedes as the wind speed decreases then moves above the site as the flow increases again from the east. On the days with flows from the southeast and south west, the gas and particle concentrations remain approximately constant as the rate of dilution by mixing and entrainment is balanced by a constant flow of new material 10
arriving from the sources of pollution. This continues until cooling of the surface begins late in the afternoon around 20:00 and the RML recedes, leaving behind a part of the contaminated air in the residual layer.
Measurements in 1997 in the southwestern sector of Mexico City (Raga et al., 1999), at a hillside research site 440 m above the city, showed concentrations of approximately 15
40 ppb in ozone at night time compared to values less than 20 ppb in the city. The higher values in O3were a result of the residual layer that remained after the nocturnal boundary layer had formed. At Altzomoni we see a similar trend except the residual layer O3is much higher in concentration, between 60 and 80 ppb.
It is instructive to compare a number of parameters measured at Altzomoni with 20
similar variables measured at other locations during the same or previous time periods. Several aircraft were operated during MILAGRO (Molina et al., 2008) and two of them, The Department of Energy (DOE) Gulfstream-1 and the NCAR/NSF C-130 carried aerosol mass spectrometers and CO analyzers, as well as many other gas and particle analyzers. The C130 made two vertical profiles approximately 50 km to the east of the 25
ACPD
9, 3265–3306, 2009Pollution in the regional mixed layer
of central Mexico
D. Baumgardner et al.
Title Page
Abstract Introduction
Conclusions References
Tables Figures
◭ ◮
◭ ◮
Back Close
Full Screen / Esc
Printer-friendly Version
Interactive Discussion
Hence the aircraft was measuring similar sulfate but lower OM than at the ground site, although the OM values are similar when comparing the aircraft data with early morning and late afternoon and evening periods at Altzomoni.
Measurements were made with an Aerodyne AMS in Mexico City during the 2003 MCCMA campaign (Molina et al., 2007; Salceda et al., 2006) and it was found that, 5
on average, the OM, sulfate, nitrate and EBC contributed 59%, 11%, 11% and 12%, respectively to the PM2.5mass, when removing the contribution from soil. At Altzomoni, as seen in Fig. 13, relative contributions of the ions and EBC depended on where the RML was in relation to the research site and the direction of the air flow. Regardless of the flow direction, in or out of the RML, the OM was the largest contributor to the total 10
mass. In the daytime it was 81%, 70% and 69% of the mass of particles coming from the east, southeast and southwest. At night these proportions changed to 54%, 48% and 65%. There was almost no change in how mass was apportioned between night and day in the southwesterly flow; however, in the easterly and southeasterly flow, the fraction of sulfate was three to ten times larger at night, depending on whether flow 15
was from the southeast or east.
The diurnal trends in the mass fractions are shown in Fig. 14. Because of the prob-lem with the AMS in the morning hours on the day with southwesterly flow, we can only discuss the full cycle in mass fractions of OM and sulfate during the easterly and southeasterly flow. These mass fractions are negatively correlated as the sulfate mass 20
fraction is maximum at night and minimum during the day whereas the OM follows the reverse trend. The mass fraction of EBC is largest in the morning in the easterly flow while generally small in the northeasterly flow except for a gradual increase in the frac-tion of mass it contributes until the RML arrives and the total mass becomes dominated by the OM.
25
ACPD
9, 3265–3306, 2009Pollution in the regional mixed layer
of central Mexico
D. Baumgardner et al.
Title Page
Abstract Introduction
Conclusions References
Tables Figures
◭ ◮
◭ ◮
Back Close
Full Screen / Esc
Printer-friendly Version
Interactive Discussion
in the age of the air where high values are related to locations further from the source (Kleinman et al., 2007). In Fig. 15, the daily trends in OM/CO, SO4/CO, NO3/CO and EBC/CO show that morning and nighttime ratios are much smaller than periods in the afternoon when the RML is present. Given that CO is a conservative tracer the higher ratios in the RML at Altzomoni indicate, in part, secondary production of OM and SO4. 5
The range in OM/CO in southeasterly and southwesterly flow is similar to the aircraft measurements; however, the low OM/CO values are not a result of being close to the primary emissions as was the case with the aircraft, but are background values in air that has been transported from much further away. The maximum OM/CO, SO4/CO and NO3/CO values are very similar to those measured by Kleinman et al. (2007) in air 10
they identified with aging less than 12 h.
The mass concentrations of OM and inorganic compounds do not show a significant decrease in concentration as related to the possible origins of the air masses. Average maximum values of CO in Mexico City during the March 2006 period ranged from 3– 5 ppm, as measured at the RAMA station at Merced whereas the maximum CO at the 15
Altzomoni site was between 0.20 and 0.35 ppb, or approximately a factor of ten dilution. The maximum CN concentrations at Altzomoni were between 15 000 and 30 000 cm−3, only a factor of 2–3 lower than similar measurements made in the city (Baumgardner et al., 2007). Salcedo et al. (2006) report average concentrations of OM and sulfate of 21 and 3µg m−3. At Altzomoni the mass concentrations are between 1–80 and 0.2 20
and 4.0µg m−3, respectively. In addition, the O3 concentration maxima at Altzomoni between 80 and 120 ppb are similar to the daily maxima in Mexico City. From this we conclude that O3 and particles at the Altzomoni site are not only coming from the primary emissions, but there are additional sources that offset the dilution as the RML grows.
25
ACPD
9, 3265–3306, 2009Pollution in the regional mixed layer
of central Mexico
D. Baumgardner et al.
Title Page
Abstract Introduction
Conclusions References
Tables Figures
◭ ◮
◭ ◮
Back Close
Full Screen / Esc
Printer-friendly Version
Interactive Discussion
a source indicator for inorganic species.
Figure 16 is a plot of CO versus OM for the three days, where each of the points is a fifteen minute average. The color of the symbol indicates the hour of the day as given by the scale to the right in the figure. The three lines, numbered 1–3 are CO/OM relationships that have been established for primary sources of emissions: 5
(1) diesel trucks (Lloyd and Cackette, 2001), (2) wood burning (Cabada et al., 2002) and (3) biomass burning (Andreae and Merlet, 2001). Note that the relationships 1–3 shown in this figure were derived for CO versus organic carbon (OC) rather than for OM that is measured by the AMS. These lines have been adjusted by a factor of 1.8 according to the average relationship between OM and OC that has been established 10
by Takegawa et al. (2005).
The day time pairs of CO and OM fall close to the line indicating biomass burning whereas at night most of the points are closest to the relationship that indicates wood burning. This suggests that in addition to those pollutants produced by the major ur-ban areas, there is also a significant contribution from biomass burning. The days that 15
were selected for this study were those where visual observations showed no obvious fires burning in the surrounding area, such as those that were evident in the first quar-ter of March. As reported by Yokelson et al. (2007), however, satellite observations show 218 fires in the study area and there was wide spread burning of waste in the Yucatan peninsula to the southwest. The air flow direction does not change the CO to 20
OM slopes. There are large agricultural areas in the Puebla valley and to the south of the mountains are other large agricultural areas where burn-offof planting areas in the spring is a routine practice. The larger concentrations in flow from the east probably reflects the closer proximity of wood fires and biomass burns while the lower concen-trations from the southeast are from the more diluted emissions from the Yucatan. As 25
ACPD
9, 3265–3306, 2009Pollution in the regional mixed layer
of central Mexico
D. Baumgardner et al.
Title Page
Abstract Introduction
Conclusions References
Tables Figures
◭ ◮
◭ ◮
Back Close
Full Screen / Esc
Printer-friendly Version
Interactive Discussion
flow and the sulfate was 30% of the total mass at night in the flow from the east and southeast, indicating secondary formation of sulfate compounds.
Another indicator of the source of anthropogenic pollution and the relative mix of fuel types during the combustion that produces the majority of primary particles and gases is the slope of the BC to CO relationship (Baumgardner et al., 2001). As shown 5
in Fig. 17, when compared with the BC to CO relationship measured in Mexico City in 2005 (Baumgardner et al., 2007), the day time relationship between BC (EBC in this study) and CO fall in three groups: early to mid-morning, afternoon and nighttime. Before the RML arrives in the early to mid-morning, the EBC to CO relationship has the steepest slopes and at night the slope is closer to the relationship measured in 10
Mexico City. When the slope is steep, these are periods also when the CO to OM com-parison indicated wood or biomass burning. When the RML arrives at Altzomoni, the CO increases with respect to the EBC and then at night a residual layer of CO remains while the concentration of BC particles decrease by deposition and coagulation.
5 Summary and conclusions
15
Measurements of gas concentrations and particle properties at a mountain location in the central plateau region of Mexico, at an altitude of 4010 m a.s.l., show that the CO in the regional boundary layer air that arrives at the research site has been diluted by a factor of ten but secondary processes maintain an ozone concentration whose max-imum of 110 ppb is similar to that of Mexico City. The CO to OM relationship indicates 20
that biomass and wood burning upwind of the Altzomoni research site produce organic material that is 80% of the total mass. Maximum particle concentrations were greater than 25×103cm−3, only a factor of three less than maxima measured in the center of
Mexico City. Large night time concentrations of ammonium and sulfate when flow is from the southeast suggest that emissions from burning in the Yucatan Peninsula are 25
being transported northwards.
ACPD
9, 3265–3306, 2009Pollution in the regional mixed layer
of central Mexico
D. Baumgardner et al.
Title Page
Abstract Introduction
Conclusions References
Tables Figures
◭ ◮
◭ ◮
Back Close
Full Screen / Esc
Printer-friendly Version
Interactive Discussion
populated city in the world, with an associated high level of pollution, there are other significant sources of pollution in Mexico that contribute to the mixture of emissions that is dispersed throughout the region. This mixture rapidly erases the signature of a unique Mexico City “plume” and suggests that the environmental impact of this region should be considered as one that stems from a large area source rather than a single 5
megacity.
Acknowledgements. The authors would like to thank the national park of Izta-Popo-Zoquiapan and its personnel for supporting the research at the Altzomoni measurement site and for assist-ing us in maintainassist-ing the equipment durassist-ing the project, Armando Retama, director of the Red Autom ´atica de Monitoreo Atmosf ´erico (RAMA) for providing the RAMA mobile van during the
10
preliminary measurements in November 2005 and the measurements from RAMA in the city during March 2006, S. Gilardoni and S. Liu, Scripps Institution of Oceanography, for providing the FTIR analysis of the filters, the McDonnel foundation for helping to fund the FTIR analysis, and to TSI Inc., Mexico, for the loan of the Scanning Mobility Paricle Sizer (SMPS) that was used during the project. This project was partially supported by PAPIIT grants #IN-117403
15
IN-113306.
References
Adachi, K. and Buseck, P. R.: Internally mixed soot, sulfates, and organic matter in aerosol particles from Mexico City, Atmos. Chem. Phys., 8, 6469–6481, 2008,
http://www.atmos-chem-phys.net/8/6469/2008/.
20
Andreae, M. O. and Merlet, P: Emissions of trace gases and aerosols from biomass burning, Global Biogeochem. Cy., 15, 955–966, 2001.
Baumgardner, D., Kok, G. L., and Raga, G. B.: On the diurnal variability of particle properties related to light absorbing carbon in Mexico City, Atmos. Chem. Phys., 7, 2517–2526, 2007, http://www.atmos-chem-phys.net/7/2517/2007/.
25
ACPD
9, 3265–3306, 2009Pollution in the regional mixed layer
of central Mexico
D. Baumgardner et al.
Title Page
Abstract Introduction
Conclusions References
Tables Figures
◭ ◮
◭ ◮
Back Close
Full Screen / Esc
Printer-friendly Version
Interactive Discussion
Bond, T. C., Anderson, T. L., and Cambell, D.: Calibration and intercomparison of filter-based measurements of visible light absorption by aerosols, Aerosol Sci. Tech., 30, 582–600, 1999. Bond, T. C. and Bergstrom, R. W.: Light absorption by carbonaceous particles: An investigative
review, Aerosol Sci. Tech., 40, 27–67, 2006.
Cabada, J. C., Pandis, S. N., and Robinson, A. L.: Sources of atmospheric carbonaceous
5
particulate matter in Pittsburgh, Pennsylvania, J. Air Waste Manage., 52, 732–741, 2002. Canagaratna, M. R., Jayne, J. T., Jimenez, J. L. , Allan, J. D. , Alfarra, M. R., Zhang, Q.,
Onasch, T. B., Drewnick, F., Coe, H., Middlebrook, A., Delia, A., Williams, L. R., Trimborn, A. M., Northway, M. J., DeCarlo, P. F., Kolb, C. E., Davidovits, P., Worsnop, D. R.: Chemical and Microphysical Characterization of Ambient Aerosols with the Aerodyne Aerosol Mass
10
Spectrometer, Mass Spectrom. Rev., 26, 185–222, 2007.
DeCarlo, P. F., Slowik, J. G., Worsnop, D. R., Davidovits, P., and Jimenez, J. L.: Particle Morphology and Density Characterization by Combined Mobility and Aerody-namic Diameter Measurements. Part 1: Theory, Aerosol Sci. Tech., 38, 1185–1205, doi:10.1080/027868290903907, 2004.
15
DeCarlo, P. F., Dunlea, E. J., Kimmel, J. R., Aiken, A. C., Sueper, D., Crounse, J., Wennberg, P. O., Emmons, L., Shinozuka, Y., Clarke, A., Zhou, J., Tomlinson, J., Collins, D. R., Knapp, D., Weinheimer, A. J., Montzka, D. D., Campos, T., and Jimenez, J. L.: Fast airborne aerosol size and chemistry measurements above Mexico City and Central Mexico during the MILAGRO campaign, Atmos. Chem. Phys., 8, 4027–4048, 2008,
20
http://www.atmos-chem-phys.net/8/4027/2008/.
Dickerson, R., Kondragunta, S., Stenchikov, G., Civerolo, K., and Doddridge, B: The impact of aerosols on solar UV radiation and photochemical smog, Science, 278, 827–830, 1997. Edgerton, S. A., Arriaga, J. L., Archuleta, J., Bian, X., Bossert, J. E., Chow, J. C., Coulter, R.
L., Doran, J. C., Doskey, P. V., Elliot, S., Fast, J. D., Gaffney, J. S., Guzman, F., Hubbe, J. M.,
25
Lee, J. T., Malone, E. L., Marley, N. A., McNair, L. A., Neff, W., Ortiz, E., Petty, R., Ruiz, M., Shaw, W. J., Sosa, G., Vega, E., Watson, J. G., Whiteman, C. D., and Zhong, S: Particulate air pollution in Mexico City: A collaborative research project, JAPCA J. Air Waste Ma. , 49, 1221–1229, 1999.
Fast, J. D. and Zhong, S. Y.: Meteorological factors associated with inhomogeneous ozone
30
concentrations within the Mexico City basin, J. Geophys. Res., 103, 18 927–18 946, 1998. Fast, J. D., de Foy, B., Acevedo Rosas, F., Caetano, E., Carmichael, G., Emmons, L., McKenna,
ACPD
9, 3265–3306, 2009Pollution in the regional mixed layer
of central Mexico
D. Baumgardner et al.
Title Page
Abstract Introduction
Conclusions References
Tables Figures
◭ ◮
◭ ◮
Back Close
Full Screen / Esc
Printer-friendly Version
Interactive Discussion
Madronich, S.: A meteorological overview of the MILAGRO field campaigns, Atmos. Chem. Phys., 7, 2233–2257, 2007,
http://www.atmos-chem-phys.net/7/2233/2007/.
Gaffney, J. S., Marley, N. A., Cunningham, M. M., and Doskey, P. V.: Measurements of peroxy-actyl nitrates (PANS) in Mexico City: implications for megacity air quality impacts on regional
5
scales, Atmos. Environ., 33, 5003–5012, 1999.
Gilardoni, S., Russell, L. M., Sorooshian, A., Flagan, R. C., Seinfeld, J. H., Bates, T. S., Quinn, P. K., Allan, J. D., Williams, B., Goldstein, A. H., Onasch, T. B., and Worsnop, D. R.: Regional variation of organic functional groups in aerosol particles on four U.S. east coast platforms during the International Consortium for Atmospheric Research on Transport and
Transfor-10
mation 2004 campaign, J. Geophys. Res., 112, D10S27, doi:10.1029/2006JD007737, 2007 Jim ´enez, J. C., Raga, G., Baumgardner, D., Castro, T., Rosas, I., Baez, A., and Morton, O.: On
the composition of airborne particles influenced by emissions of the volcano Popocatepetl in Mexico, Nat. Hazards, 1, 21–37, 2004
Kleinman, L. I., Springston, S. R., Daum, P. H., Lee, Y.-N., Nunnermacker, L. J., Senum, G.
15
I., Wang, J., Weinstein-Lloyd, J., Alexander, M. L., Hubbe, J., Ortega, J., Canagaratna, M. R., and Jayne, J.: The time evolution of aerosol composition over the Mexico City plateau, Atmos. Chem. Phys., 8, 1559–1575, 2008,
http://www.atmos-chem-phys.net/8/1559/2008/.
Liu, S., Takahama, S., Russell, L. M. , Gilardoni, S., Allan, J., and Baumgardner, D.: Functional
20
Group Signatures of Submicron Organic Aerosols during MILAGRO 2006, Proceedings of the American Association for Aerosol Research, Orlando, FL, October, 2008.
Lloyd, A. C. and Cackette, T. A.: Diesel engines: Environmental impact and control, J. Air Waste Manage. Assoc., 51, 809–847, 2001.
Maria, S. F., Russell, L. M., Turpin, B. J., and Porcja, R. J.: FTIR measurements of functional
25
groups and organic mass in aerosol samples over the Caribbean, Atmos. Environ., 36, 5815– 5196, 2002.
Maria, S. F., Russell, L. M., Turpin, B. J., Porcja, R. J., Campos, T. L., Weber, R. J. and Hue-bert, B. J.: Source signatures of carbon monoxide and organic functional groups in Asian Pacific Regional Aerosol Characterization Experiment (ACE-Asia) submicron aerosol types,
30
J. Geophys. Res., 108(D23), 8637, doi:10.1029/2003JD003703, 2003.
ACPD
9, 3265–3306, 2009Pollution in the regional mixed layer
of central Mexico
D. Baumgardner et al.
Title Page
Abstract Introduction
Conclusions References
Tables Figures
◭ ◮
◭ ◮
Back Close
Full Screen / Esc
Printer-friendly Version
Interactive Discussion
Molina, M. J.: Air quality in North America’s most populous city – overview of the MCMA-2003 campaign, Atmos. Chem. Phys., 7, 2447–2473, 2007,
http://www.atmos-chem-phys.net/7/2447/2007/.
Molina, L. T., Madronich, S., Gaffney, J., et al.: An Overview of MILAGRO 2006 Campaign: Mexico City Emissions and its Transport and Transformation, Atmos. Chem. Phys.,
submit-5
ted, 2008.
Nickerson, E., Sosa, G., Hochstein, H., McCaslin, P., Luke, W., and Schanot, A.: Project Aguila: in situ measurements of Mexico City air pollution by research aircraft, Atmos. Environ., 26(B), 445–451, 1992.
Nickerson, E., McCaslin, C. P., Sandoval, E., Paramo, V. H., and Gonzalez, E.: Aircraft
obser-10
vations of ozone, carbon monoxide and NOx over Mexico City during project AGUILA, in: Air Pollution I, editet by: Zanneti, P., Brebia, C. P., Garcia Gardea, J. E., and Ayala Milian, G., Computational Mechanics Publications, Southampton, 793 pp., 1993.
Perez Vidal, H. and Raga, G. B.: On the vertical distribution of pollutants in Mexico City, Atmos-fera, 11, 95–108, 1998.
15
Raga, G. B., Kok, G. L., Baumgardner, D., Rosas, I.: Some aspects of boundary layer evolution in Mexico City, Atmospheric Environ., 33, 5013–5021, 1999.
Raga, G. B and Raga, A. C.: On the formation of an elevated ozone peak in Mexico City, Atmospheric Environ., 34, 4097–4102, 2000.
Raga, G. B., Castro, T., and Baumgardner, D.: The impact of megacity pollution on local climate
20
and implications for the regional environment: Mexico City, Atmos. Environ., 35, 1805-1811, 2001.
Salcedo, D., Onasch, T. B., Dzepina, K., Canagaratna, M. R., Zhang, Q., Huffman, J. A., De-Carlo, P. F., Jayne, J. T., Mortimer, P., Worsnop, D. R., Kolb, C. E., Johnson, K. S., Zuberi, B., Marr, L. C., Volkamer, R., Molina, L. T., Molina, M. J., Cardenas, B., Bernab, R. M., Mrquez,
25
C., Gaffney, J. S., Marley, N. A., Laskin, A., Shutthanandan, V., Xie, Y., Brune, W., Lesher, R., Shirley, T., and Jimenez, J. L.: Characterization of ambient aerosols in Mexico City dur-ing the MCMA-2003 campaign with Aerosol Mass Spectrometry: results from the CENICA Supersite, Atmos. Chem. Phys., 6, 925–946, 2006,
http://www.atmos-chem-phys.net/6/925/2006/.
30
ACPD
9, 3265–3306, 2009Pollution in the regional mixed layer
of central Mexico
D. Baumgardner et al.
Title Page
Abstract Introduction
Conclusions References
Tables Figures
◭ ◮
◭ ◮
Back Close
Full Screen / Esc
Printer-friendly Version
Interactive Discussion
http://www.atmos-chem-phys-discuss.net/7/15025/2007/.
Takegawa, N., Miyazaki, Y., Kondo, Y., Komazaki, Y., Miyakawa, T., Jimenez, J. L., Jayne, J. T., Worsnop, D. R., Allan, J. D., and Weber, R. J.: Characterization of an Aerodyne Aerosol Mass Spectrometer (AMS): Intercomparison with Other Aerosol Instruments, Aerosol Sci. Tech., 39, 760–770, 2005.
5
Turpin, B. J. and Lim, H. J.: Species Contributions to PM2.5 Mass Concentrations: Revisiting
Common Assumptions for Estimating Organic Mass, Aerosol Sci. Tech., 35, 602–610, 2001. Whiteman, C. D., Zhong, S., Bian, X., Fast, J. D., and Doran, J. C.: Boundary layer evolution and
regional-scale diurnal circulations over the Mexico Basin and Mexican Plateau, J. Geophys. Res., 105, 10081–10102, 2000.
10
Yokelson, R. J., Urbanski, S. P., Atlas, E. L., Toohey, D. W., Alvarado, E. C., Crounse, J. D., Wennberg, P. O., Fisher, M. E., Wold, C. E., Campos, T. L., Adachi, K., Buseck, P. R., and Hao, W. M.: Emissions from forest fires near Mexico City, Atmos. Chem. Phys., 7, 5569– 5584, 2007,
http://www.atmos-chem-phys.net/7/5569/2007/.
ACPD
9, 3265–3306, 2009Pollution in the regional mixed layer
of central Mexico
D. Baumgardner et al.
Title Page
Abstract Introduction
Conclusions References
Tables Figures
◭ ◮
◭ ◮
Back Close
Full Screen / Esc
Printer-friendly Version
Interactive Discussion
Table 1.Instrumentation at Altzomoni.
Parameter Instrument Institute Detection Limit Accuracy State Parameters Davis Inc. UNAM −50 to+50◦
± Temperature, RH, Pressure 0 to 100% ±5%
Pressure 100 to 1024 ±1 mb
Winds Davis Inc. UNAM 0 to 50 ms−1
Solar Radiation Davis Inc. UNAM 0.285µm to 2.80µm ±1.5% 0 to 1400 Wm−2
UV Radiation Davis Inc. UNAM 0.295µm to 0.385µm ±1.5% 0 to 60 Wm−2
CO,O3 Active FTIR UNAM 1 ppb ±15%
CN TSI 3010 UNAM 0.01µm ±1.5%
Size Distribution TSI SMPS 3081 UNAM 0.020–0.514µm ±15% Size Distribution PMS LasAir 300 UNAM 0.3–25µm ±25% Absorption Coeff. Radiance PSAP UNAM 1 Mm−1
±25% Absorption Coeff. DMT PAS UNAM 1 Mm−1
±15% Scattering Coeff. Radiance UNLV 1 Mm−1
±25% Scattering Coeff. DMT PAS UNLV 1 Mm−1
±15% SO4, NO3, NH4, Aerodyne AMS Scripps/UNAM/U. Limit of Detection= 14%
OC, Cl Manchester 0.1µg m−3
ACPD
9, 3265–3306, 2009Pollution in the regional mixed layer
of central Mexico
D. Baumgardner et al.
Title Page
Abstract Introduction
Conclusions References
Tables Figures
◭ ◮
◭ ◮
Back Close
Full Screen / Esc
Printer-friendly Version
Interactive Discussion
! "# $ ! %%
! %% % ! & '
( )
! %% &
%
! %% % ! & % '
( % *
) + %
,%
,
,
ACPD
9, 3265–3306, 2009Pollution in the regional mixed layer
of central Mexico
D. Baumgardner et al.
Title Page
Abstract Introduction
Conclusions References
Tables Figures
◭ ◮
◭ ◮
Back Close
Full Screen / Esc
Printer-friendly Version
Interactive Discussion
ACPD
9, 3265–3306, 2009Pollution in the regional mixed layer
of central Mexico
D. Baumgardner et al.
Title Page
Abstract Introduction
Conclusions References
Tables Figures
◭ ◮
◭ ◮
Back Close
Full Screen / Esc
Printer-friendly Version
Interactive Discussion
Mexico City
Cuernavaca
Puebla
Altzomoni
ACPD
9, 3265–3306, 2009Pollution in the regional mixed layer
of central Mexico
D. Baumgardner et al.
Title Page
Abstract Introduction
Conclusions References
Tables Figures
◭ ◮
◭ ◮
Back Close
Full Screen / Esc
Printer-friendly Version
Interactive Discussion
ACPD
9, 3265–3306, 2009Pollution in the regional mixed layer
of central Mexico
D. Baumgardner et al.
Title Page
Abstract Introduction
Conclusions References
Tables Figures
◭ ◮
◭ ◮
Back Close
Full Screen / Esc
Printer-friendly Version
Interactive Discussion
4200
4000
3800
3600
3400
3200
3000
2800
2600
2400
2200
Al
ti
tude
30 25
20 15
10 5
0
Kilometers
Altzomoni West
East
ACPD
9, 3265–3306, 2009Pollution in the regional mixed layer
of central Mexico
D. Baumgardner et al.
Title Page
Abstract Introduction
Conclusions References
Tables Figures
◭ ◮
◭ ◮
Back Close
Full Screen / Esc
Printer-friendly Version
Interactive Discussion
ACPD
9, 3265–3306, 2009Pollution in the regional mixed layer
of central Mexico
D. Baumgardner et al.
Title Page
Abstract Introduction
Conclusions References
Tables Figures
◭ ◮
◭ ◮
Back Close
Full Screen / Esc
Printer-friendly Version
Interactive Discussion
ACPD
9, 3265–3306, 2009Pollution in the regional mixed layer
of central Mexico
D. Baumgardner et al.
Title Page
Abstract Introduction
Conclusions References
Tables Figures
◭ ◮
◭ ◮
Back Close
Full Screen / Esc
Printer-friendly Version
Interactive Discussion
ACPD
9, 3265–3306, 2009Pollution in the regional mixed layer
of central Mexico
D. Baumgardner et al.
Title Page
Abstract Introduction
Conclusions References
Tables Figures
◭ ◮
◭ ◮
Back Close
Full Screen / Esc
Printer-friendly Version
Interactive Discussion
Fig. 9.The diurnal variations in the concentrations of(A)condensation nuclei,(B)OPC particle
>0.3µm,(C)PM1.0 and(D)PM10 are shown for the same conditions as Fig. 7. Note that all
ACPD
9, 3265–3306, 2009Pollution in the regional mixed layer
of central Mexico
D. Baumgardner et al.
Title Page
Abstract Introduction
Conclusions References
Tables Figures
◭ ◮
◭ ◮
Back Close
Full Screen / Esc
Printer-friendly Version
Interactive Discussion
ACPD
9, 3265–3306, 2009Pollution in the regional mixed layer
of central Mexico
D. Baumgardner et al.
Title Page
Abstract Introduction
Conclusions References
Tables Figures
◭ ◮
◭ ◮
Back Close
Full Screen / Esc
Printer-friendly Version
Interactive Discussion
! "#" $ %
& "#" ! $ %
!' "( ' "$ %
&
' "( !' "$ %
"
Fig. 11. The FTIR analysis of the components of organic carbon on filters taken in at night (top panel) and during the day (bottom panel) are shown for the cases of flow from the east (left side) and from the southwest (right side). The values are given as percentages of the total organic carbon derived from the analysis.
ACPD
9, 3265–3306, 2009Pollution in the regional mixed layer
of central Mexico
D. Baumgardner et al.
Title Page
Abstract Introduction
Conclusions References
Tables Figures
◭ ◮
◭ ◮
Back Close
Full Screen / Esc
Printer-friendly Version
Interactive Discussion
ACPD
9, 3265–3306, 2009Pollution in the regional mixed layer
of central Mexico
D. Baumgardner et al.
Title Page Abstract Introduction Conclusions References Tables Figures ◭ ◮ ◭ ◮ Back Close
Full Screen / Esc
Printer-friendly Version Interactive Discussion ORG 54% SO4 27% NO3 2% NH4 8% EBC 9% ORG 65% SO4 15% NO3 8% NH4 10% EBC 2% ORG 81% SO4 3% NO3 10% NH4 4% EBC 2% ORG 69% SO4 13% NO3 7% NH4 9% EBC 2% Easterly Southwesterly Night Afternoon ORG 48% SO4 31% NO3 4% NH4 13% EBC 3% ORG 70% SO4 13% NO3 5% NH4 6% EBC 6% Southeasterly
ACPD
9, 3265–3306, 2009Pollution in the regional mixed layer
of central Mexico
D. Baumgardner et al.
Title Page
Abstract Introduction
Conclusions References
Tables Figures
◭ ◮
◭ ◮
Back Close
Full Screen / Esc
Printer-friendly Version
Interactive Discussion
ACPD
9, 3265–3306, 2009Pollution in the regional mixed layer
of central Mexico
D. Baumgardner et al.
Title Page
Abstract Introduction
Conclusions References
Tables Figures
◭ ◮
◭ ◮
Back Close
Full Screen / Esc
Printer-friendly Version
Interactive Discussion
ACPD
9, 3265–3306, 2009Pollution in the regional mixed layer
of central Mexico
D. Baumgardner et al.
Title Page
Abstract Introduction
Conclusions References
Tables Figures
◭ ◮
◭ ◮
Back Close
Full Screen / Esc
Printer-friendly Version
Interactive Discussion
0.35
0.30
0.25
0.20
0.15
0.10
0.05
Carbon Monoxide (ppm)
40 35
30 25
20 15
10 5
0
OM (µg m-3)
Easterly Soutwesterly Southeasterly
20
15
10
5
Ho
u
r o
f D
a
y
(1)
(2)
(3)
ACPD
9, 3265–3306, 2009Pollution in the regional mixed layer
of central Mexico
D. Baumgardner et al.
Title Page
Abstract Introduction
Conclusions References
Tables Figures
◭ ◮
◭ ◮
Back Close
Full Screen / Esc
Printer-friendly Version
Interactive Discussion
1000
900
800
700
600
500
400
300
200
100
0
EBC (ng m
-3 )
0.50 0.45
0.40 0.35
0.30 0.25
0.20 0.15
0.10 0.05
0.00
Carbon Monoxide (ppm)
20
15
10
5
H
o
ur of D
a
y
(
L
ST)
Easterly Southwesterly Southeasterly
Mexico City, April 2005