Exenatide Treatment Alone Improves
β
-Cell
Function in a Canine Model of Pre-Diabetes
Viorica Ionut1☯†, Orison O. Woolcott1☯, Hasmik J. Mkrtchyan1, Darko Stefanovski1, Morvarid Kabir1, Malini S. Iyer1, Huiwen Liu2, Ana V. B. Castro1, Qiang Wu1, Josiane L. Broussard1, Cathryn M. Kolka1, Isaac Asare-Bediako1, Richard N. Bergman1*
1Diabetes and Obesity Research Institute, Cedars-Sinai Medical Center, Los Angeles, California, United States of America,2Department of Physiology and Biophysics, University of Southern California, Los Angeles, California, United States of America
†Deceased.
☯These authors contributed equally to this work. *[email protected]
Abstract
Background
Exenatide’s effects on glucose metabolism have been studied extensively in diabetes but not in pre-diabetes.
Objective
We examined the chronic effects of exenatide alone on glucose metabolism in pre-diabetic canines.
Design and Methods
After 10 weeks of high-fat diet (HFD), adult dogs received one injection of streptozotocin (STZ, 18.5 mg/kg). After induction of pre-diabetes, while maintained on HFD, animals were randomized to receive either exenatide (n = 7) or placebo (n = 7) for 12 weeks.β-Cell func-tion was calculated from the intravenous glucose tolerance test (IVGTT, expressed as the acute insulin response,AIRG), the oral glucose tolerance test (OGTT, insulinogenic index) and the graded-hyperglycemic clamp (clamp insulinogenic index). Whole-body insulin sen-sitivity was assessed by the IVGTT. At the end of the study, pancreatic islets were isolated to assessβ-cell functionin vitro.
Results
OGTT: STZ caused an increase in glycemia at 120 min by 22.0% (interquartile range, IQR, 31.5%) (P = 0.011). IVGTT: This protocol also showed a reduction in glucose tolerance by 48.8% (IQR, 36.9%) (P = 0.002).AIRGdecreased by 54.0% (IQR, 40.7%) (P = 0.010), lead-ing to mild fastlead-ing hyperglycemia (P = 0.039). Exenatide, compared with placebo,
decreased body weight (P<0.001) without altering food intake, fasting glycemia, insuline-mia, glycated hemoglobin A1c, or glucose tolerance. Exenatide, compared with placebo, increased both OGTT- (P = 0.040) and clamp-based insulinogenic indexes (P = 0.016),
a11111
OPEN ACCESS
Citation:Ionut V, Woolcott OO, Mkrtchyan HJ, Stefanovski D, Kabir M, Iyer MS, et al. (2016) Exenatide Treatment Alone Improvesβ-Cell Function in a Canine Model of Pre-Diabetes. PLoS ONE 11(7): e0158703. doi:10.1371/journal.pone.0158703
Editor:Marta Letizia Hribal, University of Catanzaro Magna Graecia, ITALY
Received:January 8, 2016
Accepted:May 18, 2016
Published:July 11, 2016
Copyright:© 2016 Ionut et al. This is an open access article distributed under the terms of the Creative Commons Attribution License, which permits unrestricted use, distribution, and reproduction in any medium, provided the original author and source are credited.
Data Availability Statement:All data necessary to replicate the study described are in the paper.
Funding:This work was supported by National Institutes of Health (DK29867 and DK27619 to RNB) (https://report.nih.gov/award/index.cfm). The funders had no role in study design, data collection and analysis, decision to publish, or preparation of the manuscript.
improved insulin secretionin vitro(P = 0.041), but had no noticeable effect on insulin sensi-tivity (P = 0.405).
Conclusions
In pre-diabetic canines, 12-week exenatide treatment improvedβ-cell function but not glu-cose tolerance or insulin sensitivity. These findings demonstrate partial beneficial metabolic effects of exenatide alone on an animal model of pre-diabetes.
Introduction
Insulin resistance andβ-cell dysfunction play fundamental roles in the pathogenesis of type 2 diabetes. Impairment ofβ-cell function to compensate to for insulin resistance accelerates the progression to type 2 diabetes [1].
Exenatide, a synthetic analogue of exendin-4, a natural ligand of the glucagon-like peptide 1 receptor, has been extensively used for type 2 diabetes treatment. Exenatide has been shown to reduce hyperglycemia, promote body weight loss, and improve insulin sensitivity andβ-cell func-tion, resulting in lower hemoglobin A1c levels [2]. However, it is unclear whether these multiple effects are related to exenatideper seor concomitant interventions such as lifestyle changes or combined antidiabetic drugs. Numerous studies have explored the therapeutic effects of exena-tide in type 2 diabetes [3], but few studies have examined its metabolic effects on pre-diabetes. Impaired fasting glucose and impaired glucose tolerance are well established risk factors for type 2 diabetes [4–7]. Treatment of these pre-diabetic conditions has been associated with delayed progression to diabetes [6]. Previous clinical studies have explored the effect of exenatide on glu-cose tolerance (in combination with lifestyle changes) [8], insulin sensitivity, andβ-cell function (in combination with pioglitazone and metformin) [9], and the homeostasis model assessment-insulin resistance index [10]. However, none of these studies has systematically explored the effect of exenatide alone on glucose homeostasis in the pre-diabetes state.
The prevalence of pre-diabetes (impaired fasting glucose or impaired glucose tolerance) in the United States has been estimated in ~35% [11]. Given the high prevalence of pre-diabetes, a high risk factor for type 2 diabetes [4], and the widely use of exenatide in the clinical practice, we thought it is relevant to further study the metabolic effects of exenatide alone in a canine model of pre-diabetes. In the present study, we hypothesize that chronic treatment with exena-tide alone improves glucose homeostasis in the pre-diabetic state. Thus, we determined the effects of exenatide on glucose tolerance,β-cell function, and insulin sensitivity in a canine model of pre-diabetes.
Materials and Methods
Animals and diet regimen
Experiments were conducted in adult male mongrel dogs, 1–2 years old. Dogs were supplied by Antech, Inc. (Barnhart, MO). Animals were single housed in stainless steel kennels in the vivar-ium of the Keck School of Medicine, University of Southern California (Los Angeles, CA). Ken-nels had gates between runs, fiberglass slatted floors or plastic coated expanded metal floors (24 square feet of floor space), and stainless steel feeders. Animals were permitted social contact between the runs through a steel mesh wall. Animals were provided with environmental enrichment. Dogs received positive interactions with animal care staff on a daily basis. Dogs were exercised within the room during room cleaning. Before the commencement of the study,
animals received a standard diet consisted of 825 g of dry chow and one canned food (Hill’s Pet Nutrition, Topeka, KS) for 2–3 weeks [12]. Thereafter, animals were fed a hypercaloric high-fat diet (HFD) until the end of the study. HFD diet consisted of 825 g of dry chow and one canned food supplemented with lard (6 g/kg of baseline body weight). Total daily food presented (09:00–12:00 h) contained 5,527 kcal (53.0% from fat). Daily food intake was assessed by sub-tracting the weight of food presented from the weight of food left in the bowl or dropped on the floor. Water was providedad libitum.
Study design
Allin vivoexperiments were performed in the morning, after 12–16 hours of fasting. Biopsies from liver and pancreas forin vitroexperiments were obtained at the end of study, prior to euthanasia, under general inhalant anesthesia (3% isoflurane). The full study protocol was approved by the Institutional Animal Care and Use Committees from the University of South-ern California and the Cedars-Sinai Medical Center (Los Angeles, CA).
After an initial 10 weeks of HFD, starting at week−15, animals received a single intravenous
dose of streptozotocin (STZ, 18.5 mg/kg of body weight) at week−5. This dose was previously
found to be effective in fat-fed canines to induce pre-diabetes [13]. Five weeks after STZ admin-istration, animals were randomized to receive either exenatide (n = 7; 10μg subcutaneously b.i.
d. during the weekdays and once daily during weekends) or placebo (n = 7). Drug treatment started at week 0 and continued until the end of the study (week 12, our primary endpoint). HFD was initiated at week−15 and was maintained until the end of the study. The oral glucose
tolerance test (OGTT) and the intravenous glucose tolerance test (IVGTT) were performed in all animals at the beginning of the study, prior to the commencement of exenatide treatment (week 0), and at the end of the study. Body weight was assessed weekly. Daily food intake was recorded starting at week 0. IVGTT was also performed at weeks 3, 6, and 9. Fasting plasma glucose and insulin were also measured during IVGTT experiments. Hyperglycemic clamp and magnetic resonance imaging (MRI) of the abdominal region were performed at weeks 0 and 12. Likewise, assessment of fasting plasma glucagon, glycated hemoglobin A1c, and energy expenditure (resting metabolic rate) were performed at weeks 0 and 12.
Exenatide was kindly provided by Amylin Pharmaceuticals Inc. Streptozotocin was pur-chased from Aldrich (St Louis, MO), dissolved in citrate buffer solution (pH 4.5; Sigma-Aldrich) immediately before injection [13].
Experimental procedures
MRI. Fat distribution in the abdominal region was assessed under general anesthesia by MRI using a 1.5-T Siemens Scanner [12]. MRI scan included eleven transverse 10-mm thick slices. For each slice, major regions of the abdominal anatomy (extra- and intra-abdominal compartments) were defined by manual drawing. Fat and non-fat tissues were distinguished based on pixel intensity using an imaging software (sliceOmatic 4.3, Tomovision, Magog, QC, Canada). Total abdominal fat volume included the sum of subcutaneous and visceral fat obtained from the 11 slices [12].
OGTT. Glucose 50% was given as a bolus by oral gavage. Blood samples were taken at 15,
30, 45, 60, 90, 120, and 180 min [14]. Glucose tolerance was measured as the glucose concen-tration at t = 120 min.β-Cell function was measured as the OGTT insulinogenic index: the ratio of the over-basal area under the curve (AUC) of plasma insulin (mU/L) to over-basal AUC of plasma glucose (mg/dL). AUCs of plasma glucose (AUCGLUCOSE), insulin (AUC
INSU-LIN), and glucagon (AUCGLUCAGON) were calculated using the trapezoidal rule (Prism 4.0,
IVGTT. β-Cell function (acute insulin response,AIRG), whole-body insulin sensitivity
(SI), the disposition index (DI), glucose effectiveness (SG), intravenous glucose tolerance (KG),
and hepatic insulin clearance were calculated from the IVGTT, performed as previously described [15,16]. Hepatic insulin clearance was expressed as the fractional clearance rate of insulin (FCR) and the metabolic clearance rate of insulin (MCR) [17]. A bolus of glucose 50% (0.3 g/kg of body weight) was given intravenously at 0 min and a bolus of insulin (0.03 U/kg of body weight) at 20 min. Blood samples were taken at t = 2, 3, 4, 5, 6, 8, 10, 12, 14, 16, 19, 22, 23, 24, 25, 30, 40, 50, 60, 70, 80, 90, 100, 110, 120, 140, 160, and 180 min.AIRG,SI,DI, andSGwere
calculated using MINMOD (Minmod Millennium version 6.02, MINMOD Inc., Los Angeles, CA).KGwas calculated as the negative slope of the natural log of glucose versus time from
t = 10 to t = 19 min.FCRandMCRwere calculated using WINSAAM (version 3.3.0, University of Pennsylvania) [17].FCRwas calculated from the decay of plasma insulin after the intrave-nous bolus. Insulin from t = 22–80 min was fit to the following exponential decay curve.MCR
was calculated as the ratio of the dose of injected insulin during the IVGTT to the over-baseline area under the curve of insulin after time of injection to infinity.
Graded-hyperglycemic clamp. Glucose 50% was infused intravenously in a peripheral
vein at variable rates so as to maintain blood glucose constant at three sequential concentra-tions: 100 mg/dL (t= 0–59 min), 150 mg/dL (t= 60–149 min) and 200 mg/dL (t= 150–240 min) [18].β-Cell function was calculated as the slope of the linear relation between insulin (mU/L) and glucose (mg/dL) during the steady-state at each glucose clamp value (100 mg/dL, 150 mg/dL, and 200 mg/dL) [18].β-Cell function was also measured as the clamp insulinogenic index: the ratio of the over-basal AUCINSULINto over-basal AUCGLUCOSE.
Resting metabolic rate. Resting metabolic rate was assessed as previously described [12]
using indirect calorimetry. Data were analyzed using TurboFit (VacuMed, Ventura, CA).
Islet static incubation. Islets were isolated from the pancreas tail immediately before
euthanasia [18,19]. Allin vitroexperiments were performed after 18–24 h culture in 5-cm petri dishes. Prior to static incubation experiments, islets were washed three times in Krebs-Ringer bicarbonate buffer modified with HEPES [19,20]. Islets were hand-picked and trans-ferred to 24-well culture plates containing Krebs-Ringer buffer. After 1-h equilibrium period at 37°C with 3 mmol/L glucose, separate batches of islets (15 islets per well, three-replicate experi-ments) were exposed to either 3, 7, 10, 15, 20, or 27 mmol/L glucose for one additional hour (glucose solution was added to reach such concentrations).β-Cell function was calculated as 1) the total insulin secreted at the end of the static incubation (pmol•L−1/islet/h) and 2) the
stimu-lation index: the ratio of the insulin secreted at high glucose concentration (second hour of the static incubation) to the basal insulin (equilibrium period) [19].
Liver gene expression. RNA was extracted from biopsied hepatic tissues using the
Tri-Reagent Kit (Molecular Research Center, Cincinnati, OH). First-strand cDNA was synthesized according to manufacturer’s protocol, using 1μg of total RNA using Superscript II (Invitrogen,
Carlsbad, CA). Real-time polymerase-chain reaction (RT-PCR) was performed using a Light-Cycler 4.8 instrument (Roche Applied Science, Indianapolis, IN). cDNA was amplified using the‘universal probe system’on a Roche microplate with a final volume of 10μL reaction mix
containing 2.5μL, 100-fold diluted cDNA, 7μL LightCycler TaqMan Master Mix buffer
(Roche Probes Master kit, Roche Applied Science, Indianapolis, IN), 1μmol/L specific
for-ward-reverse primers and 0.5μL specific universal probes. Primers and universal probes are
Blood sampling and biochemical assays. Blood samples were collected, stored, and ana-lyzed as previously described [13,18]. Insulin from plasma andin vitroexperiments were determined by ELISA (human kit, Millipore) [19]. Glucagon concentration was measured by radioimmunoassay (canine kit, Millipore).
Statistical analyses
Since data were non-normally distributed, non-parametric tests were used. Data were expressed as medians and their interquartile range (IQR). Wilcoxon matched-pairs signed-rank test and Mann-Whitney U test were used for comparison within and between groups, respectively. Quade’s test was used to compare the metabolic effects of exenatide versus placebo adjusting for pretreatment values. Mixed-effects linear regression [21]) was used to compare groups when repeated measures were performed, testing for treatment X time interaction. Friedman ANOVA was used if interaction was found to be significant. Differences were statis-tically significant if P was less than 0.05. All analyses were performed using IBM SPSS Statistics version 20.0 and Stata/SE 10.0 for Windows (StataCorp LP, College Station, TX).
Results
Pre-diabetes induction
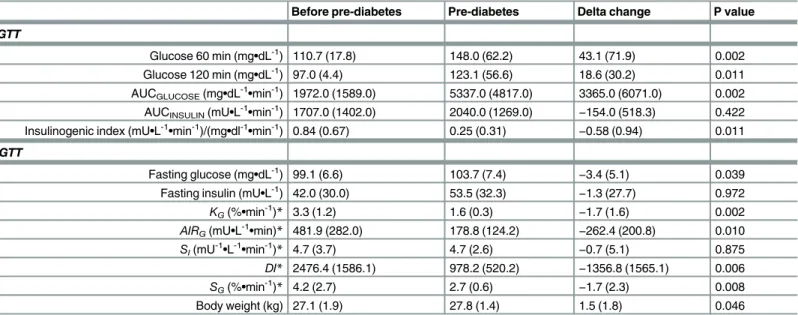
STZ treatment resulted in a decrease in glucose tolerance (Table 2). Glycemia at 120 min post-oral glucose challenge increased by 22.0% (IQR, 31.5%) (P = 0.011).KGdecreased by 48.8%
(36.9%) (P = 0.002). Fasting glycemia increased by 3.4% (IQR, 4.9%); P = 0.039), from 99.1 mg/dL (6.6 mg/dL) to 103.7 mg/dL (7.4 mg/dL). Fasting plasma insulin remained unchanged (P = 0.972). OGTT insulinogenic index decreased by 73.6% (IQR, 41.3%) (P = 0.011) and
AIRGfell by 54.0% (IQR, 40.7%) (P = 0.010). Since insulin sensitivity remained unchanged
(P = 0.875),DIdecreased accordingly (P = 0.006).SGalso decreased (P = 0.008). Body weight
increased by 5.8% (IQR, 6.9%) (P = 0.046).
Effect of exenatide on food intake and body composition
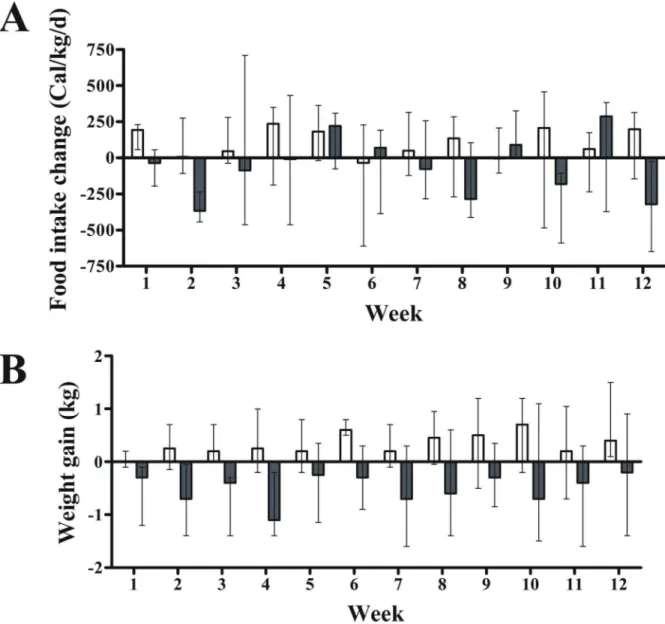
Exenatide’s effect on food intake was not different from placebo throughout the study
(P = 0.494; mixed model regression) (P = 0.603, Quade’s test) or at week 12 (Fig 1andTable 3).
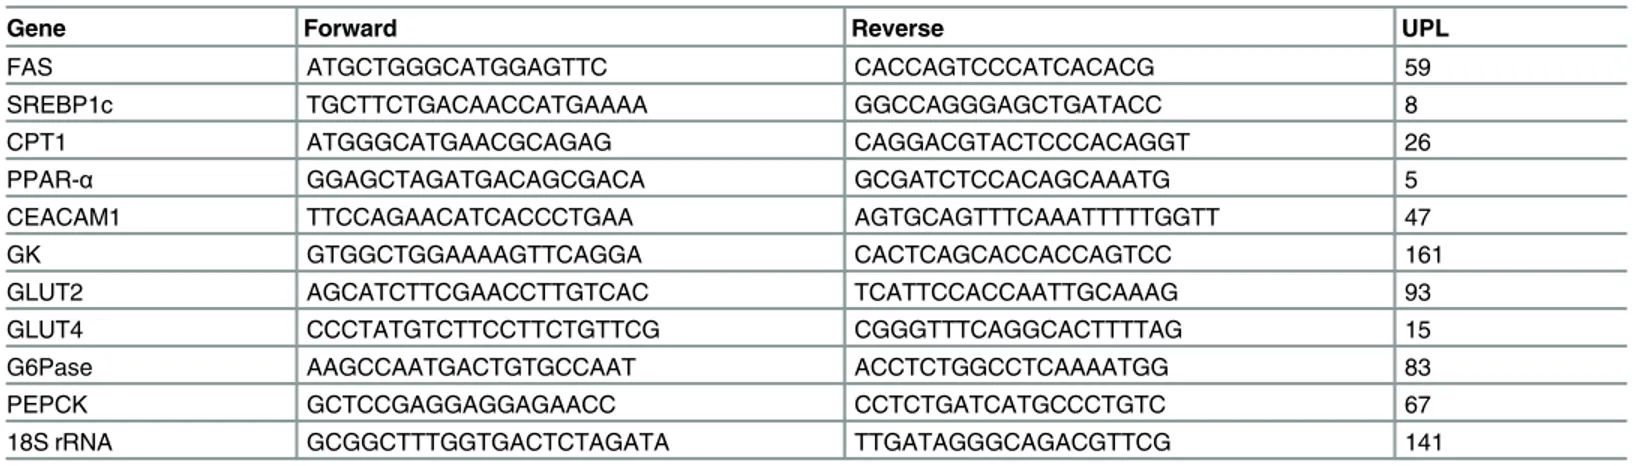
Table 1. Primers and probes used for RT-PCR.
Gene Forward Reverse UPL
FAS ATGCTGGGCATGGAGTTC CACCAGTCCCATCACACG 59
SREBP1c TGCTTCTGACAACCATGAAAA GGCCAGGGAGCTGATACC 8
CPT1 ATGGGCATGAACGCAGAG CAGGACGTACTCCCACAGGT 26
PPAR-α GGAGCTAGATGACAGCGACA GCGATCTCCACAGCAAATG 5
CEACAM1 TTCCAGAACATCACCCTGAA AGTGCAGTTTCAAATTTTTGGTT 47
GK GTGGCTGGAAAAGTTCAGGA CACTCAGCACCACCAGTCC 161
GLUT2 AGCATCTTCGAACCTTGTCAC TCATTCCACCAATTGCAAAG 93
GLUT4 CCCTATGTCTTCCTTCTGTTCG CGGGTTTCAGGCACTTTTAG 15
G6Pase AAGCCAATGACTGTGCCAAT ACCTCTGGCCTCAAAATGG 83
PEPCK GCTCCGAGGAGGAGAACC CCTCTGATCATGCCCTGTC 67
18S rRNA GCGGCTTTGGTGACTCTAGATA TTGATAGGGCAGACGTTCG 141
18S rRNA, 18S ribosomal RNA; CEACAM1, carcinoembryonic antigen-related cell adhesion molecule 1; CPT1, carnitine palmitoyltransferase I; FAS, Fas cell surface death receptor; G6Pase, glucose-6-phosphatase; GK, glucokinase; GLUT2, glucose transporter type 2; GLUT4, glucose transporter type 4; PEPCK, phosphoenolpyruvate carboxykinase; PPAR-α, peroxisome proliferator-activated receptor alpha; RT-PCR, real-time polymerase-chain reaction; SREBP1c, sterol regulatory element-binding protein 1c; UPL, Universal Probe Library.
In fact, there was a high variability in food intake (Fig 1A). In contrast, exenatide, compared with placebo, did promote mild body weight loss throughout the study (P<0.001; mixed model regression) (Fig 1B) with no effect on abdominal fat distribution (Table 3).
Effect of exenatide on fasting plasma glucose, insulin, glucagon, and
glycated hemoglobin A1c
Analysis of repeated measures showed no differences between groups in fasting plasma glucose (P = 0.663; mixed model) or insulin (P = 0.349) (Fig 2). However, since time interacted with treat-ment for insulin (P = 0.034) outcomes, Friedman ANOVA was performed independently. We found no changes in plasma insulin with placebo (P = 0.725) or exenatide (P = 0.150). Likewise, we found no changes in glycated hemoglobin A1c in the exenatide or placebo group (Fig 2).
Effects of exenatide on glucose metabolism, insulin clearance, and
energy expenditure
Exenatide treatment had no effect on oral glucose tolerance (Fig 3andTable 4). Glycemia at 120 min post-oral glucose challenge remained unchanged (P = 1.00). Exenatide was not bet-ter than placebo in improving AUCGLUCOSE(P = 0.063;Fig 3AandFig 3B), AUCINSULIN
(P = 0.133;Fig 3CandFig 3D) or AUCGLUCAGON(P = 0.618;Fig 3EandFig 3F). Likewise,KG
was not different between groups (P = 0.658, mixed model). However, compared with placebo, exenatide had a beneficial effect on OGTT insulinogenic index (P = 0.040, Quade’s test) (Table 4), even while adjusting for body weight (P = 0.032, mixed model).
Data calculated from the IVGTT (Fig 4) showed no exenatide effects onAIRG,SI,DIorSG
when compared with placebo (Table 4). Likewise, we found no differences between groups in insulin clearance throughout the study (MCR: P = 0.952;FCR: P = 0.499; mixed model). The
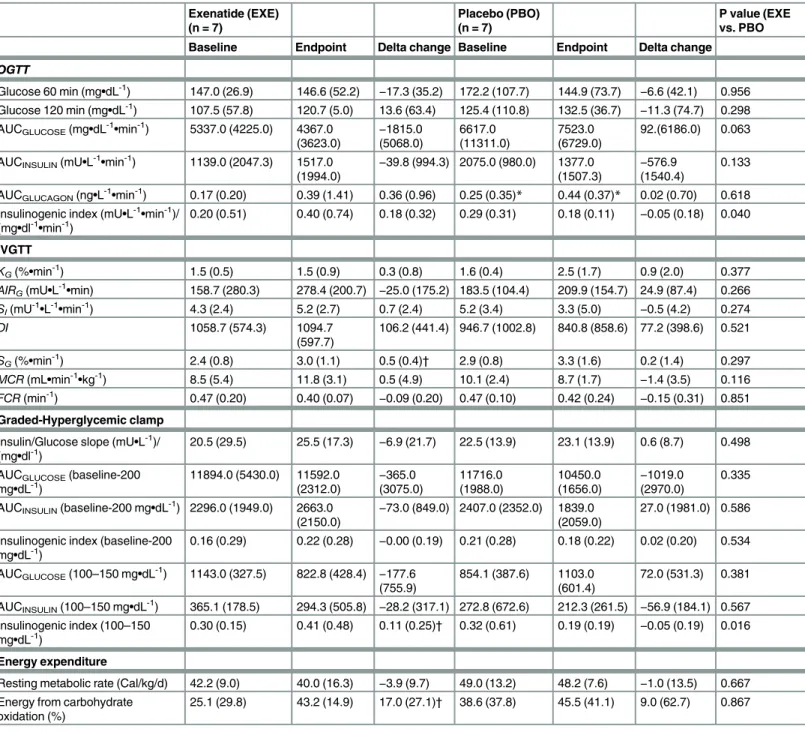
Table 2. Changes in metabolic parameters after induction of pre-diabetes following a single dose of streptozotocin (STZ) in high-fat-fed canines (n = 13).
Before pre-diabetes Pre-diabetes Delta change P value
OGTT
Glucose 60 min (mg•dL-1) 110.7 (17.8) 148.0 (62.2) 43.1 (71.9) 0.002 Glucose 120 min (mg•dL-1) 97.0 (4.4) 123.1 (56.6) 18.6 (30.2) 0.011 AUCGLUCOSE(mg•dL-1•min-1) 1972.0 (1589.0) 5337.0 (4817.0) 3365.0 (6071.0) 0.002 AUCINSULIN(mU•L-1•min-1) 1707.0 (1402.0) 2040.0 (1269.0) −154.0 (518.3) 0.422
Insulinogenic index (mU•L-1•min-1)/(mg•dl-1•min-1) 0.84 (0.67) 0.25 (0.31)
−0.58 (0.94) 0.011
IVGTT
Fasting glucose (mg•dL-1) 99.1 (6.6) 103.7 (7.4) −3.4 (5.1) 0.039
Fasting insulin (mU•L-1) 42.0 (30.0) 53.5 (32.3)
−1.3 (27.7) 0.972
KG(%•min-1)* 3.3 (1.2) 1.6 (0.3) −1.7 (1.6) 0.002
AIRG(mU•L-1•min)* 481.9 (282.0) 178.8 (124.2) −262.4 (200.8) 0.010
SI(mU-1•L-1•min-1)* 4.7 (3.7) 4.7 (2.6) −0.7 (5.1) 0.875
DI* 2476.4 (1586.1) 978.2 (520.2) −1356.8 (1565.1) 0.006
SG(%•min-1)* 4.2 (2.7) 2.7 (0.6) −1.7 (2.3) 0.008
Body weight (kg) 27.1 (1.9) 27.8 (1.4) 1.5 (1.8) 0.046
Values are medians (interquartile range). Delta change column represents changes from baseline (before pre-diabetes). *Due to partial missing insulin data, only 12 dogs were included for analyses.
P values were determined by Wilcoxon matched-pairs signed-rank test.AIRG, acute insulin response to glucose; AUC, area under the curve;DI, disposition
index; IVGTT, intravenous glucose tolerance test;KG, intravenous glucose tolerance; OGTT, oral glucose tolerance test;SI, insulin sensitivity;SG, glucose
effectiveness.
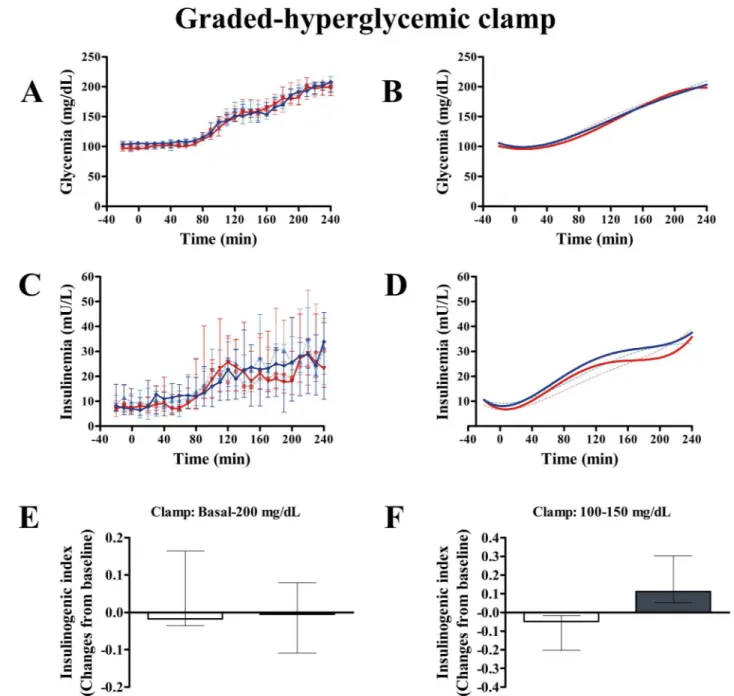
insulin/glucose slope calculated from the graded-hyperglycemic clamp was not different between groups (P = 0.498) (Table 4). Likewise, clamp insulinogenic index from t = -20 to t = 240 was not different between groups (P = 0.534) (Fig 5). However, we noted that the clamp insulinogenic index estimated from t = 40 to t = 110 (period when the median plasma glucose actually increased from ~100 mg/dL to ~150 mg/dL), improved with exenatide (P = 0.043 vs. baseline; P = 0.016, between groups, Quade’s test) (Fig 5andTable 4). We did not see changes inβ-cell function from t =−20 to t = 30 (P = 0.492, Quade’s test). Likewise, we did not see
changes inβ-cell function from t = 120 to t = 240 (when the median glucose increased from ~150 mg/dL to 200 mg/dL) (P = 0.753, Quade’s test).
Although we found no differences in resting metabolic rate (Table 4), exenatide group showed an increase in carbohydrate oxidation (P = 0.046). However, this effect was not differ-ent compared with placebo (P = 0.867, Quade’s test).
Fig 1. Effect of exenatide on food intake and body weight in pre-diabetic canines (n = 14).Overall, compared with placebo, 12-week treatment with exenatide had no effect on food intake (A) but did reduce body weight (B) throughout the study (P<0.001;
mixed model regression). Gray and white columns indicate exenatide and placebo groups, respectively. Top of columns are medians. Bars are upper and lower quartiles.
Effect of exenatide on
β
-cell and liver function
in vitro
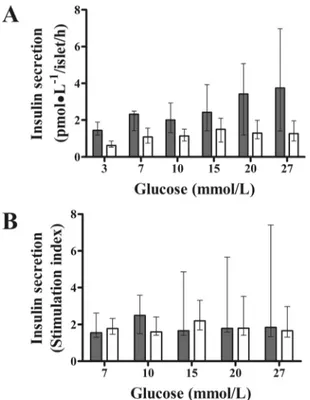
Exenatide, compared with placebo, improved glucose-stimulated insulin secretionin vitro
(P = 0.041, mixed model) (Fig 6), likely influenced by increased basal insulin in the exenatide group (P = 0.046) (Fig 6A). When glucose-stimulated insulin secretion was adjusted for basal insulin, the differences between groups disappeared (P = 0.184).β-Cell function expressed as the stimulation index was not different between groups (P = 0.523;Fig 6B).
Since an increase in carbohydrate oxidation occurred with exenatide, we measured mRNA expression of liver genes related to fat and glucose metabolism. We found no significant differ-ences between groups in genes related to fatty acid synthesis (Fas cell surface death receptor: P = 0.291; sterol regulatory element-binding protein 1c: P = 0.685), glucose oxidation (glucose transporter type 2: P = 0.223; glucose transporter type 4: P = 0.391; glucokinase: P = 0.062), fat oxidation (carnitine palmitoyltransferase I: P = 0.123; peroxisome proliferator-activated recep-tor alpha: P = 0.062); or insulin clearance (carcinoembryonic antigen-related cell adhesion molecule 1: P = 0.223). Although we found lower mRNA expression of glucose-6-phosphatase (P = 0.028) in the exenatide group, as compared with placebo, mRNA expression of phospho-enolpyruvate carboxykinase was not significantly different (P = 0.116); thus, our data do not conclusively support an inhibitory effect of exenatide on gluconeogenic activity.
Discussion
Our findings indicate that a 12-week treatment with exenatide alone, compared with placebo, improvesβ-cell function but not glucose tolerance or insulin sensitivity in pre-diabetic canines fed a HFD. Improvement ofβ-cell function did not translate in lower fasting glycemia or reduced glycated hemoglobin A1c concentration. These results indicate only partial beneficial metabolic effects of exenatide alone on pre-diabetes.
Numerous studies have explored the therapeutical effect of exenatide in type 2 diabetes [3]. However, a few studies have explored the effect of exenatide on glucose homeostasis on diabetes. Exenatide has been shown to improve glucose homeostasis in individuals with pre-diabetes in combination with lifestyle changes or other antidiabetic drugs [8–10]. However, whether the beneficial effects of chronic exenatide treatment on pre-diabetes are mainly due to exenatideper sehave remained unclear. In fact, no previous study has specifically explored the effect of exenatide alone on glucose tolerance,β-cell function, and insulin sensitivity in the pre-diabetes state, using well accepted methods, under controlled conditions. In the present study, we used a canine model of pre-diabetes, characterized by impaired glucose tolerance as evi-denced by a ~20% increase in plasma glucose at minute 120 during OGTT and a reduction in
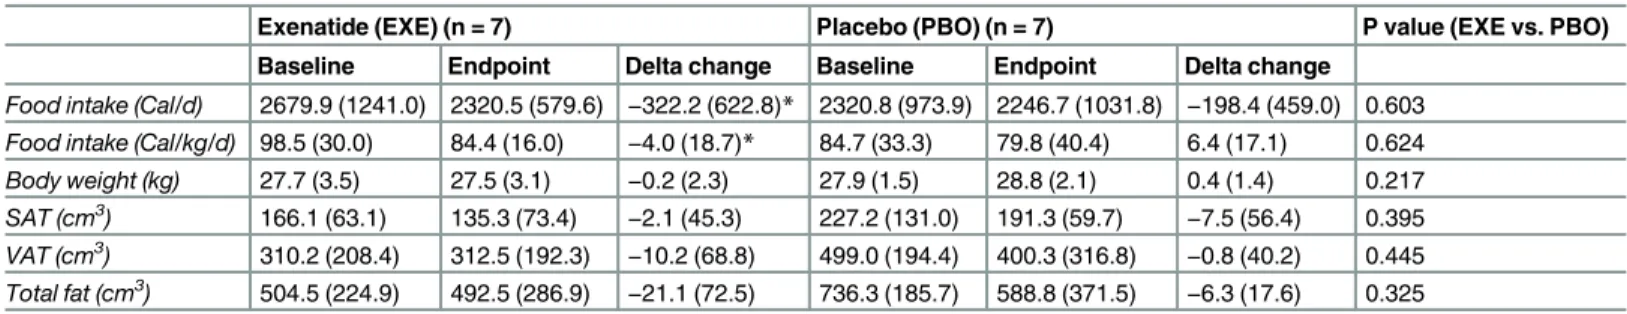
Table 3. Changes in food intake and body composition after exenatide treatment for 12 weeks in pre-diabetic canines.
Exenatide (EXE) (n = 7) Placebo (PBO) (n = 7) P value (EXE vs. PBO)
Baseline Endpoint Delta change Baseline Endpoint Delta change
Food intake (Cal/d) 2679.9 (1241.0) 2320.5 (579.6) −322.2 (622.8)* 2320.8 (973.9) 2246.7 (1031.8) −198.4 (459.0) 0.603
Food intake (Cal/kg/d) 98.5 (30.0) 84.4 (16.0) −4.0 (18.7)* 84.7 (33.3) 79.8 (40.4) 6.4 (17.1) 0.624
Body weight (kg) 27.7 (3.5) 27.5 (3.1) −0.2 (2.3) 27.9 (1.5) 28.8 (2.1) 0.4 (1.4) 0.217
SAT (cm3) 166.1 (63.1) 135.3 (73.4) −2.1 (45.3) 227.2 (131.0) 191.3 (59.7) −7.5 (56.4) 0.395
VAT (cm3) 310.2 (208.4) 312.5 (192.3) −10.2 (68.8) 499.0 (194.4) 400.3 (316.8) −0.8 (40.2) 0.445
Total fat (cm3) 504.5 (224.9) 492.5 (286.9)
−21.1 (72.5) 736.3 (185.7) 588.8 (371.5) −6.3 (17.6) 0.325
Values are medians (interquartile range). Delta change columns represent changes from baseline in each group. VAT: visceral adipose tissue; SAT: subcutaneous adipose tissue.
*P<0.05, Wilcoxon matched-pairs signed-rank test. P values between groups were determined by Quade’s test, adjusting for baseline differences.
KGby ~50%. In addition, our pre-diabetic canines showed mild impaired fasting glucose, as evidenced by a ~3% increase in fasting glycemia.
Chronic exenatide treatment, compared with placebo, caused a reduction in body weight while animals where maintained on a HFD. These results are consistent with previous findings in individuals with impaired fasting glucose or impaired glucose tolerance [8–10]. However, we found no beneficial effect of exenatide on abdominal fat mass. Exenatide alone given for 12 weeks has been shown to promote weight loss in obese individuals by reducing appetite rather than increasing energy expenditure [22]. We did not find changes in food intake or resting metabolic rate in pre-diabetic canines. Thus, the mechanisms by which chronic treatment with exenatide induced weight loss in the pre-diabetic canines remain elusive, though physical activ-ity or energy expenditure were not measured, also plausible mechanisms for weight loss.
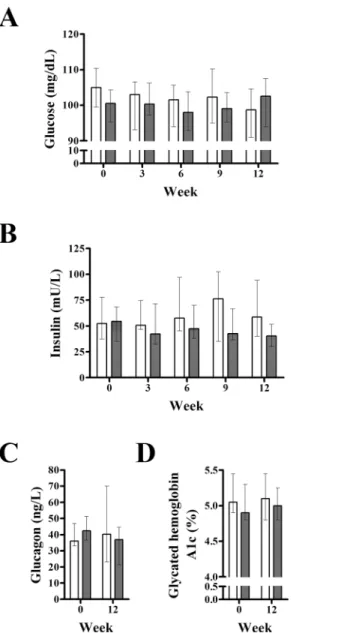
Fig 2. Effect of exenatide on fasting plasma glucose, insulin, glucagon, and glycated hemoglobin A1c.Compared to placebo (n = 7), exenatide (n = 7) did not alter fasting plasma glucose (A), insulin (B), glucagon (C) or glycated hemoglobin A1c (D) in pre-diabetic canines. Gray and white columns indicate exenatide and placebo groups, respectively. Top of columns are medians. Bars are upper and lower quartiles. In the placebo group, glucagon and hemoglobin A1c data were available only in 6 dogs.
Nevertheless, exenatide alone appears to cause a very modest body weight loss in individuals with pre-diabetes [10], and in individuals with severe obesity [22], which is consistent with our findings (Fig 1B). Exenatide combined with diet and physical exercise may well have a stronger effect in reducing body weight in individuals with pre-diabetes [8].
We did not find changes in plasma fasting glucose or glycated hemoglobin A1c, which is consistent with findings from large clinical studies with exenatide in pre-diabetic individuals [8,10]. In individuals with type 2 diabetes, a significant but small decrease in glycated
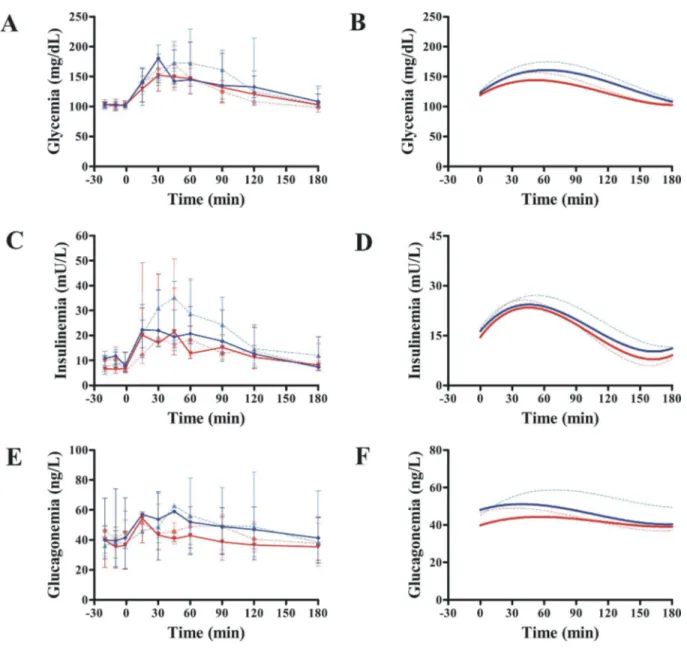
Fig 3. Effect of exenatide on oral glucose tolerance.Compared with placebo (n = 7), exenatide (n = 7) was not different in modifying AUCGLUCOSE(A and B), AUCINSULIN(C and D) or AUCGLUCAGON(E and F). Continuous red and blue lines indicate exenatide and placebo groups, respectively, after 12 weeks. Dash red and blue lines indicate exenatide and placebo groups, respectively, at baseline (week 0). B, D, and F show the nonlinear fits (polynomial of third order) for curves represented in A, C, and E, respectively. Plots are medians. Bars are upper and lower quartiles. Glucagon data were available only in 6 dogs.
hemoglobin A1c has been reported after exenatide treatment concomitant with metformin (−0.4%) for 102–113 weeks [23] or with sulfonylurea (−0.8%) over a period of 30 weeks [24].
We found an improvement ofβ-cell function during OGTT (independent of body weight) but not during the IVGTT after exenatide treatment. These differences could be related, at least
Table 4. Changes in metabolic parameters after exenatide treatment for 12 weeks in pre-diabetic canines.
Exenatide (EXE) (n = 7)
Placebo (PBO) (n = 7)
P value (EXE vs. PBO
Baseline Endpoint Delta change Baseline Endpoint Delta change
OGTT
Glucose 60 min (mg•dL-1) 147.0 (26.9) 146.6 (52.2) −17.3 (35.2) 172.2 (107.7) 144.9 (73.7) −6.6 (42.1) 0.956
Glucose 120 min (mg•dL-1) 107.5 (57.8) 120.7 (5.0) 13.6 (63.4) 125.4 (110.8) 132.5 (36.7)
−11.3 (74.7) 0.298
AUCGLUCOSE(mg•dL-1•min-1) 5337.0 (4225.0) 4367.0
(3623.0) − 1815.0 (5068.0) 6617.0 (11311.0) 7523.0 (6729.0) 92.(6186.0) 0.063
AUCINSULIN(mU•L-1•min-1) 1139.0 (2047.3) 1517.0 (1994.0)
−39.8 (994.3) 2075.0 (980.0) 1377.0
(1507.3)
−576.9
(1540.4)
0.133
AUCGLUCAGON(ng•L-1•min-1) 0.17 (0.20) 0.39 (1.41) 0.36 (0.96) 0.25 (0.35)* 0.44 (0.37)* 0.02 (0.70) 0.618 Insulinogenic index (mU•L-1•min-1)/
(mg•dl-1•min-1) 0.20 (0.51) 0.40 (0.74) 0.18 (0.32) 0.29 (0.31) 0.18 (0.11) −0.05 (0.18) 0.040
IVGTT
KG(%•min-1) 1.5 (0.5) 1.5 (0.9) 0.3 (0.8) 1.6 (0.4) 2.5 (1.7) 0.9 (2.0) 0.377 AIRG(mU•L-1•min) 158.7 (280.3) 278.4 (200.7) −25.0 (175.2) 183.5 (104.4) 209.9 (154.7) 24.9 (87.4) 0.266
SI(mU-1•L-1•min-1) 4.3 (2.4) 5.2 (2.7) 0.7 (2.4) 5.2 (3.4) 3.3 (5.0) −0.5 (4.2) 0.274
DI 1058.7 (574.3) 1094.7
(597.7)
106.2 (441.4) 946.7 (1002.8) 840.8 (858.6) 77.2 (398.6) 0.521
SG(%•min-1) 2.4 (0.8) 3.0 (1.1) 0.5 (0.4)† 2.9 (0.8) 3.3 (1.6) 0.2 (1.4) 0.297 MCR(mL•min-1•kg-1) 8.5 (5.4) 11.8 (3.1) 0.5 (4.9) 10.1 (2.4) 8.7 (1.7)
−1.4 (3.5) 0.116
FCR(min-1) 0.47 (0.20) 0.40 (0.07)
−0.09 (0.20) 0.47 (0.10) 0.42 (0.24) −0.15 (0.31) 0.851
Graded-Hyperglycemic clamp
Insulin/Glucose slope (mU•L-1)/
(mg•dl-1) 20.5 (29.5) 25.5 (17.3) −6.9 (21.7) 22.5 (13.9) 23.1 (13.9) 0.6 (8.7) 0.498 AUCGLUCOSE(baseline-200
mg•dL-1) 11894.0 (5430.0) 11592.0(2312.0) (3075.0)−365.0 11716.0(1988.0) 10450.0(1656.0) −(2970.0)1019.0 0.335 AUCINSULIN(baseline-200 mg•dL-1) 2296.0 (1949.0) 2663.0
(2150.0) −
73.0 (849.0) 2407.0 (2352.0) 1839.0 (2059.0)
27.0 (1981.0) 0.586
Insulinogenic index (baseline-200
mg•dL-1) 0.16 (0.29) 0.22 (0.28) −0.00 (0.19) 0.21 (0.28) 0.18 (0.22) 0.02 (0.20) 0.534 AUCGLUCOSE(100–150 mg•dL-1) 1143.0 (327.5) 822.8 (428.4) −177.6
(755.9)
854.1 (387.6) 1103.0 (601.4)
72.0 (531.3) 0.381
AUCINSULIN(100–150 mg•dL-1) 365.1 (178.5) 294.3 (505.8) −28.2 (317.1) 272.8 (672.6) 212.3 (261.5) −56.9 (184.1) 0.567
Insulinogenic index (100–150
mg•dL-1) 0.30 (0.15) 0.41 (0.48) 0.11 (0.25)
† 0.32 (0.61) 0.19 (0.19) −0.05 (0.19) 0.016
Energy expenditure
Resting metabolic rate (Cal/kg/d) 42.2 (9.0) 40.0 (16.3) −3.9 (9.7) 49.0 (13.2) 48.2 (7.6) −1.0 (13.5) 0.667
Energy from carbohydrate oxidation (%)
25.1 (29.8) 43.2 (14.9) 17.0 (27.1)† 38.6 (37.8) 45.5 (41.1) 9.0 (62.7) 0.867
Values are medians (interquartile range). Delta change columns represent changes from baseline in each group. *Data available only for 6 dogs.
†P<0.05, Wilcoxon matched-pairs signed-rank test.
AIRG, acute insulin response to glucose; AUC, area under the curve;DI, disposition index;FCR, fractional clearance rate of insulin; IVGTT, intravenous
glucose tolerance test;KG, intravenous glucose tolerance;MCR, metabolic clearance rate of insulin; OGTT, oral glucose tolerance test;SI, insulin sensitivity; SG, glucose effectiveness.
in part, to exenatide’s incretin effect [25]. This finding is consistent with those from clinical studies conducted in pre-diabetic [9] and diabetic individuals [26]. However, we also found an improvement ofβ-cell function assessed by the hyperglycemic clamp at more moderated intra-venous glucose incursions (up to 150 mg/dL). This might suggest an incretin-independent effect of exenatide on theβ-cells or reduced insulin clearance. However, the latter possibility is unlikely since we did not detect changes inMCRorFCR.
It is surprising that improvement ofβ-cell function by exenatide did not translate in an improvement in glucose tolerance. Previous studies have shown improved glucose tolerance with exenatide in pre-diabetic individuals [8,9]; however, it is not clear in the latter studies if the beneficial effect on glucose tolerance was due to exenatideper seor due to the effect of life-style intervention (diet and exercise) [8] or the combination with pioglitazone and metformin [9]. It is possible that improvements in insulin sensitivity are necessary to observe substantial improvement in glucose tolerance. However, insulin resistance andβ-cell dysfunction, inde-pendently, appears to be predictive of glucose intolerance in humans [27].
We did not observe changes in insulin sensitivity, arguing the findings from a previous clini-cal study in pre-diabetic patients [9]; however, in the latter study exenatide was given in combi-nation with pioglitazone and metformin, the former drug known to be an insulin sensitizer [28]. Individuals with new onset type 2 diabetes receiving exenatide for 24 weeks improved insulin sensitivity, while following a diet and exercise regimen [29]. Positive effect in canines [30] or no effect in humans [31] on insulin sensitivity have been reported after acute adminis-tration of exenatide. Rodent studies have shown a beneficial effect of exenatide on insulin
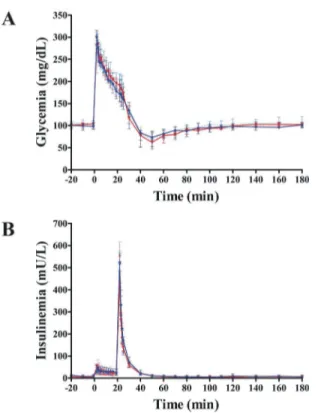
Fig 4. Effect of exenatide on intravenous glucose tolerance.Glucose (A) and insulin (B) profiles are identical in exenatide (n = 7) and placebo groups (n = 7). Continuous red and blue lines indicate exenatide and placebo groups, respectively, after 12 weeks. Dash red and blue lines indicate exenatide and placebo groups, respectively, at baseline (week 0).
sensitivity at very high concentrations after 6–10 weeks [32,33].In vitrostudies also show con-tradictory results [34,35]. It is unclear whether the conflicting results are due to differences in exenatide dose, duration of treatment, health conditions of study participants or species-related differences. Thus, the possible beneficial effect of exenatide on insulin sensitivity remains
Fig 5. Effect of exenatide onβ-cell function during graded-hyperglycemic clamp.After 12 weeks, compared with placebo (n = 7), exenatide (n = 7) was not different in modifying the area under the curve of glucose (AUCGLUCOSE) (A and B) or AUCINSULIN(C and D) during the whole test. In E and F,β-cell function is expressed as the insulinogenic index: the ratio of AUCINSULINto AUCGLUCOSE. Clamp at very high glucose concentrations does not discriminate the stimulatory effect of exenatide onβ-cell function, as compared with placebo (E). In contrast, clamp period at more physiological glucose concentrations (F) shows a significant increase inβ-cell function as compared with placebo (P = 0.016, Quade’s test). In A-D, continuous red and blue lines indicate exenatide and placebo groups, respectively. Dash red and blue lines indicate exenatide and placebo groups, respectively, at baseline (week 0). B and D show the nonlinear fits (polynomial of third order) for curves represented in A and C, respectively. In E and F, gray and white columns indicate exenatide and placebo groups, respectively. Columns are medians. Bars are upper and lower quartiles.
controversial. It should be noted that HFD did not decrease insulin sensitivity in our pre-dia-betic canines, possibly explained by a reduced anabolic effect of insulin post-STZ, potentially preventing further improvement of insulin sensitivity by exenatide.
Exendin-4 has a direct insulinotropic effect in rat islets [36,37], mouse insulinoma cells [37], and islets from type 2 diabetic subjects [38]. Isolated human islets cultured in presence of exenatide for 48 h also showed increased insulin secretion [39,40]. However, the effect of chronically administered exenatide on isolated islets has not previously been explored in a model of pre-diabetes. Activation of the glucagon-like peptide 1 receptor may also promoteβ -cell proliferation and preventβ-cell apoptosis, particularly in rodents [41,42], whereas those effects may not necessarily translate to humans [42,43]. Since we did not assessβ-cell mass, we cannot prove or disprove a possible contribution of increasedβ-cell mass to explain the increased in vitro insulin secretion in the present study. However, supporting a potential con-tribution of increasedβ-cell mass is the fact that we did not find differences in glucose-stimu-lated insulin secretion in vitro when data were normalized to basal insulin secretion. Since the in vitro insulinotropic effect of exenatide appears to be transient while exenatide is present in the media [40,44], the increased insulin secretion in vitro in our study does not appear to be explained by an acute effect of exenatide since islets were tested 18–24 h after isolation in the absence of exenatide in vitro. Nevertheless, the argument in favor of increasedβ-cell mass after chronic exenatide treatment in canines is purely speculative.
The present study has strengths. No previous study has specifically explored the chronic effect of exenatide alone on glucose tolerance,β-cell function, and insulin sensitivity in an
Fig 6. Effect of chronic systemic treatment with exenatide onβ-cell function assessedin vitro. Compared with placebo, 12-week systemic treatment with exenatide improved total insulin secretion in isolated pancreatic islets from pre-diabetic canines (A) (P = 0.041, mixed model). Each glucose concentration was tested in different islet batches (exenatide: n = 5; placebo: n = 4; three-replicate experiments) (A). Note that the differences in insulin secretion between groups disappeared when insulin secretion was normalized to basal insulin (P = 0.523, mixed model) (B). Gray and white columns indicate exenatide and placebo groups, respectively. Top of columns are medians. Bars are upper and lower quartiles.
animal model of pre-diabetes. Chronic exenatide therapy in combination with lifestyle has been reported to have beneficial effects on pre-diabetes [8–10]. However, whether these effects are mainly due to exenatideper seor lifestyle changes have remained unclear. In the present study we demonstrated that chronic exenatide treatment alone improvesβ-cell function but not glucose tolerance or insulin sensitivity. Strength of the present study is that we used a rela-tively homogenous population of animals with a pre-diabetic state induced ~5 weeks prior to the commencement of the exenatide treatment. Previous studies [8–10] have explored exena-tide’s effects on glucose homeostasis in individuals with pre-diabetes of variable duration.
Our findings should be interpreted according to the limitations of the study. Our experiments were performed in a small number of animals. Unlike the frequent association of insulin resis-tance with impaired glucose tolerance in humans [45], our canine model of pre-diabetes did not develop insulin resistance, even while animals were fed a HFD. In addition, our canine model of pre-diabetes was very mild, therefore, diagnostic criteria for human pre-diabetes [46] cannot be applied. However, although small, we induced a significant increase in fasting glycemia and gly-cemia 120 min post-OGTT (Table 2), and a marked decrease in intravenous glucose tolerance or
KG[47]. Another limitation is the relatively short duration of exenatide treatment (12 weeks). It
is uncertain whether a more prolonged exenatide treatment in pre-diabetic canines would have resulted in normalization of glucose intolerance and fasting hyperglycemia.
Because we used STZ, it can be argued that our model of diabetes may resemble a pre-diabetic model of type 1 diabetes, rather than a pre-pre-diabetic model of type 2 diabetes. However, we administered a single low dose of STZ (18.5 mg/kg), much lower than the high total STZ dose used in rodents to induce type 1 diabetes (typically ranging from 150–200 mg/kg [48]), aiming to partially impairβ-cell function and to induce glucose intolerance and mild hypergly-cemia. Moreover, the animals studied were fed a HFD to resemble obesity, a well-established risk factor for type 2, but not type 1, diabetes. Thus, our data put in perspective the partial ben-eficial metabolic effects of chronic exenatide treatment alone, a widely used clinical drug, in a canine model of pre-diabetes. However, clinical studies are required to determine whether exe-natide alone would be appropriate as a pre-diabetes therapy.
In conclusion, in our pre-diabetic canine model, 12-week exenatide treatment improvedβ -cell function but not glucose tolerance or insulin sensitivity. These findings demonstrate partial beneficial metabolic effects of exenatide alone on an animal model of pre-diabetes.
Acknowledgments
We thank Dr. John D. Young and Dr. Erlinda Kirkman for excellent veterinary assistance, Dr. Ari Aycock-Williams for veterinary consultation, Rita Thomas for performing all biochemical assays, and Edward Zuñiga and Edgardo Paredes for providing care to the animals used in this study.
Author Contributions
Conceived and designed the experiments: VI RNB CMK. Performed the experiments: VI OOW HJM DS MK MSI HL AVBC QW JLB. Analyzed the data: VI OOW RNB DS MK IAB. Contributed reagents/materials/analysis tools: DS. Wrote the paper: OOW VI RNB. Performed the statistical analysis: OOW. Had full access to all the data in the study and takes full responsi-bility for the integrity of the data and the accuracy of the data analysis: OOW. Helped revise the manuscript critically for important intellectual content: MK DS CMK.
References
2. Prasad-Reddy L, Isaacs D. A clinical review of GLP-1 receptor agonists: efficacy and safety in diabetes and beyond. Drugs Context. 2015; 4: 212283. doi:10.7573/dic.212283PMID:26213556
3. Tella SH, Rendell MS. Glucagon-like polypeptide agonists in type 2 diabetes mellitus: efficacy and tol-erability, a balance. Ther Adv Endocrinol Metab. 2015; 6: 109–34. doi:10.1177/2042018815580257 PMID:26137215
4. Nathan DM, Davidson MB, DeFronzo RA, Heine RJ, Henry RR, Pratley R, et al. Impaired fasting glu-cose and impaired gluglu-cose tolerance: implications for care. Diabetes Care. 2007; 30: 753–9. PMID: 17327355
5. ADA. 2. Classification and Diagnosis of Diabetes. Diabetes Care. 2015; 38: S8–S16.
6. Selph S, Dana T, Blazina I, Bougatsos C, Patel H, Chou R. Screening for type 2 diabetes mellitus: a systematic review for the U.S. Preventive Services Task Force. Ann Intern Med. 2015; 162: 765–76. doi:10.7326/M14-2221PMID:25867111
7. Colagiuri S. Epidemiology of prediabetes. Med Clin North Am. 2011; 95: 299–307, vii. doi:10.1016/j. mcna.2010.11.003PMID:21281834
8. Rosenstock J, Klaff LJ, Schwartz S, Northrup J, Holcombe JH, Wilhelm K, et al. Effects of exenatide and lifestyle modification on body weight and glucose tolerance in obese subjects with and without pre-diabetes. Diabetes Care. 2010; 33: 1173–5. doi:10.2337/dc09-1203PMID:20332357
9. Armato J, DeFronzo RA, Abdul-Ghani M, Ruby R. Successful treatment of prediabetes in clinical prac-tice: targeting insulin resistance and beta-cell dysfunction. Endocr Pract. 2012; 18: 342–50. doi:10. 4158/EP11194.ORPMID:22068250
10. Kelly AS, Bergenstal RM, Gonzalez-Campoy JM, Katz H, Bank AJ. Effects of exenatide vs. metformin on endothelial function in obese patients with pre-diabetes: a randomized trial. Cardiovasc Diabetol. 2012; 11: 64. doi:10.1186/1475-2840-11-64PMID:22681705
11. Karve A, Hayward RA. Prevalence, diagnosis, and treatment of impaired fasting glucose and impaired glucose tolerance in nondiabetic U.S. adults. Diabetes Care. 2010; 33: 2355–9. doi: 10.2337/dc09-1957PMID:20724649
12. Richey JM, Woolcott OO, Stefanovski D, Harrison LN, Zheng D, Lottati M, et al. Rimonabant prevents additional accumulation of visceral and subcutaneous fat during high-fat feeding in dogs. Am J Physiol Endocrinol Metab. 2009; 296: E1311–1318. doi:10.1152/ajpendo.90972.2008PMID:19366874 13. Ionut V, Liu H, Mooradian V, Castro AV, Kabir M, Stefanovski D, et al. Novel Canine Models of Obese
Pre-Diabetes and of Mild Type 2 Diabetes. Am J Physiol Endocrinol Metab. 2010; 298: E38–48. doi: 10.1152/ajpendo.00466.2009PMID:19843874
14. Ionut V, Castro AVB, Woolcott OO, Stefanovski D, Iyer MS, Broussard JL, et al. Hepatic portal vein denervation impairs oral glucose tolerance but not exenatide's effect on glycemia. Am J Physiol Endo-crinol Metab. 2014; 307: E644–E652. doi:10.1152/ajpendo.00244.2014PMID:25117408
15. Stefanovski D, Richey JM, Woolcott O, Lottati M, Zheng D, Harrison LN, et al. Consistency of the Dispo-sition Index in the Face of Diet Induced Insulin Resistance: Potential Role of FFA. PLoS One. 2011; 6: e18134. doi:10.1371/journal.pone.0018134PMID:21479217
16. Castro AVB, Woolcott OO, Iyer MS, Kabir M, Ionut V, Stefanovski D, et al. Increase in visceral fat per se does not induce insulin resistance in the canine model. Obesity. 2015; 23: 105–11. doi:10.1002/oby. 20906PMID:25322680
17. Ader M, Stefanovski D, Kim SP, Richey JM, Ionut V, Catalano KJ, et al. Hepatic insulin clearance is the primary determinant of insulin sensitivity in the normal dog. Obesity (Silver Spring). 2014; 22: 1238–45. 18. Woolcott OO, Richey JM, Kabir M, Chow RH, Iyer MS, Kirkman EL, et al. High-fat diet-induced insulin
resistance does not increase plasma anandamide levels or potentiate anandamide insulinotropic effect in isolated canine islets. PLoS One. 2015; 10: e0123558. doi:10.1371/journal.pone.0123558PMID: 25855974
19. Woolcott OO, Bergman RN, Richey JM, Kirkman EL, Harrison LN, Ionut V, et al. Simplified method to isolate highly pure canine pancreatic islets. Pancreas. 2012; 41: 31–38. doi:10.1097/MPA.
0b013e318221fd0ePMID:21792087
20. Woolcott OO, Gustafsson AJ, Dzabic M, Pierro C, Tedeschi P, Sandgren J, et al. Arachidonic acid is a physiological activator of the ryanodine receptor in pancreatic beta-cells. Cell Calcium. 2006; 39: 529–
537. PMID:16620964
21. Hamilton LC. Multilevel and mixed-effects modeling. In: eds. Statistics with STATA: Updated for version 10. Belmont: Brooks/Cole; 2008. pp. 387–421.
23. Gallwitz B, Guzman J, Dotta F, Guerci B, Simo R, Basson BR, et al. Exenatide twice daily versus glime-piride for prevention of glycaemic deterioration in patients with type 2 diabetes with metformin failure (EUREXA): an open-label, randomised controlled trial. Lancet. 2012; 379: 2270–8. doi:10.1016/ S0140-6736(12)60479-6PMID:22683137
24. Kendall DM, Riddle MC, Rosenstock J, Zhuang D, Kim DD, Fineman MS, et al. Effects of exenatide (exendin-4) on glycemic control over 30 weeks in patients with type 2 diabetes treated with metformin and a sulfonylurea. Diabetes Care. 2005; 28: 1083–91. PMID:15855571
25. Holst JJ. The physiology of glucagon-like peptide 1. Physiol Rev. 2007; 87: 1409–39. PMID:17928588 26. DeFronzo RA, Triplitt C, Qu Y, Lewis MS, Maggs D, Glass LC. Effects of exenatide plus rosiglitazone
on beta-cell function and insulin sensitivity in subjects with type 2 diabetes on metformin. Diabetes Care. 2010; 33: 951–7. doi:10.2337/dc09-1521PMID:20107105
27. Weyer C, Tataranni PA, Bogardus C, Pratley RE. Insulin resistance and insulin secretory dysfunction are independent predictors of worsening of glucose tolerance during each stage of type 2 diabetes development. Diabetes Care. 2001; 24: 89–94. PMID:11194248
28. Waugh J, Keating GM, Plosker GL, Easthope S, Robinson DM. Pioglitazone: a review of its use in type 2 diabetes mellitus. Drugs. 2006; 66: 85–109. PMID:16398569
29. Gastaldelli A, Brodows RG, D'Alessio D. The effect of chronic twice daily exenatide treatment on beta-cell function in new onset type 2 diabetes. Clin Endocrinol (Oxf). 2014; 80: 545–53.
30. Zheng D, Ionut V, Mooradian V, Stefanovski D, Bergman RN. Exenatide sensitizes insulin-mediated whole-body glucose disposal and promotes uptake of exogenous glucose by the liver. Diabetes. 2009; 58: 352–9. doi:10.2337/db08-0875PMID:19011168
31. Vella A, Shah P, Reed AS, Adkins AS, Basu R, Rizza RA. Lack of effect of exendin-4 and glucagon-like peptide-1-(7,36)-amide on insulin action in non-diabetic humans. Diabetologia. 2002; 45: 1410–5. PMID:12378382
32. Gedulin BR, Nikoulina SE, Smith PA, Gedulin G, Nielsen LL, Baron AD, et al. Exenatide (exendin-4) improves insulin sensitivity and {beta}-cell mass in insulin-resistant obese fa/fa Zucker rats independent of glycemia and body weight. Endocrinology. 2005; 146: 2069–76. PMID:15618356
33. Lotfy M, Singh J, Rashed H, Tariq S, Zilahi E, Adeghate E. Mechanism of the beneficial and protective effects of exenatide in diabetic rats. J Endocrinol. 2014; 220: 291–304. doi:10.1530/JOE-13-0426 PMID:24353307
34. Wang L, Guo F, Wei S, Zhao R. Divergent effects of GLP-1 analogs exendin-4 and exendin-9 on the expression of myosin heavy chain isoforms in C2C12 myotubes. Peptides. 2011; 32: 1313–9. doi:10. 1016/j.peptides.2011.03.018PMID:21453734
35. Idris I, Patiag D, Gray S, Donnelly R. Exendin-4 increases insulin sensitivity via a PI-3-kinase-depen-dent mechanism: contrasting effects of GLP-1. Biochem Pharmacol. 2002; 63: 993–6. PMID: 11911852
36. Parkes DG, Pittner R, Jodka C, Smith P, Young A. Insulinotropic actions of exendin-4 and glucagon-like peptide-1 in vivo and in vitro. Metabolism. 2001; 50: 583–9. PMID:11319721
37. Goke R, Fehmann HC, Linn T, Schmidt H, Krause M, Eng J, et al. Exendin-4 is a high potency agonist and truncated exendin-(9–39)-amide an antagonist at the glucagon-like peptide 1-(7–36)-amide recep-tor of insulin-secreting beta-cells. J Biol Chem. 1993; 268: 19650–5. PMID:8396143
38. Lupi R, Mancarella R, Del Guerra S, Bugliani M, Del Prato S, Boggi U, et al. Effects of exendin-4 on islets from type 2 diabetes patients. Diabetes Obes Metab. 2008; 10: 515–9. doi:10.1111/j.1463-1326. 2007.00838.xPMID:18201204
39. Park YJ, Ao Z, Kieffer TJ, Chen H, Safikhan N, Thompson DM, et al. The glucagon-like peptide-1 recep-tor agonist exenatide resrecep-tores impaired pro-islet amyloid polypeptide processing in cultured human islets: implications in type 2 diabetes and islet transplantation. Diabetologia. 2013; 56: 508–19. doi:10. 1007/s00125-012-2802-zPMID:23262664
40. Cechin SR, Perez-Alvarez I, Fenjves E, Molano RD, Pileggi A, Berggren P-O, et al. Anti-Inflammatory Properties of Exenatide in Human Pancreatic Islets. Cell Transplantation. 2012; 21: 633–648. doi:10. 3727/096368911X576027PMID:21669040
41. Kim W, Egan JM. The role of incretins in glucose homeostasis and diabetes treatment. Pharmacol Rev. 2008; 60: 470–512. doi:10.1124/pr.108.000604PMID:19074620
42. Garber AJ. Incretin effects on beta-cell function, replication, and mass: the human perspective. Diabe-tes Care. 2011; 34 Suppl 2: S258–63. doi:10.2337/dc11-s230PMID:21525465
44. Bentsi-Barnes K, Doyle ME, Abad D, Kandeel F, Al-Abdullah I. Detailed protocol for evaluation of dynamic perifusion of human islets to assess beta-cell function. Islets. 2011; 3: 284–90. PMID: 21811103
45. Abdul-Ghani MA, DeFronzo RA. Pathophysiology of prediabetes. Curr Diab Rep. 2009; 9: 193–9. PMID:19490820
46. ADA. Classification and Diagnosis of Diabetes. Diabetes Care. 2016; 39: S13–S22.
47. Bergman RN, Phillips LS, Cobelli C. Physiologic evaluation of factors controlling glucose tolerance in man: measurement of insulin sensitivity and beta-cell glucose sensitivity from the response to intrave-nous glucose. J Clin Invest. 1981; 68: 1456–67. PMID:7033284