Molecular Predictors of Long-Term Survival in
Glioblastoma Multiforme Patients
Jie Lu1
*, Matthew C. Cowperthwaite1,2, Mark G. Burnett1, Max Shpak1,2,3
1NeuroTexas Institute Research Foundation, St. David’s Healthcare, Austin, Texas, United States of America,2Center for Systems and Synthetic Biology, University of Texas, Austin, Texas, United States of America,3Fresh Pond Research Institute, Cambridge, Massachusetts, United States of America
Abstract
Glioblastoma multiforme (GBM) is the most common and aggressive adult primary brain cancer, with<10% of patients surviving for more than 3 years. Demographic and clinical
fac-tors (e.g. age) and individual molecular biomarkers have been associated with prolonged survival in GBM patients. However, comprehensive systems-level analyses of molecular profiles associated with long-term survival (LTS) in GBM patients are still lacking. We pres-ent an integrative study of molecular data and clinical variables in these long-term survivors (LTSs, patients surviving>3 years) to identify biomarkers associated with prolonged
sur-vival, and to assess the possible similarity of molecular characteristics between LGG and LTS GBM. We analyzed the relationship between multivariable molecular data and LTS in GBM patients from the Cancer Genome Atlas (TCGA), including germline and somatic point mutation, gene expression, DNA methylation, copy number variation (CNV) and microRNA (miRNA) expression using logistic regression models. The molecular relation-ship between GBM LTS and LGG tumors was examined through cluster analysis. We iden-tified 13, 94, 43, 29, and 1 significant predictors of LTS using Lasso logistic regression from the somatic point mutation, gene expression, DNA methylation, CNV, and miRNA expres-sion data sets, respectively. Individually, DNA methylation provided the best prediction per-formance (AUC = 0.84). Combining multiple classes of molecular data into joint regression models did not improve prediction accuracy, but did identify additional genes that were not significantly predictive in individual models. PCA and clustering analyses showed that GBM LTS typically had gene expression profiles similar to non-LTS GBM. Furthermore, cluster analysis did not identify a close affinity between LTS GBM and LGG, nor did we find a signif-icant association between LTS and secondary GBM. The absence of unique LTS profiles and the lack of similarity between LTS GBM and LGG, indicates that there are multiple genetic and epigenetic pathways to LTS in GBM patients.
a11111
OPEN ACCESS
Citation:Lu J, Cowperthwaite MC, Burnett MG, Shpak M (2016) Molecular Predictors of Long-Term Survival in Glioblastoma Multiforme Patients. PLoS ONE 11(4): e0154313. doi:10.1371/journal. pone.0154313
Editor:Michael Scheurer, Baylor College of Medicine, UNITED STATES
Received:November 27, 2015
Accepted:April 12, 2016
Published:April 28, 2016
Copyright:© 2016 Lu et al. This is an open access article distributed under the terms of theCreative Commons Attribution License, which permits unrestricted use, distribution, and reproduction in any medium, provided the original author and source are credited.
Data Availability Statement:All relevant data are within the paper and its Supporting Information files.
Funding:Support was provided by St. David’s Foundation Impact Fund.
Competing Interests:The authors have declared
that no competing interests exist.
Introduction
Glioblastoma multiforme (GBM) is the most frequent malignant form of primary brain cancer in adults. The median survival time for GBM patients is approximately 14 months with inten-sive multimodal therapy that includes surgical resection, chemotherapy, and radiotherapy [1] after initial diagnosis. GBM can develop bothde novoor via progression from primary low grade glioma (LGG). A small proportion of patients survive for exceptionally long periods of time; for example, fewer than 10% of GBM patients survive more than 3 years [2–4]. Therefore, studying the clinical and molecular characteristics of these rare instances of long-term survival (LTS) among GBM patients may provide insights into both the molecular basis of GBM pro-gression and identify potential new prognostic biomarkers.
Several patient characteristics like age, performance status and tumor localization have been identified as predictors of survival time [4–7]. However, many studies have often attributed the causes of LTS in GBM to erroneous histopathological diagnosis (i.e. misidentification of low-grade gliomas as GBM) or as statistical anomalies [8–10]. With advances in microarray and sequencing technologies, associations of molecular markers such as mutations, gene expression levels, DNA methylation states, and microRNAs with LTS tumors have been reported [2,3,
11–21]. Using these techniques,MGMThypermethylation and mutations in isocitrate dehy-drogenase (IDH1) have been the most frequently identified genomic marker of improved patient response to chemotherapy and therefore longer patient survival [12,22,23]. Unfortu-nately, many of these studies have only independently considered a single class of molecular marker, so that integrative studies of multiple types of molecular marks specifically associated with LTS are still lacking. In [21], the transcriptional profiles of 7 LTS patients were compared to non-LTS, their study found no association between LTS and transcriptional subtype. The analysis in [21] was qualitative; there have been no model-based analyses integrating different classes of genomic data to systematically determine whether LTS cases simply represent extreme outliers of a distribution defined by what is effectively a single pathology, or, alterna-tively, if they represent a biologically distinct class of GBMs with unique genomic, epigenetic, and phenotypic characteristics. Similarly, other analyses (e.g. [24]) have identified correlations between genomic alterations and GBM patient survival times, the analysis and markers were not specific to LTS patients.
If LTS cases do have unique molecular characteristics among GBMs, there is also the poten-tial for similarity between LTS GBM and LGG at the molecular level. There are two reasons to seriously investigate the hypothesis that LTS GBMs share molecular profiles with LGG. First, it is often suggested that many LTS GBMs are misdiagnosed instances of LGG. Second, the best-known genomic predictors of improved responses to temozolomide (TMZ) chemotherapy are mutations inIDH1and methylation of theMGMTpromoter, which are themselves frequently associated with secondary GBM (those that have progressed from LGG, as opposed tode novo
GBM [25]). These and similar observations suggest that secondary GBMs may retain addi-tional genomic traits and have clinical features that are more typical of LGG. We will determine whether this is indeed the case, and whether these secondary GBMs are also significantly char-acterized by LTS.
similarity of LTS tumor genetic profiles to LGG. The results of our analyses have important implications for our understanding of the molecular pathology of GBM, as well as providing insight into the design of novel prognostic and therapeutics indicators.
Material and Methods
Classification of LTS Phenotypes
Clinical and demographic data describing patient age at initial diagnosis, gender, ethnicity/ race, treatment history, vital status and follow-up/survival times were collected from TCGA [26] (Table 1). We used Kaplan-Meier survival analysis to build survival curves and identify LTS patients. In keeping with criteria for LTS used in the clinical literature (e.g. [2–4]), we used a three-year threshold survival time, regardless of vital status, in order to classify patients as LTS. Actual survival times were not used in the analysis, only the binary LTS/non-LTS classifi-cation. Only patients with documented survival times of less than 3 years were considered to be non-LTS patients in our study; patients with uncertain status beyond the 3 year point were excluded. For comparison, a more stringent cutoff of 1615 days (4.5 years, defining the upper 5% survival time in TCGA’s GBM data set) was also applied as an alternative criterion to clas-sify patients as LTS and non-LTS. We also considered GBM cases with a prior history of LGG as a separate class of data, i.e. these secondary GBMs represent a set of patients who, in contrast to most GBM cases, have likely previously received chemotherapy and/or radiation therapy for the earlier cancer. Both treatment types have the potential to induce distinct genetic and epige-netic profiles.
Genomic data processing
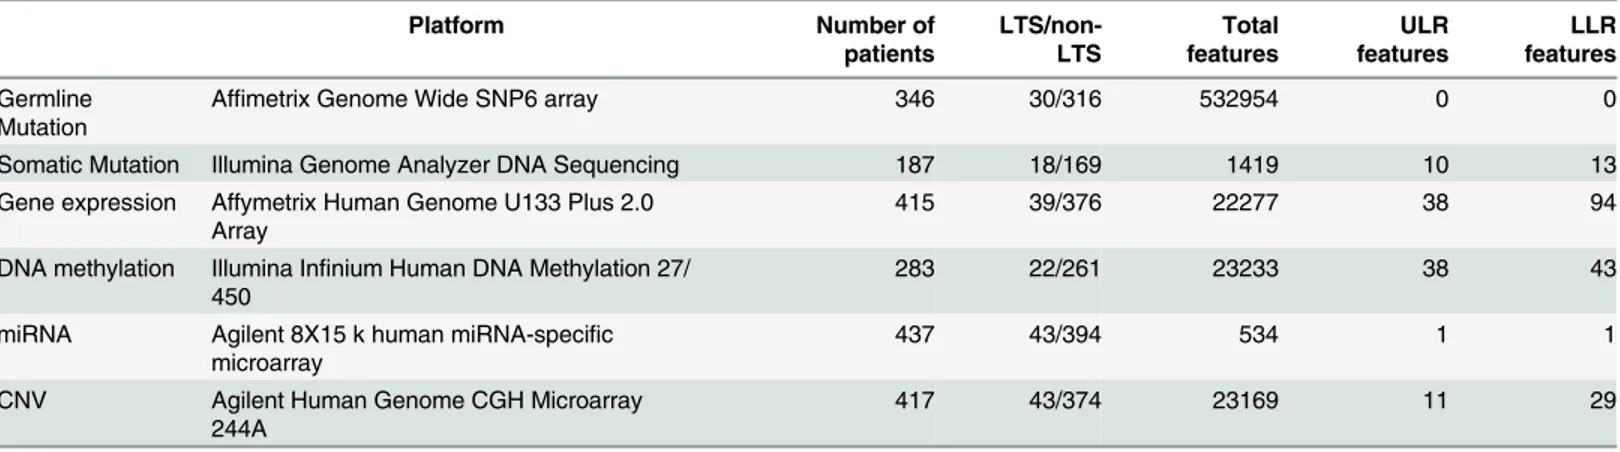
All genomic/molecular data, including exome sequences, germline mutations, probes for microarray gene expression, DNA methylation, CNV and miRNA expression were retrieved from TCGA for both GBM and LGG patients. The platforms and levels of data are summarized inTable 2. Somatic point mutations were called from the whole exome bam files using the pipeline described in [27], where SomaticSniper [28] was used to call mutations, the output was filtered for read quality with a custom Python script. Somatic point mutations were classi-fied as missense, nonsense, silent, etc. using snpEff [29]. Non-silent somatic mutations that
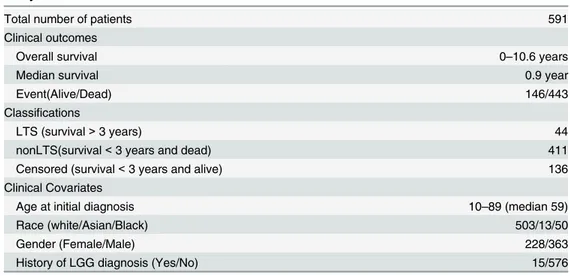
Table 1. Summary of clinical and demographical information of the TCGA patient cohort used for this study.
Total number of patients 591
Clinical outcomes
Overall survival 0–10.6 years
Median survival 0.9 year
Event(Alive/Dead) 146/443
Classifications
LTS (survival>3 years) 44
nonLTS(survival<3 years and dead) 411
Censored (survival<3 years and alive) 136
Clinical Covariates
Age at initial diagnosis 10–89 (median 59)
Race (white/Asian/Black) 503/13/50
Gender (Female/Male) 228/363
History of LGG diagnosis (Yes/No) 15/576
were identified in more than one tumor were retained as candidate predictors of survival time for subsequent inclusion in our models. Additionally, germline single nucleotide polymor-phisms (SNPs) were identified from the Level II TCGA SNP data, these were processed to exclude low quality genotype calls and rare alleles, using a pipeline described in [30].
Level 1 gene expression data were collected for GBM, LGG, and normal tissue samples from TCGA. The expression data was RMA adjusted [31] and transformed to a base-2 logarithmic scale. Level 3 DNA methylation data from two platforms (Illumina methylation arrays 27 and 450) were combined by intersecting the probe sets, excluding 10.1% of samples with more than 5% missing values. Missing values in the remaining probes were imputed using the median value across samples. The level 3 miRNA expression data was used without any further pro-cessing. For the Level 3 CNV data, a weighted average CNV score was computed if a gene spanned multiple segments of a CNV probe, with score weights proportional to the fraction of the gene spanned by each probe. Unless otherwise indicated, the data processing and all analy-ses were implemented in Python 2.7.5 and R 3.0.3.
Regression Analysis
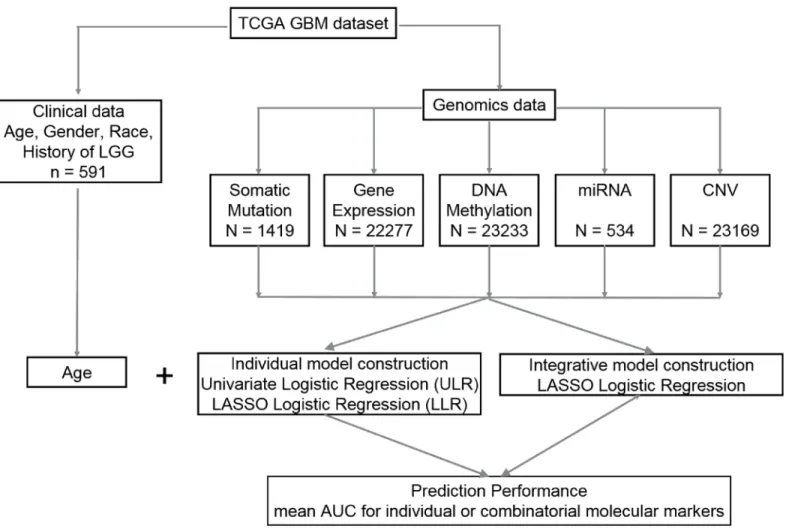
Prediction of LTS is a statistical binary classification problem. Models were individually con-structed for each molecular data type using both False Discovery Rate (FDR)—adjusted univar-iate logistic regression (ULR) and Lasso logistic regression (LLR). Integrative models that combine clinical variables with one or more types of molecular profiles were constructed using LLR. The individual and integrative model construction procedures are schematically repre-sented inFig 1.
1. Univariate logistic regression (ULR). A univariate logistic regression model was fitted for each gene or probe in every class of genomic data, with the genotype at each variant site as a predictor Y = 0,1 (non-LTS vs. LTS) withp-values adjusted using a Bonferroni correction for each class of data (in cases with limited data or where no significant associations were found following Bonferonni correction, the less stringent Benjamini-Hochberg adjustment was applied). Significantly LTS-associated features were selected with Bonferroni-adjusted
q<0.05. On tests performed on individual traits, the unadjustedp<0.05 was used for
fea-ture selection.
2. Lasso logistic regression (LLR). Least absolute shrinkage and selection operator (Lasso) is a penalized multivariable regression model whereby parameter shrinkage and feature selec-tion are done simultaneously [32]. Lasso imposes a penalty on the regression coefficients Table 2. Summary of the 6 types of molecular data and their platforms used for this study.
Platform Number of
patients
LTS/non-LTS
Total features
ULR features
LLR features
Germline Mutation
Affimetrix Genome Wide SNP6 array 346 30/316 532954 0 0
Somatic Mutation Illumina Genome Analyzer DNA Sequencing 187 18/169 1419 10 13
Gene expression Affymetrix Human Genome U133 Plus 2.0
Array 415 39/376 22277 38 94
DNA methylation Illumina Infinium Human DNA Methylation 27/
450 283 22/261 23233 38 43
miRNA Agilent 8X15 k human miRNA-specific
microarray 437 43/394 534 1 1
CNV Agilent Human Genome CGH Microarray
244A 417 43/374 23169 11 29
β= (β1,. . .,βp) by restricting the sum of the absolute values (L1 norm) of the coefficientsβj
to values no greater than the shrinkage parameterλ. By selecting an appropriateλ, a Lasso model can be tuned to include any number of variables in the final regression model; smaller values ofλwill set more coefficientsβjto zero, effectively removing them from the model. We implemented Lasso logistic regression using the‘glmnet’library in R with the binomial distribution option, reflecting the binary response variable Y.λwas selected using 10-fold cross validation so that the model minimizes cross-validation error. Predic-tion performance was evaluated with Area Under the Receiver Operating Characteristic Curve (AUC) estimation, a commonly used evaluation metric for binary classification. A perfect model will score an AUC of 1, while at the other extreme an AUC near 0.5 reflects models with no predictive power that essentially selectY= 0,1 by a random guess.
3. Integrative Models. Integrative LASSO logistic regression models were constructed by using 4 classes of molecular data in combination as predictors of LTS, i.e. clinical information, gene expression levels, DNA methylation scores, CNV counts, and miRNA expression levels were used in combination to identify subsets of molecular markers that were jointly predic-tive of LTS. To prevent overfitting, initial feature selection was performed for each class of data by selecting all variables with unadjustedp<0.05 in the ULR models; only those
genes/probes above the threshold were pooled for multiple regression analysis. We Fig 1. Flow chart with a schematic of the data analysis pipeline used in this study.
identified a core set ofn= 212 samples (including 23 LTSs) with all molecular data types represented except for point mutations. Both somatic and germline point mutations were excluded from the combined data sets because no point mutations were significant predic-tors of LTS in adjusted ULR models and their inclusion would have produced a much smaller sample set since so few tumors contained any particular somatic mutation. Conse-quently, separate regression analyses were performed with clinical information and point mutation genotypes as predictors of LTS.
A total of 69213 features representing the 4 classes of molecular data from 212 patients were jointly modeled using LASSO logistic regression. Prior to model fitting, each variable was z-transformed to zero mean and unit variance so that variables across different classes of data would be on the same scale. We also constructed regression models using specific combina-tions of data classes and excluding others (e.g. gene expression + methylation data used to pre-dict LTS while excluding CNV and miRNA data etc), as this allows us to compare prepre-dictive performance of models and to determine the marginal effects of incorporating additional data classes on LTS prediction. To evaluate the prediction performance for individual models, we performed tenfold cross-validation and computed the mean AUC over 100 iterations. In every iteration, the data set was divided into 10 subsets, and the LLR was repeated 10 times. One of the 10 subsets was used as the test set and the other 9 subsets were pooled to form a training set in order to compute the average AUC across all 100 iterations. The advantage of this method is that it minimizes the bias from the division of data into training and test sets.
Imbalanced Sampling and Bootstrapping
Because LTS account for<10% of GBM samples, logistic and LASSO regression analyses of the
entire data set by necessity use imbalanced data, which can potentially bias estimation and pre-diction in logistic regression and machine-learning models [33]. To determine the extent of artifacts introduced by imbalanced data, we performed a bootstrap analysis by downsampling with replacement the non-LTS set to equal the number of LTS samples over 100 replicates (random sampling with replacement of 90% of LTS, 10% of non-LTS). The sensitivity of regression models to downsampling is determined by computing the distributions of AUC val-ues for LLR and logistic regression coefficients for ULR, and compared to the valval-ues obtained for models computed from the imbalanced complete data.
Principal Components Analysis and Hierarchical Clustering
To explore the relationship between LTS GBM and LGG tumors, we represent each sample in a coordinate space defined by the principal components of gene expression and methylation measures. Gene expression data from the AgilentGA4502A microarrays for both GBM and LGG samples was analyzed following Loess normalization and quantile normalization to cor-rect for within and between-array bias, respectively. Significantly differentially expressed genes (DEGs) were identified as follows: a Student’s t-test with Benjamini-Hochberg FDR correction of thep-values was performed for each probe to compare mean expression levels between the sample sets. DEGs were identified as those in which the FDR adjustedq<0.01 and the median
log fold-change across probes was at least two fold (|log2FC|2).
Moran'sI, a measure of autocorrelation, was used to measure the extent to which samples from a defined subset (e.g. LTS patients) cluster together due to similar expression values [34]. This measure was applied to determine the similarity of gene expression or methylation profiles among LTS samples in the coordinate spaces defined by the first two principal components. In the context of this study, a Moran’sIvalue near 0 indicates that LTS expression levels are ran-domly dispersed among the GBM samples, a value near 1 indicates that the LTS samples are closest to one another in PC space, while a value of -1 indicates a perfectly uniform spacing of LTS and non-LTS samples in PC space (i.e. negative autocorrelation, or a tendency of LTS and non-LTS samples to“alternate”in gene expression space). The same approach was used to study DNA methylation patterns between GBM and LGG with three different gene sets: 1. All genes with methylation probes; 2. ULR selected genes; 3. LLR selected genes.
Additionally, we used unsupervised hierarchical clustering of gene expression values to compare LTS with non-LTS GBM and LGG expression profiles. In this cluster analysis, each sample is represented as a vector of expression values and classified by pairwise Pearson Corre-lation Coefficient distance.
Results
Patient cohort
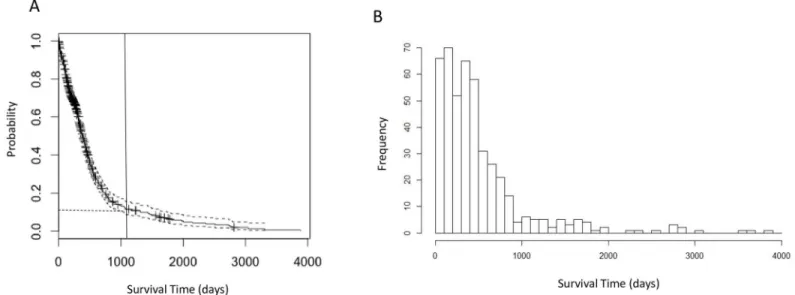
For the 591 patients in this study, the median age at initial diagnosis is 59 years; the patient cohort is 61.4% male (Table 1). We constructed a Kaplan-Meier survival curve (Fig 2A) and estimated the median survival time following initial resection to be 13.9 months (95% CI: 12.9– 14.9 months). The survival curve resembles an exponential distribution, indicating a high prob-ability of death within a short period after diagnosis and a comparatively low frequency of LTS. The distribution of survival times is essentially unimodal (Fig 2B), suggesting a homogeneous distribution, rather than a mixture of two or more distributions for LTS and the non-LTS sam-ples. This observation was confirmed by applying Hartigan’s dip test [35](p= 0.9877), a distri-bution-free test for bimodality, which suggests that survival times follow a homogeneous, unimodal distribution.
Fig 2. Survival time analyses of GBM patients.a. Kaplan-Meier plot of overall survival analysis of 591 GBM patients. The vertical line indicates the 3-year (1095 days) cutoff for LTS used in following analyses. The horizontal dashed line indicates 7.6% LTS patients corresponding to the cutoff. b. Histogram of survival time (in days) showing that the distribution of survival time is unimodal.
Among the 591 patients with known vital status and survival times, 44 (7.4%) survived lon-ger than three years—a commonly-used survival milestone for GBM patients [5,7,9,36]–and were classified as“long-term survival”(LTS) patients. Patients with shorter-than-three-year survival time were classified as non-LTS (411, 69.5%). There are a total of 29 patients surviving past the more stringent 4.5 years definition of LTS.
Regression Analyses of Clinical and Molecular Features
In a logistic regression model that included only clinical and demographical variables, younger age at initial diagnosis, Karnofsky performance score (KPS) and presence/absence of chemo-therapy were the three significant predictive factors of LTS (Table 3). While post-operative KPS scores are stronger predictors of patient outcomes than pre-operative scores [37], the TCGA data contain only 76 samples with post-operative/post-adjuvant KPS values, so that pre- and post-operative scores were pooled. In the initial LLR analyses, patient age, KPS, and chemotherapy were considered jointly with the molecular biomarkers as independent variables in multiple regression analyses. Combining KPS and chemotherapy reduces the effective sizes of gene expression and DNA methylation datasets to 277 and 194 samples (due to 28% and 14% missing data in KPS and chemotherapy, respectively), while there was no missing age data.
We evaluated the regression models with or without the inclusion of KPS and chemother-apy, and found that they converged to a set of predictors that included age but not KPS or che-motherapy (S1 Table), presumably reflecting the strong (r= -0.323,p= 1.93E-9) correlation between KPS and age, as well as the small fraction of patients (13.5%) who did not receive che-motherapy. Moreover, an identical set of predictor biomarkers and nearly identical coefficients were obtained from LLR that initially included KPS and chemotherapy as from models where only age is initially included on the same set of samples. Because of this and the reduction of sample size, age is the only clinical variable included in subsequent regression analyses.
ULR identified 10 somatic mutations as predictors of LTS with p<0.05 (none of which are
statistically significant after Bonferroni or Benjamini-Hochberg adjustment of p-values), among these are mutations in genes whose somatic variants are well-known to correlate with GBM survival time such asIDH1andPRSS1(S2 Table). LLR identified 13 somatic mutations as significant (Table 4andS3 Table). Most of the significant LLR mutations are located in
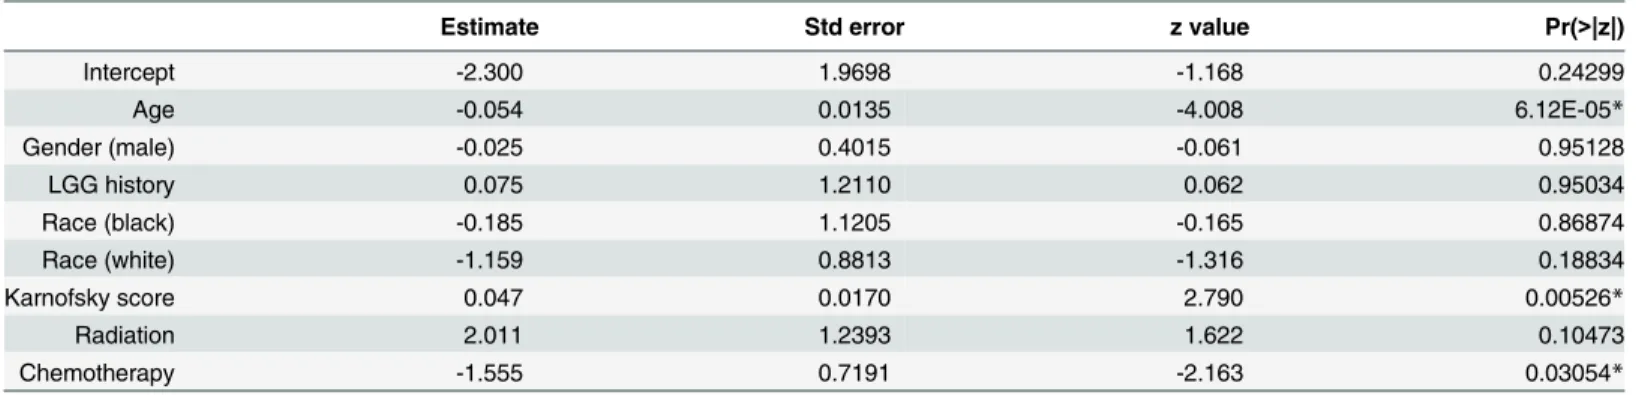
Table 3. Partial regression coefficients for logistic regression model for LTS against clinical and demographical information.
Estimate Std error z value Pr(>|z|)
Intercept -2.300 1.9698 -1.168 0.24299
Age -0.054 0.0135 -4.008 6.12E-05*
Gender (male) -0.025 0.4015 -0.061 0.95128
LGG history 0.075 1.2110 0.062 0.95034
Race (black) -0.185 1.1205 -0.165 0.86874
Race (white) -1.159 0.8813 -1.316 0.18834
Karnofsky score 0.047 0.0170 2.790 0.00526*
Radiation 2.011 1.2393 1.622 0.10473
Chemotherapy -1.555 0.7191 -2.163 0.03054*
Age at initial diagnosis, gender, ethnicity, presence/absence of prior LGG history and presence/absence of chemo and radiotherapy are used as independent variables in the model.*Independent covariates with statistically significant partial regression coefficients are indicated with‘*’(p<0.05).
“Estimate”is the coefficient associated with the variable;“Std.Error”is the standard error associated with these estimates;“Pr (>|z|)”is thep-value associated with the z-value.
different genes from those identified from ULR, except for mutations in IDH1 and the mRNA splicing gene DHX16. We note that IDH1 somatic mutations are the most significant predic-tors of LTS in both cases, with unadjusted p = 3.2E-3 in ULR andβ= 1.10 in LLR. This is con-sistent with the occurrence of non-synonymous mutations in IDH1 in 16.67% of the LTS patients versus 1.19% of the non-LTS patients in the TCGA sample set, corresponding to an odds ratio of 16.03 (p = 6.8E-3). There are 39592 germline mutations (SNPs) with unadjusted p<0.05, although none are significant under either Bonferroni or Benjamini-Hochberg
adjustments, even when the adjustment is restricted to the set of mutations in the exome. In LLR analysis, we identified 8 SNP genotypes with nonzero regression coefficients. The stron-gest associations are for mutations in theB3GALT5(a Beta-galactosyltransferase gene) gene and the TGS1 (trimethyguanosine synthase), withβ= -0.28, -0.18, respectively, indicating that the wild type genotypes at these loci are weakly predictive of LTS (AUC = 0.52, 95% CI: 0.44– 0.60,Table 5).
For the gene expression data, there are 38 significant LTS predictors with FDR-adjusted ULR (S2 Table) vs 94 with LLR (Table 4andS3 Table). Functional enrichment analysis of the 478 ULR significant predictor genes (q<0.05) found a significant enrichment in
phosphopro-teins (1.32 fold enrichment,p= 1.6E-04) and genes in acetylation pathways (1.78 fold enrich-ment,p= 4.39E-06) (S4 Table). In contrast, the 94 significant predictor genes in LLR analysis Table 4. List of significant predictor genes in LLR using single classes of molecular data.
Genes (Positive Association) Genes (Negative Association)
Germline Mutation B3GALT5,TGS1 None
Somatic Mutation IDH1 None
Gene Expression MLNR,PI15,NOS3,NEUROG1,MFI2 MST1L,CRLF2
DNA Methylation HS1BP3,CDKN1B,TMED10,PURB,
RSPO3,LETMD1,STX17
TNS4,C6orf48,SNORD48,LLGL1,
VIM,NLRP4,CXorf23
Copy Number Variation
AY289773,HPR AL713660,DUSP28
miRNA None hsa-miR-222
Only predictor genes with relative large beta are shown here (i.e. |β|>1 for somatic mutation, gene
expression, DNA methylation, CNV and miRNA; |β|>0.1 for germline mutation). For a complete list, see
S3 Table.
doi:10.1371/journal.pone.0154313.t004
Table 5. Prediction performance of individual molecular type under LLR, as measured by AUC.
Unbalanced Balanced
Type of Variable mean AUC Std mean AUC Std
Age 0.8034 0.0150 0.8070 0.0901
Germline Mutation 0.5169 0.0395 0.5490 0.0832
Somatic Mutation 0.6156 0.0354 0.6451 0.0724
Gene Expression 0.7385 0.0322 0.6665 0.0706
DNA methylation 0.8387 0.0341 0.6747 0.0962
miRNA 0.7350 0.0272 0.6577 0.0724
CNV 0.7002 0.0232 0.6785 0.0599
The last two columns are the mean and standard deviations of AUC under 100 bootstrap permutations (i.e. downsampling the ~10% of non-LTS cases and 90% of LTS so that the number of samples is equal to that in LTS).
did not identify enrichment with respect to any known KEGG pathway or structural/functional classes of genes. Among the genes whose expression levels are positively associated with LTS areNOS3(nitrous oxide synthase, a known regulator of blood pressure and other vascular function) [38] and the neurogeninNEUROG1, a transcription factor regulating growth of neu-rons [39], indicating that the upregulation of these genes is linked to a higher probability of LTS.
Among the 4 classes of genomic data, DNA methylation is the strongest predictor of LTS with the highest mean AUC (AUC = 0.84, CI: 0.78–0.90) in LLR models (Table 5), which was confirmed through 100 replicates of 10-fold cross validation. Indeed, methylation is an even stronger predictor of LTS than age (i.e. AUC = 0.80, CI: 0.77–0.830). This is the case even though there are fewer samples in the methylation data set than for gene expression, miRNA, and CNVs. We found 38 methylation probes that are significant predictors of LTS in adjusted ULR models (S2 Table) vs. 43 in the LLR model (Table 4andS3 Table). Genes with Lasso regression coefficients |β|>10 includeLETMD1, a known oncogene [35], the known tumor
suppressorCDKN1B[36], as well as several other genes whose variants have been linked with other cancers, such asRSPO3[37]. All of these genes are positively associated with LTS, indi-cating that their hypermethylation is predictive of improved patient outcomes.TNS4, whose oncogenic role has been documented for colorectal and other cancers[38], has the strongest negative association with LTS, suggesting that hypomethylation of this gene is predicts LTS (seeTable 4andS3 Tablefor a summary of genes that significantly predict LTS in LLR mod-els). We remark that there is no significant association ofMGMTpromoter region methylation with LTS in LLR models, nor is methylation of this region a significant LTS predictor in a ULR model following FDR correction. However, the association betweenMGMThypermethylation and LTS is significant in a ULR model (p= 0.036) without adjustment. There was no overlap between the set of genes that were differentially expressed between LTS and non-LTS and those that were differentially methylated.
A single microRNA was found to be significantly predictive of LTS with either the ULR or LLR analyses (Table 4,S2andS3Tables), namelyhsa-miR-222. The regression coefficient of
hsa-miR-222expression levels on LTS is -0.169, indicating that downregulation of this miRNA is associated with LTS. There are 11 and 29 significant CNV probes prediction LTS with ULR and LLR, respectively (Table 4,S2andS3Tables). The strongest association of CNVs with LTS (|β|>1) in the LLR data included the oncogeneDUSP28[40] (a negative association,
indicat-ing that deletion in this gene is predictive of LTS), as well as a positive association withHPR
CNVs (i.e. duplication at this locus is correlated with LTS). Mutations inHPRhave been docu-mented in the literature as predictors of recurrent breast cancer [41].STAM, encoding a signal transduction adapter molecule, was found to be a significant predictor in both gene expression and CNV analyses. Higher expression and amplification of this gene was associated with LTS (S3 Table), suggesting that the genomic amplification ofSTAMmight lead to the upregulation of gene expression.
Imbalanced Sampling and Bootstrapping
Integrative Model Construction
In terms of AUC, combining one or more classes of genomic data with age in an LLR does not strongly enhance prediction of LTS when compared to age alone. It can be seen inTable 6that combining age with methylation and microRNA expression data only marginally improves AUC, while AUC actually decreases when CNV counts or gene expression are combined with age, which is consistent with the relatively lower prediction performance of gene expression and CNV for individual models. The strongest improvement in prediction occurs when age is combined with the single significant miRNAhsa-miR-222, i.e. (AUC = 0.87, 95% CI: 0.83– 0.91). The same is true when multiple classes of genomic data are combined in a single regres-sion model, e.g. expresregres-sion+methylation+microRNA data combined with age give virtually identical AUC values to age alone, indicating that pooled biomarker data does not outperform individual classes of biomarkers in LTS prediction, perhaps as a consequence of increased number of features. Applying a more stringent cutoff (4.5 years) for LTS classification does not change the results qualitatively in terms of either the significant predictors or the magnitude of AUC (prediction of miRNA expression and CNV is moderately enhanced, while diminishing for gene expression data, presumably due to fewer LTSs). This indicates that the results of the regression analyses are not strongly predicated on the choice of cutoff time used to define LTS.
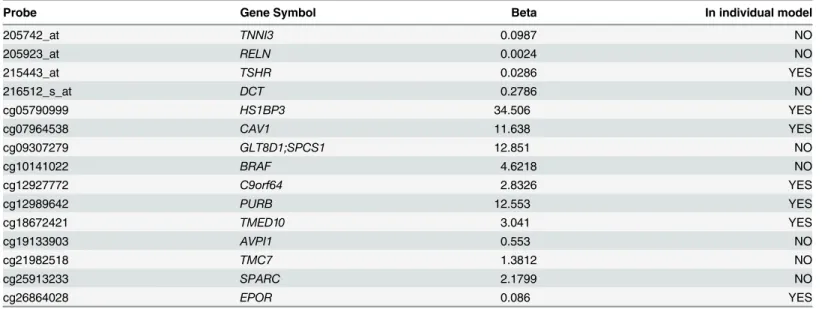
The principal value of constructing integrative LLR models lies in the fact they identify molecular markers that are jointly significant predictors of LTS which are not individually pre-dictive in ULR, nor prepre-dictive in LLR when applied to a single class of data (seeTable 7). For example, in LLR analysis of methylation probes alone, methylation of the oncogeneBRAFdoes not appear as a significant predictor, whereas in the integrative model it hasβ= 4.62. While
CAV1(caveolin 1, a plasma membrane protein and tumor suppressor gene) appears in the LLR model, itsβ= 11.34 value is much larger in the joint regression model than in LLR on methyla-tion data alone. Downregulamethyla-tion or loss of funcmethyla-tion inCAV1has previously been documented as a determinant of aggressiveness in GBM tumor growth [42].
All but one of the gene expression probes that appear in the integrative LLR model are not significant LTS predictors for LLR on expression data alone. We remark, however, that most of these expression probes are only weakly predictive of LTS in the joint model, withβ0.28 (the
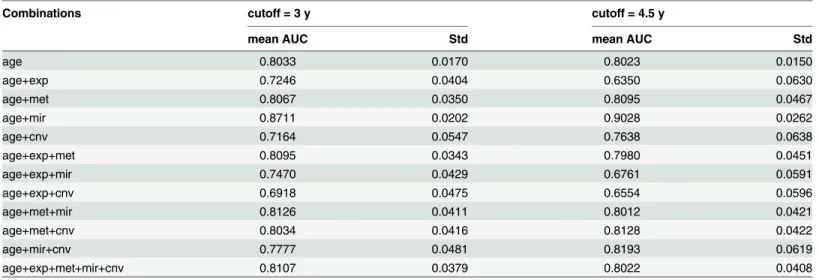
Table 6. Prediction performance (area under curve, AUC) of integrative models.
Combinations cutoff = 3 y cutoff = 4.5 y
mean AUC Std mean AUC Std
age 0.8033 0.0170 0.8023 0.0150
age+exp 0.7246 0.0404 0.6350 0.0630
age+met 0.8067 0.0350 0.8095 0.0467
age+mir 0.8711 0.0202 0.9028 0.0262
age+cnv 0.7164 0.0547 0.7638 0.0638
age+exp+met 0.8095 0.0343 0.7980 0.0451
age+exp+mir 0.7470 0.0429 0.6761 0.0591
age+exp+cnv 0.6918 0.0475 0.6554 0.0596
age+met+mir 0.8126 0.0411 0.8012 0.0421
age+met+cnv 0.8034 0.0416 0.8128 0.0422
age+mir+cnv 0.7777 0.0481 0.8193 0.0619
age+exp+met+mir+cnv 0.8107 0.0379 0.8022 0.0408
strongest association is with expression levels ofDCT, dopachrome tautomerase). This result is consistent with methylation being the strongest individual predictor of LTS in both integrative models and in models that only incorporate a single class of data.
Relationship of LTS to LGG
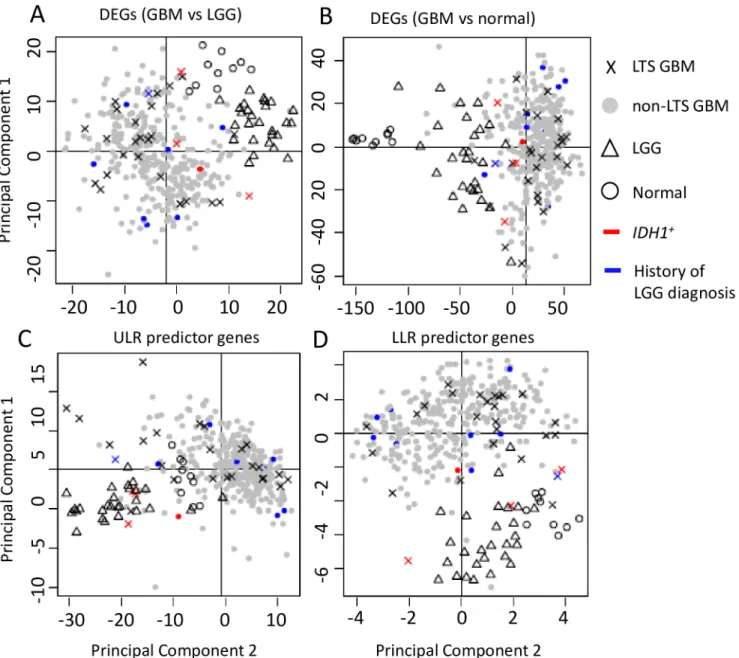
The PCA analyses reveal that the GBM, LGG, and normal samples have distinct profiles among their DEGs (Fig 3A and 3B). LGG and (all) GBM samples are distinct clusters in the PCA scatterplots (Moran’sI~0.1,p<<0.01 for LGG vs. GBM), and all LGG tumors share
common nodes in the hierarchical clustering analysis discussed below (Fig 4). In contrast, LTS samples are interspersed among the non-LTS GBM samples (Moran’sInear 0,p>0.1 in
Table 8); methylation scores (Table 9) produces qualitatively similar results. Together, these results suggest that there is no“hallmark”gene expression profile for LTS GBM, consistent with the lack of association between expression profile subtype and LTS described in [21]. These observations all indicate weak mutual similarity between expression profiles of LTS GBMs, i.e. the majority of LTS GBMs have gene expression patterns that more closely resemble non-LTS GBM than they do the profiles of other LTS patients. Not surprisingly, if we consider the gene sets that are significant predictors of LTS in ULR and LLR models, we do find separa-tion and autocorrelasepara-tion among LTS samples, the Moran’sIvalues havepeffectively 0 for genes identified ULR and LLR, respectively. This could also be seen by the greater“clumping” of LTS samples in PCA space and in the dendrograms (S1andS2Figs).
In the hierarchical clustering analysis, selecting a twofold partition generates one subtree that consists solely of GBMs and another that contains both GBM and all LGG samples (i.e. all LGG samples are defined by a single node in this subtree, as shown inFig 4). LTS samples occur in both subclusters, with a disproportionate representation of LTS tumors in the subtree containing the LGG. Specifically, 14 of the 28 LTS GBM samples occur in the subtree that also contains LGG, versus 93 of the 318 non-LTS GBM samples (OR = 1.72,p= 0). However, most of the neighbors of LTS in the dendrogram are non-LTS GBMs, even for those in the subtree that contains LGG (as in the scatterplot). The same is true of GBMs in patients who have a prior history of LGG, that is, known secondary GBMs occur throughout the dendrogram and Table 7. List of significant predictor genes in integrative LLR models, with various combinations of data classes.
Probe Gene Symbol Beta In individual model
205742_at TNNI3 0.0987 NO
205923_at RELN 0.0024 NO
215443_at TSHR 0.0286 YES
216512_s_at DCT 0.2786 NO
cg05790999 HS1BP3 34.506 YES
cg07964538 CAV1 11.638 YES
cg09307279 GLT8D1;SPCS1 12.851 NO
cg10141022 BRAF 4.6218 NO
cg12927772 C9orf64 2.8326 YES
cg12989642 PURB 12.553 YES
cg18672421 TMED10 3.041 YES
cg19133903 AVPI1 0.553 NO
cg21982518 TMC7 1.3812 NO
cg25913233 SPARC 2.1799 NO
cg26864028 EPOR 0.086 YES
show no specific association with LGG expression profiles. In fact, only a single LTS has a doc-umented prior history of LGG (corresponding to an insignificant OR = 1.04 for LTS associa-tion with LGG). From both the hierarchical clustering and PCA analyses, we conclude there is no significant association between progression from LGG and subsequent LTS in GBM.
A closer examination ofIDH1mutation status in showed that all 5IDH1+GBMs (including 3 LTSs and 2 non-LTSs) cluster with LGGs when the dendrogram was partitioned into two clusters (Fig 4, row-side color bar on the right), indicating a similarity in gene expression and methylation profiles betweenIDH1+genotypes and LGGs. However, whileIDH1+is a signifi-cant predictor of LTS, the majority of LTS cases in the TCGA data set areIDH1-wildtype. Fur-thermore, none of theIDH1+genotypes was in a GBM with a prior LGG history.
Fig 3. Scatterplot of the first two principal components of gene expression data.PCA analyses were performed on a. DEGs between GBM and LGG (N = 491 genes). b. DEGs between GBM and normal controls (N = 4801). c. ULR predictor genes (N = 94). d. LLR predictor genes (N = 38).
Most of the LTS samples are similarly interspersed with non-LTS GBM’s in the PCA scatter-plots, only a small subset of LTS samples cluster with LGGs. The lack of a strong overall LGG-like“signal”in LTS samples can be seen most clearly from the comparison of centroids for PCA 1+2 scores over the different gene sets (S5 Table), where the LTS distances to LGG were much greater than to non-LTS GBM. Indeed, except for the small subset of genetic markers that are predictive of LTS, the absence of significant autocorrelation among LTS samples fur-ther argues against LTS corresponding to a biologically unique and qualitative distinct class of GBM pathology, and against their proposed molecular affinity with LGG features.
Moreover, GBM samples from patients with prior LGG history do not cluster together in the dendrogram, nor do these known secondary GBMs cluster with LGGs, arguing against the hypothesis of that secondary GBMs retain LGG-like molecular profiles. Previous analyses of gene expression patterns have identified at least four subtypes of GBM [43–45], including sec-ondary (proneural) GBM, as well as the mesenchymal, classical and neural GBM subtypes. However, we found no significant association between LTS and the proneural subtype (based on TCGA classification of samples), the OR = 1.21,p= 0.83. This lack of association of LTS with subtype is consistent with the observation that most LTS samples do not share a common node in the dendrogram nor a specific affinity with LGG.
Fig 4. Heatmap of the gene expression levels in LTS GBM, non-LTS GBM and LGG samples (N = 383 genes).Hierarchical clustering (HC) on the expression levels of DEGs between GBM and LGG (N = 491) was used to classify the samples, with a row dendrogram (clustering of samples) based on Pearson correlation coefficient, the column dendrogram on a Spearman correlation coefficient. In the row-side color bars ofIDHstatus and LGG history, red indicatesIDH1+or history of LGG diagnosis; grey indicatesIDH1-and no history of LGG diagnosis, respectively; white indicates that no data is available for
the sample.
Similar trends are observed with the methylation data (Figs5and6,S6 Table), finding no association between LTS and LGG samples with respect to methylation scores. Furthermore, the tendency of LTS samples to co-occur in a single cluster is even weaker for the methylation profiles. The Moran’sIautocorrelation measures are statistically insignificant for LTS methyla-tion scores with respect to non-LTS GBM (Table 9), even when the LLR subset of genes are considered separately. These results were unexpected in view of the fact that methylation is a stronger predictor of LTS in LLR models than expression profiles, which is probably a conse-quence a relatively small subset of the LTS samples with very similar expression profiles (high autocorrelation) in the LLR-selected genes.
Table 8. Moran's I for each binary category (e.g. LTS vs. non-LTS).
DEGs (LGG vs GBM) Observed Expected Std pvalue
LGG vs GBM 0.2991 -0.0029 0.0055 0
LTS vs nLTS 0.0051 -0.0029 0.0053 0.1340
normal vs tumor 0.1989 -0.0026 0.0049 0
DEGs (GBM vs normal)
LGG vs GBM 0.1238 -0.0027 0.0052 0
LTS vs nLTS -0.0004 -0.0029 0.0056 0.6525
normal vs tumor 0.2980 -0.0026 0.0053 0
ULR genes
LGG vs GBM 0.2863 -0.0029 0.0066 0
LTS vs nLTS 0.0241 -0.0029 0.0060 7.84E-06
normal vs tumor 0.1057 -0.0026 0.0057 0
LLR genes
LGG vs GBM 0.1047 -0.0029 0.0068 0
LTS vs nLTS 0.0204 -0.0029 0.0068 0.0007
normal vs tumor 0.1345 -0.0026 0.0060 0
The statistics are computed over the coordinates of thefirst two principal components of gene expression.
doi:10.1371/journal.pone.0154313.t008
Table 9. Moran's I for each binary category (e.g. LTS vs. non-LTS).
All genes Observed Expected Std pvalue
LGG vs GBM 0.3951 -0.0026 0.0060 0
LTS vs nLTS 0.0027 -0.0036 0.0068 0.3513
normal vs tumor -0.0030 -0.0026 0.0005 0.4193
ULR genes
LGG vs GBM 0.3373 -0.0026 0.0059 0
LTS vs nLTS 0.0033 -0.0036 0.0071 0.3356
normal vs tumor -0.0033 -0.0026 0.0005 0.2393
LLR genes
LGG vs GBM 0.3412 -0.0026 0.0066 0
LTS vs nLTS 0.0014 -0.0036 0.0086 0.5612
normal vs tumor -0.0033 -0.0026 0.0005 0.2495
Discussion
The principal goal of this study was to determine whether LTS GBM tumors have genomic fea-tures that distinguish them from those found in patients with more typical survival times, i.e. to evaluate whether they constitute a biologically distinct subclass of high-grade gliomas with unique molecular characteristics, and to evaluate the relationship between LTS GBMs and LGGs.
In spite of the limitations on statistical power due to comparatively small samples of LTS patients and incomplete clinical data, our analyses identified molecular biomarkers that signifi-cantly predict LTS, several of which have been documented in the literature as predictors of improved response to chemotherapy and overall improved patient prognosis. For example, Fig 5. Scatterplot of the first two principal components of the DNA methylation data.PCA analyses were performed on a. All probes (N= 23233). b. ULR predictor genes (N= 38). c. LLR predictor genes (N= 43).
among the somatic point mutations, non-synonymous mutations inIDH1were the strongest predictors of LTS in ULR and LLR models (Table 4), consistent with the significantly higher proportion ofIDH1mutated patients observed in the LTS vs. non-LTS data sets. However, even the association of LTS withIDH1mutations is weak, i.e. even though most ofIDH1+
genotypes are LTS, most LTS cases areIDH1-. The low predictive performance of both somatic and germline mutations generally is in agreement with emerging clinical data suggesting that
IDH1is a only weak predictor of LTS in GBM, as survival beyond the fourth year can occur in patients withoutIDH1mutations [12,21]. Similarly, miR-222, the only differentially expressed miRNA identified as a predictor of LTS, has been previously documented in the literature [46] as predictor of GBM prognosis due to its role as a regulator of thePUMA[47], a P53 mediated regulator of apoptosis. Higher levels ofPUMAprotein are associated with increased apoptosis and, consequently, lower growth rates in GBM tumors. Upregulation ofmiR-222is linked to repression ofPUMAand higher tumor proliferation, consistent with LTS being negatively associated withmiR-222expression levels.
The scarcity of somatic mutation genotypes as predictors of LTS is largely the result of most somatic mutations occurring in few (2–3) samples in the data set. On the other hand, given the abundance of high frequency variant germline genotypes, the small number of germline muta-tion predictive of LTS is somewhat surprising, since genome wide associamuta-tion studies (GWAS) [48,49] have identified inherited SNPs that predispose individuals to GBM. None of these GWAS-identified SNPs appeared as a significant predictor in our regression models. These Fig 6. Heatmap of the DNA methylation levels in LTS GBM, non-LTS GBM and LGG samples (N = 383).Hierarchical clustering (HC) on the DNA methylation levels of GBM and LGG (N = 23233) was used to classify the samples. The row dendrogram (clustering among samples) is based on Pearson correlation coefficients and the column dendrogram on Spearman correlation coefficients. In the row-side color bars ofIDHstatus and LGG history, red indicatesIDH1+or history of LGG diagnosis; grey indicatesIDH1-or no history of LGG diagnosis; white indicates no data available for the sample.
results suggest that there are few if any inherited (familial) mutations that predict LTS in GBM patients, or that their effects are comparatively weak against the much stronger signal of varia-tion among GBM types and the contribuvaria-tion of clinical variables such as age to patient survival.
Although mutational genotypic markers for LTS are limited, we did identify gene expres-sion phenotypes, epigenetic markers, and copy number variant genotypes that are significantly predictive of LTS, with the exception of DNA methylation. The fact that DNA methylation has comparable or better predictive power than age is probably related to the coordinated reg-ulation of aging and DNA methylation patterns [50]; the same is true for regression models of LTS combining age with methylation. While previous analyses have shown that combining clinical predictors with gene expression alone best predicts survival time [25], our results found the weakest prediction when age is combined solely with gene expression data, and strongest when combined with miRNAs (in spite of the limited number of miRNAs). This dis-crepancy is potentially due to different choices of algorithms (i.e. feature selection approach, shrinkage parameter optimization) and/or the nature of the model (i.e. response variable: haz-ard proportion ratio vs. binary response, as well as our use of integrative regression models) [51].
Apart from this comparatively small set of genomic markers, there is no strong genomic “signature”that unambiguously distinguishes LTSs from other GBM. No molecular markers unique to LTS were identified, and there wasn’t the large-scale statistical difference in either gene expression or methylation patterns such as those observed between GBM and LGG. This result is consistent with the observed unimodality of the survival time distribution for the GBM patients (Fig 2A and 2B). If LTS patients represented a biologically distinct subclass of cases, one would expect the distribution of survival times to resemble a bi or multimodal mix-ture, when in fact the distribution of time until death is basically monotonically decreasing for survival times greater than the mode.
Furthermore, while there are biomarkers that significantly predict LTS in logistic regression models, there are no molecular profiles that strongly define LTS as a distinct subclass in the way that LGGs are molecularly distinct from GBM. This is evident from the occurrence of LTS samples throughout PCA scatterplots, and the lack of a single node or subtree subtending most or all LTSs in dendrograms. Such results suggest that there are many patterns of gene expres-sion and methylation that lead to LTS phenotypes. Similarly, the lack of a consistent molecular signature among secondary GBMs, or a shared signature between secondary GBM and LTS implies that secondary GBMs are not associated with improved patient outcomes in compari-son to primary GBM.
Supporting Information
S1 Fig. Heatmap of the gene expression levels for LTS GBM, non-LTS GBM and LGG sam-ples (N = 383).Hierarchical clustering (HC) on the expression levels of ULR predictor genes (N = 38) was used to classify the samples. The row dendrogram, showing the relationship among samples, was based on Pearson correlation coefficients, thecolumn dendrogram on Spearman correlation coefficients. In the row-side color bars ofIDHstatus and LGG history, red indicatesIDH1+or history of LGG diagnosis; grey indicatesIDH1-or no history of LGG diagnosis; white indicates no data available for the sample.
(TIF)
S2 Fig. Heatmap of the gene expression levels for LTS GBM, non-LTS GBM and LGG sam-ples (N = 383).Hierarchical clustering (HC) on the expression levels of LLR predictor genes (n = 94) was used to classify the samples. The row dendrogram (clustering of samples) is based on Pearson correlation coefficient and column dendrogram on Spearman correlation coeffi-cient. In the row-side color bars ofIDHstatus and LGG history, red indicatesIDH1+and a his-tory of LGG diagnosis, respectively; grey indicatesIDH1-or no history of LGG diagnosis, respectively; white indicates that no data is available for the sample.
(TIF)
S1 Table. Comparison of LLR models with and without the combination of KPS and che-motherapy with gene expression and age, as well as LLR models with DNA methylation and age as independent variables.The genes with non-zero penalized regression coefficients (β) in Lasso regression model are listed in the table.
(XLSX)
S2 Table. List of features that are statistically significant associations with LTS GBM under ULR model.For somatic point mutation, genes with unadjustedp<0.05 are shown. For the
other classes of data, genes with adjustedq<0.05 (Bonferroni correction, i.e. pbonf) were
shown.“Estimate”is the coefficient associated with the variable;“Std.Error”is the standard error associated with these estimates;“Pr (>|z|)”is thep-value associated with the z-value.
(XLSX)
S3 Table. List of significant molecular predictors selected with LLR. Genes with non-zero penalized regression coefficients (β) in Lasso regression model are shown.
(XLSX)
S4 Table. Functional annotation terms associated with LTS in GBM patients.Annotation clusters with adjustedp-value (Benjamini-Hochberg) q<0.05 for related annotation terms are
shown. Fold enrichment is the ratio of annotation terms of LTS predictors to those of all genes. (XLSX)
S5 Table. Centroid distance table for PCs of gene expression.
(XLSX)
S6 Table. Centroid distance table for PCs of DNA methylation.
(XLSX)
Acknowledgments
Author Contributions
Conceived and designed the experiments: MC MB MS JL. Performed the experiments: JL MS. Analyzed the data: JL MS. Contributed reagents/materials/analysis tools: JL MS MC. Wrote the paper: JL MS MC MB.
References
1. Ohgaki H, Kleihues P. Epidemiology and etiology of gliomas.Acta Neuropathol2005; 109:93–108. PMID:15685439
2. Burton EC, Lamborn KR, Feuerstein BG, Prados M, Scott J, Forsyth P, et al. Genetic aberrations defined by comparative genomic hybridization distinguish long-term from typical survivors of glioblas-toma.Cancer Res2002; 62:6205–10. PMID:12414648
3. Burton EC, Lamborn KR, Forsyth P, Scott J, O'Campo J, Uyehara-Lock J, et al. Aberrant p53, mdm2, and proliferation differ in glioblastomas from long-term compared with typical survivors.Clin Cancer Res2002; 8:180–7. PMID:11801556
4. Das P, Puri T, Jha P, Pathak P, Joshi N, Suri V, et al. A clinicopathological and molecular analysis of glioblastoma multiforme with long-term survival.J Clin Neurosci2011; 18:66–70. doi:10.1016/j.jocn. 2010.04.050PMID:20888234
5. Adeberg S, Bostel T, König L, Welzel T, Debus J, Combs SE. A comparison of long-term survivors and short-term survivors with glioblastoma, subventricular zone involvement: a predictive factor for sur-vival?Radiat Oncol2014; 9:95. doi:10.1186/1748-717X-9-95PMID:24758192
6. Babu R, Sharma R, Karikari IO, Owens TR, Friedman AH, Adamson C. Outcome and prognostic fac-tors in adult cerebellar glioblastoma.J Clin Neurosci2013; 20:1117–21. doi:10.1016/j.jocn.2012.12. 006PMID:23706183
7. Sonoda Y, Kumabe T, Watanabe M, Nakazato Y, Inoue T, Kanamori M, et al. Long-term survivors of glioblastoma: clinical features and molecular analysis. Acta Neurochir (Wien) 2009; 151:1349–58.
8. Ullén H, Mattsson B, Collins VP: Long-term survival after malignant glioma. A clinical and histopatho-logical study on the accuracy of the diagnosis in a population-based cancer register.Acta Oncol1990; 29:875–8. PMID:2261201
9. Kraus JA, Wenghoefer M, Schmidt MC, von Deimling A, Berweiler U, Roggendorf W, et al. Long-term survival of glioblastoma multiforme: importance of histopathological reevaluation.J Neurol2000; 247:455–60. PMID:10929275
10. Senger D, Cairncross JG, Forsyth PJ: Long-term survivors of glioblastoma: statistical aberration or important unrecognized molecular subtype?Cancer J2003; 9:214–221. PMID:12952306
11. Brennan CW, Verhaak RGW, McKenna A, Campos B, Noushmehr H, Salama SR, et al. The Somatic Genomic Landscape of Glioblastoma.Cell2013; 155:462–477. doi:10.1016/j.cell.2013.09.034PMID: 24120142
12. Amelot A, De Cremoux P, Quillien V, Polivka M, Adle-Biassette H, Lehmann-Che J, et al. IDH-Mutation Is a Weak Predictor of Long-Term Survival in Glioblastoma Patients. PLoS One 2015; 10:e0130596. doi:10.1371/journal.pone.0130596PMID:26158269
13. Erson-Omay EZ, Ca layan O, Schultz N, Weinhold N, Omay SB, Özduman K, et al. Somatic POLE mutations cause an ultramutated giant cell high-grade glioma subtype with better prognosis.Neuro Oncol2015; 17:1356–1364. doi:10.1093/neuonc/nov027PMID:25740784
14. Kraus JA, Glesmann N, Beck M, Krex D, Klockgether T, Schackert G, et al. Molecular analysis of the PTEN, TP53 and CDKN2A tumor suppressor genes in long-term survivors of glioblastoma multiforme.
J Neurooncol2000; 48:89–94. PMID:11083071
15. Lai RK, Chen Y, Guan X, Nousome D, Sharma C, Canoll P, et al. Genome-wide methylation analyses in glioblastoma multiforme. PLoS One 2014; 9.
16. Niyazi M, Zehentmayr F, Niemöller OM, Eigenbrod S, Kretzschmar H, Schulze-Osthoff K, et al. MiRNA expression patterns predict survival in glioblastoma.Radiat Oncol2011; 6:153. doi: 10.1186/1748-717X-6-153PMID:22074483
17. Parker NR, Khong P, Parkinson JF, Howell VM, Wheeler HR. Molecular Heterogeneity in Glioblastoma: Potential Clinical Implications. Front Oncol 2015; 5-:1–9.
19. Smith AA, Huang Y-T, Eliot M, Houseman EA, Marsit CJ, Wiencke JK, et al. A novel approach to the discovery of survival biomarkers in glioblastoma using a joint analysis of DNA methylation and gene expression.Epigenetics2014; 9:37–41.
20. Verhaak RGW, Hoadley K, Purdom E, Wang V, Qi Y, Wilkerson MD, et al. Integrated Genomic Analysis Identifies Clinically Relevant Subtypes of Glioblastoma Characterized by Abnormalities in PDGFRA, IDH1, EGFR, and NF1.Cancer Cell2010; 17:98–110. doi:10.1016/j.ccr.2009.12.020PMID:20129251
21. Gerber NK, Goenka A, Turcan S, Reyngold M, Makarov V, Kannan K, et al. Transcriptional diversity of long-term glioblastoma survivors.Neuro Oncol2014; 16:1186–95. doi:10.1093/neuonc/nou043PMID: 24662514
22. Leu S, von Felten S, Frank S, Vassella E, Vajtai I, Taylor E, et al. IDH/MGMT-driven molecular classifi-cation of low-grade glioma is a strong predictor for long-term survival.Neuro Oncol2013; 15:469–79. doi:10.1093/neuonc/nos317PMID:23408861
23. Reifenberger G, Weber RG, Riehmer V, Kaulich K, Willscher E, Wirth H, et al. Molecular characteriza-tion of long-term survivors of glioblastoma using genome- and transcriptome-wide profiling.Int J Cancer
2014; 135:1822–31. doi:10.1002/ijc.28836PMID:24615357
24. Zhao Q, Shi X, Xie Y, Huang J, Shia B, Ma S. Combining multidimensional genomic measurements for predicting cancer prognosis: observations from TCGA.Brief Bioinform2015; 16:291–303. doi:10. 1093/bib/bbu003PMID:24632304
25. Kleihues P, Burger PC, Plate KH, Ohgaki H, Cavenee WK.Pathology and Genetics of Tumours of the Nervous System. Lyon: International Agency for Research on Cancer;1997.
26. The Cancer Genome Atlas:http://cancergenome.nih.gov/
27. Shpak M, Goldberg MM, Cowperthwaite MC: Rapid and convergent evolution in the Glioblastoma multi-forme genome.Genomics2015; 105:159–167. doi:10.1016/j.ygeno.2014.12.010PMID:25576655
28. Larson DE, Harris CC, Chen K, Koboldt DC, Abbott TE, Dooling DJ, et al. SomaticSniper: identification of somatic point mutations in whole genome sequencing data.Bioinformatics2012; 28:311–7. doi:10. 1093/bioinformatics/btr665PMID:22155872
29. Cingolani P, Platts A, Coon M, Nguyen T, Wang L, Land SJ, et al. A program for annotating and predict-ing the effects of spredict-ingle nucleotide polymorphisms, SnpEff: SNPs in the genome of Drosophila melano-gaster strain w1118; iso-2; iso-3. Fly 2012; 6:80–92. doi:10.4161/fly.19695PMID:22728672
30. Shpak M, Hall AW, Goldberg MM, Derryberry DZ, Ni Y, Iyer VR, et al. An eQTL analysis of the human glioblastoma multiforme genome.Genomics2014; 103:252–263. doi:10.1016/j.ygeno.2014.02.005 PMID:24607568
31. Irizarry RA, Hobbs B, Collin F, Beazer-Barclay YD, Antonellis KJ, Scherf U, et al. Exploration, normali-zation, and summaries of high density oligonucleotide array probe level data. Biostatistics 2003; 4:249– 64. PMID:12925520
32. Efron B, Hastie T, Johnstone I, Tibshirani R. Least angle regression.Ann Stat2015; 32:407–499.
33. Chawla N: Data Mining for Imbalanced Datasets: An Overview. In Data Mining and Knowledge Discov-ery Handbook SE—40. Edited by Maimon O, Rokach L. Springer US;2005:875–886.
34. Getis A, Ord JK: The Analysis of Spatial Association by Use of Distance Statistics.Geogr Anal2010; 24:189–206.
35. Hartigan JA, Hartigan PM: The Dip test of unimodality. Ann Stat 1985; 13:70–84.
36. Krex D, Klink B, Hartmann C, von Deimling A, Pietsch T, Simon M, et al. Long-term survival with glio-blastoma multiforme.Brain2007; 130:2596–606. PMID:17785346
37. Chambless LB, Kistka HM, Parker SL, Hassam-Malani L, McGirt MJ, Thompson RC. The relative value of postoperative versus preoperative Karnofsky Performance Scale scores as a predictor of survival after surgical resection of glioblastoma multiforme.J Neuro Oncol2015; 121:359–364.
38. Stuehr DJ: Mammalian nitric oxide synthases.Biochim Biophys Acta1999; 1411:217–30. PMID: 10320659
39. Dixit R, Wilkinson G, Cancino GI, Shaker T, Adnani L, Li S, et al. Neurog1 and Neurog2 control two waves of neuronal differentiation in the piriform cortex.J Neurosci2014, 34:539–53. doi:10.1523/ JNEUROSCI.0614-13.2014PMID:24403153
40. Wang D, Han S, Peng R, Jiao C, Wang X, Han Z, et al. DUSP28 contributes to human hepatocellular carcinoma via regulation of the p38 MAPK signaling.Int J Oncol2014; 45:2596–604. doi:10.3892/ijo. 2014.2653PMID:25230705
41. Kuhajda FP, Piantadosi S, Pasternack GR: Haptoglobin-related protein (Hpr) epitopes in breast cancer as a predictor of recurrence of the disease.N Engl J Med1989; 321:636–41. PMID:2475778
responsiveness to SJ749, an alpha(5)beta(1) integrin antagonist.Biochim Biophys Acta2009; 1793:354–67. doi:10.1016/j.bbamcr.2008.09.019PMID:18992284
43. Huse JT, Phillips HS, Brennan CW: Molecular subclassification of diffuse gliomas: seeing order in the chaos.Glia2011; 59:1190–9. doi:10.1002/glia.21165PMID:21446051
44. Phillips HS, Kharbanda S, Chen R, Forrest WF, Soriano RH, Wu TD, et al. Molecular subclasses of high-grade glioma predict prognosis, delineate a pattern of disease progression, and resemble stages in neurogenesis.Cancer Cell2006; 9:157–73. PMID:16530701
45. Kleihues P, Ohgaki H: Primary and secondary glioblastomas: from concept to clinical diagnosis. Neuro Oncol 1999; 1:44–51. PMID:11550301
46. Zhang C, Zhang J, Hao, Shi Z, Wang Y, Han L, et al. High level of miR-221/222 confers increased cell invasion and poor prognosis in glioma.J Transl Med2012; 10:119. doi:10.1186/1479-5876-10-119 PMID:22681957
47. Zhang C, Zhang J, Zhang A, Shi ZD, Han L, Jia ZF, et al. MiR-221 and miR-222 target PUMA to induce cell survival in glioblastoma.Mol Caner2010; 9:229.
48. Shete S, Hosking FJ, Robertson LB, Dobbins SE, Sanson M, Malmer B, et al. Genome-wide associa-tion study identifies five susceptibility loci for glioma.Nat Genet2009; 41:899–904. doi:10.1038/ng.407 PMID:19578367
49. Wrensch M, Jenkins RB, Chang JS, Yeh RF, Xiao Y, Decker PA, et al. Variants in the CDKN2B and RTEL1 regions are associated with high-grade glioma susceptibility.Nat Genet2009; 41:905–8. doi: 10.1038/ng.408PMID:19578366
50. Lin Q, Wagner W: Epigenetic Aging Signatures Are Coherently Modified in Cancer.PLoS Genet2015; 11:e1005334. doi:10.1371/journal.pgen.1005334PMID:26110659