BGD
12, 2307–2355, 2015Relationship between N : P : Si ratio and
phytoplankton
A. K. Choudhury and P. Bhadury
Title Page
Abstract Introduction
Conclusions References
Tables Figures
◭ ◮
◭ ◮
Back Close
Full Screen / Esc
Printer-friendly Version Interactive Discussion
Discussion
P
a
per
|
Discussion
P
a
per
|
Discussion
P
a
per
|
Discussion
P
a
per
|
Biogeosciences Discuss., 12, 2307–2355, 2015 www.biogeosciences-discuss.net/12/2307/2015/ doi:10.5194/bgd-12-2307-2015
© Author(s) 2015. CC Attribution 3.0 License.
This discussion paper is/has been under review for the journal Biogeosciences (BG). Please refer to the corresponding final paper in BG if available.
Relationship between N : P : Si ratio and
phytoplankton community composition in
a tropical estuarine mangrove ecosystem
A. K. Choudhury1,*and P. Bhadury1
1
Integrative Taxonomy and Microbial Ecology Research Group, Indian Institute of Science Education and Research Kolkata, Mohanpur – 741246, West Bengal, India
*
now at: RKM Vivekananda Centenary College, Rahara, Kolkata – 700118, West Bengal, India
Received: 26 November 2014 – Accepted: 23 January 2015 – Published: 3 February 2015
Correspondence to: P. Bhadury ([email protected])
BGD
12, 2307–2355, 2015Relationship between N : P : Si ratio and
phytoplankton
A. K. Choudhury and P. Bhadury
Title Page
Abstract Introduction
Conclusions References
Tables Figures
◭ ◮
◭ ◮
Back Close
Full Screen / Esc
Printer-friendly Version Interactive Discussion
Discussion
P
a
per
|
Discussion
P
a
per
|
Discussion
P
a
per
|
Discussion
P
a
per
|
Abstract
The present work aims at understanding the importance of Brzezinski–Redfield ratio (modified Redfield ratio) as a determinant of natural phytoplankton community compo-sition in a mangrove ecosystem. Even though this ecoregion has been reported to be mostly eutrophic, localised and anthropogenic influences often result in habitat variabil-5
ity especially with regard to nutrient concentrations at different parts of this ecosystem. Phytoplankton, an important sentinel in aquatic ecosystems may respond differently to such alterations in habitat thereby bringing about significant changes in the community composition. Results show that even though habitat variability does exist at our study area and varied on a spatial and temporal scale, the nutrient concentrations were intri-10
cately balanced that never became limited and complemented well with the concept of modified Redfield ratio. However, an integrative approach to study phytoplankton com-munity involving microscopy andrbcL clone library and sequencing approach revealed that it was the functional traits of individual phytoplankton taxa that determined the phy-toplankton community composition rather than the nutrient concentrations of the study 15
area. Hence we conclude that the recent concept of functional traits and elemental stoi-chiometry does not remain restricted to controlled environment of experimental studies only but occur in natural mangrove habitat.
1 Introduction
Redfield was of the opinion that elemental compositions of phytoplankton were statisti-20
cally uniform and variations in inorganic C : N : P ratios were primarily due to synthesis or decomposition of organic matter (1958). However, as different concepts of nutri-ent requiremnutri-ents and utilization by phytoplankton came into fray (Monod and Droop’s model (Monod and Droop, 1968, 1983); resource-ratio theory (Tilman, 1982); variable-internal-stores model (Grover, 1991); the intermediate disturbance hypothesis (Som-25
bi-BGD
12, 2307–2355, 2015Relationship between N : P : Si ratio and
phytoplankton
A. K. Choudhury and P. Bhadury
Title Page
Abstract Introduction
Conclusions References
Tables Figures
◭ ◮
◭ ◮
Back Close
Full Screen / Esc
Printer-friendly Version Interactive Discussion
Discussion
P
a
per
|
Discussion
P
a
per
|
Discussion
P
a
per
|
Discussion
P
a
per
|
ologists. Falkowski (2000) suggested that the changes in C : N : P stoichiometry from the proposed Redfield ratio of 106 : 16 : 1 was critical in understanding the role of phy-toplankton in biogeochemistry. Thus, N : P ratio of 16 : 1 became a benchmark to dif-ferentiate N-limitation and P-limitation and was considered as a reference point for the upper limit of N : P in oceans (Falkowski, 1997; Tyrrell, 1999; Lenton and Watson, 5
2000). Increase in anthropogenic influences is expected to affect physical and chemical processes in aquatic ecosystems with a consequential effect on water biogeochemistry (Solomon et al., 2007; van de Waal et al., 2010). Thus, this rigid Redfield hypothesis for N : P ratio was challenged both with regard to elemental composition of phytoplankton and conditions of nutrient limitation (Broecker and Henderson, 1998). So it is possibly 10
the plasticity of intrinsic elemental composition in phytoplankton and a complex balance between several biological processes including nitrogen fixation and denitrification that regulates N : P ratio in natural waters (Redfield, 1958; Falkowski, 2000).
In the past decades, fertilizer use and combustion of fossil fuel has significantly in-creased global nitrogen (N) pollution, especially in coastal aquatic habitats (Galloway 15
et al., 2004). Internationally recognised organizations like the Ecological Society of America (Vitousek et al., 1997) and the Coastal Marine Team of the National Climate Change Assessment (Boesch et al., 2002; Scavia et al., 2002) have reported N pollu-tion as one of the greatest consequences of human accelerated global change on the coastal ecosystems. Such increases in N loading can lead to eutrophication, a condi-20
tion that would have both ecological and societal implications particularly with regard to fish and shellfish production, recreation and waste assimilation (Costanza et al., 1997) and eventually will affect ecosystem functioning (Nixon, 1995; Howarth et al., 2000; NRC, 2000). However, consensus of N loadings as the primary cause of eutrophica-tion has often been debated and like lake ecosystems, phosphorus is also opined to 25
BGD
12, 2307–2355, 2015Relationship between N : P : Si ratio and
phytoplankton
A. K. Choudhury and P. Bhadury
Title Page
Abstract Introduction
Conclusions References
Tables Figures
◭ ◮
◭ ◮
Back Close
Full Screen / Esc
Printer-friendly Version Interactive Discussion
Discussion
P
a
per
|
Discussion
P
a
per
|
Discussion
P
a
per
|
Discussion
P
a
per
|
coastal environments. Interestingly, in that year, there were documentations of coastal eutrophication primarily brought about by N loadings due to increased human activity (Boesch, 2000). However, in the later part of 1990s, several mesocosm based experi-ment approaches and in situ studies established that it was total N rather than total P that primarily controlled eutrophication in estuarine systems.
5
Another important nutrient in natural aquatic ecosystems is silicate which is the pri-mary constituent of diatoms, a major constituent of natural phytoplankton assemblages. Even though N loadings and P concentrations due to anthropogenic activity and deter-gent usage have increased, silicate levels have remained steadier through times (Gilpin et al., 2004). The N : Si ratio being main factor for diatom growth, increasing inorganic 10
N : Si ratios may be due to Si limitation that may affect diatom growth. The relative cell counts and biomass of specific diatom taxon may get influenced as nutrient sta-tus alternates from N limitation to Si limitation (Davidson and Gurney, 1999). Thus, instead of traditional Redfield ratio of N : P as 16 : 1, modified Redfield ratio of N : P : Si as 16 : 1 : 15 (Brzezinski, 1985) is often used as a standard to understand nutrient 15
limitation with respect to nitrogen, phosphorus or silicate for natural phytoplankton as-semblages.
Mangrove ecosytems around South East Asia are largely eutrophic with high N load-ings as most of these ecoregions border coastal areas (Talane-McManus et al., 2001). These habitats at the interface of land and ocean experiences changes in mixing con-20
ditions that would possibly alter physical and chemical properties of the habitat as well. Like other mangroves around the world, the Sundarbans mangrove ecoregion at the coastal fringes of West Bengal (India) and Bangladesh is affected by both the freshwa-ter riverine influx of the Ganga–Brahmaputra–Meghna River system and marine wafreshwa-ter from the Bay of Bengal. Along the banks of these riverine systems, large human settle-25
BGD
12, 2307–2355, 2015Relationship between N : P : Si ratio and
phytoplankton
A. K. Choudhury and P. Bhadury
Title Page
Abstract Introduction
Conclusions References
Tables Figures
◭ ◮
◭ ◮
Back Close
Full Screen / Esc
Printer-friendly Version Interactive Discussion
Discussion
P
a
per
|
Discussion
P
a
per
|
Discussion
P
a
per
|
Discussion
P
a
per
|
established this area to be largely eutrophic particularly with regard to nutrient concen-trations that entails the Sundarbans mangrove area to be highly productive (Manna et al., 2010; Biswas et al., 2004). Thus, existence of mangrove ecosystem in the estuar-ine phase of tropical rivers can be a source as well as sedimentary sink for nutrients (Gonneea et al., 2004). So it becomes evident that the coastal area of West Bengal 5
especially the Sundarbans mangrove region experiences huge N loadings especially from anthropogenic sources as well as from agricultural runoffs. Phytoplankton being an important sentinel to observe effects of multiple stressors is expected to be affected by this huge nutrient loadings and corresponding changes in the habitat. Even though the eutrophic status of the Sundarbans ecoregion is well reported, yet a specific effort 10
to understand community composition of natural phytoplankton population as response to variations in Brzezinski–Redfield ratio of the habitat is not well documented.
Hence, the primary objective of this work was to determine whether the habitat of the study area reaches nutrient limited condition with respect to either of nitrogen, phos-phorus or silicate. This would possibly provide us with information on whether modified 15
Redfield ratio as an important driving factor for phytoplankton community composition also holds true for this apparently eutrophic mangrove ecoregion. In the present work we also tried to understand as to how phytoplankton community composition might shift under variable status of modified Redfield ratio under natural conditions. However, the change in community composition may not be only due to alterations in modified Red-20
BGD
12, 2307–2355, 2015Relationship between N : P : Si ratio and
phytoplankton
A. K. Choudhury and P. Bhadury
Title Page
Abstract Introduction
Conclusions References
Tables Figures
◭ ◮
◭ ◮
Back Close
Full Screen / Esc
Printer-friendly Version Interactive Discussion
Discussion
P
a
per
|
Discussion
P
a
per
|
Discussion
P
a
per
|
Discussion
P
a
per
|
2 Method
2.1 Study area
The study area was located in the south eastern part of Sagar Island, the largest island of Indian Sundarbans surrounded by River Hooghly in the north and west, Mooriganga estuary in the east and Bay of Bengal in south. The study area was selected at the con-5
fluence of a tidal creek (Chemaguri creek) and estuary (Mooriganga estuary) with clos-est proximity to the Bay of Bengal. Since the creek station [Station 1: 21◦40′44.4′′N, 88◦08′49.5′′E (Stn. 1)] opens into the estuary, the influence of freshwater will be more as compared to the estuarine station [Station 3: 21◦40′40.6′′N, 88◦09′19.2′′E (Stn. 3)] where influence of marine water will be more pronounced (Fig. 1). Thus, our study on 10
these two stations would allow us to specifically understand the influences of fresh-water and marine fresh-water on nutrient profiles and modified Redfield ratio. This work is part of a long term monitoring program that was initiated in 2010 at the Sundarbans (SBOTS – Sundarbans Biological Observatory Time Series) and continues till date.
2.2 Sample collection 15
Samplings were done onboard a motorised boat from February 2013 to January 2014 from both stations at bi weekly intervals. However, from June to September 2013, sam-pling efforts were reduced to monthly intervals due to inclement weather conditions caused by very high seasonal precipitation. Sample collections were restricted to sur-face waters because the euphotic depth in this area of Sundarbans largely tends to be 20
less than 1 m. Abiotic variables like pH (pH meter, Eco testr), air and water temperature (Celsius thermometer), salinity (refractometer, ERMA, Tokyo), dissolved oxygen (DO meter, Eutech) and Secchi depth (Secchi disc) were measured by hand held instru-ments. In situ Secchi depth data were used to calculate Light Attenuation Coefficient of the habitat (Kt) (Holmes, 1970). Suspended Particulate Matter (SPM load) in this area
25
BGD
12, 2307–2355, 2015Relationship between N : P : Si ratio and
phytoplankton
A. K. Choudhury and P. Bhadury
Title Page
Abstract Introduction
Conclusions References
Tables Figures
◭ ◮
◭ ◮
Back Close
Full Screen / Esc
Printer-friendly Version Interactive Discussion
Discussion
P
a
per
|
Discussion
P
a
per
|
Discussion
P
a
per
|
Discussion
P
a
per
|
Samples for nutrient analysis were collected separately in 125 mL HDPE amber bot-tles and fixed with neutral formalin immediately after collection to a final concentration of 4 % (v/v). The fixation was mainly done to reduce photochemical microbial activity on Dissolved Organic Matter (DOM) that may result in release of Dissolved Organic Nitrogen (DON) from humic acid, a major constituent of DOM (Dell’ Anno et al., 1999). 5
Precautions were taken to minimise any photo-oxidation of the samples by keeping the samples in specifically designed dark boxes during transportation. Samples for phyto-plankton cell counts were collected in 125 mL amber coloured bottles and fixed with 4 % formalin.
The sample collection for molecular work was restricted to the estuarine station be-10
cause this station was located at the confluence of creek and estuary with pronounced marine water inflow. Since phytoplankton population at this area was dominated by diatoms (Bhattacharjee et al., 2013; Samanta and Bhadury, 2014), the phytoplankton diversity is expected to be more at the estuarine station as chromophytic algae (di-atoms) mostly tend to be euryhaline. Moreover, since the phytoplankton population 15
has already been worked out extensively (Samanta and Bhadury, 2014), molecular work was much restricted and focussed mainly in understanding whether the basic phytoplankton population has undergone any major shift on a temporal and inter an-nual scale. Thus, to keep a continuation with previous works, sample collections for molecular work were restricted to 18 October 2012 (post monsoon), 22 March 2013 20
(pre monsoon) and 1 August 2013 (monsoon). During sample collection for molecular work, 2 L surface water from the estuarine station was collected separately and kept without fixation.
2.3 Nutrient analysis
On transportation to laboratory, the water samples for nutrient analysis were filtered 25
BGD
12, 2307–2355, 2015Relationship between N : P : Si ratio and
phytoplankton
A. K. Choudhury and P. Bhadury
Title Page
Abstract Introduction
Conclusions References
Tables Figures
◭ ◮
◭ ◮
Back Close
Full Screen / Esc
Printer-friendly Version Interactive Discussion
Discussion
P
a
per
|
Discussion
P
a
per
|
Discussion
P
a
per
|
Discussion
P
a
per
|
concentrations were measured spectrophotometrically in a UV-Vis spectrophotometer (U2900, Hitachi Corporation). The concentration of each nutrient was calculated from standard curves. The molar concentrations of each nutrient were used to determine molar ratios for N : P, Si : P, N : Si and were extrapolated for N : P : Si ratio (Redfield– Brzezinski ratio).
5
2.4 Microscopic study of phytoplankton population
In the laboratory, samples for microscopic enumeration and cell counts were gravity settled (24 h) and phytoplankton cell counts were performed by drop count method in triplicates (Verlancer and Desai, 2004). Cell count data were extrapolated to 1000 mL both for total phytoplankton as well as for individual species. Phytoplankton genera 10
were identified using different monographs and they belonged to three main groups, i.e., diatoms, dinoflagellates and green algae (Desikachary, 1959, 1987; Tomas, 1997). Analysis of phytoplankton data were done on the basis of percentage contribution, species diversity index (H′) (as relative abundance of species dependence function), and species evenness (J) (as function of equality degree in genera abundance). 15
2.5 Determination of cellular biovolumes and carbon content
Cellular biovolumes and surface area were determined for the dominant phytoplank-ton taxa following the specific geometric shapes and formulae proposed by Hillebrand et al. (1999). Subsequently, cellular carbon contents were deduced following Menden Deuer and Lessard (2000). Unlike cell count data, for biovolume estimation live speci-20
men were taken into consideration as application of preservative often result in shrink-age of cell dimensions, that would lead to false estimation of cellular biovolumes (Wet-zel and Likens, 1991). Cell dimensions for individual taxon were noted to calculate the biovolume and for each individual taxon based on published literatures (Hillebrand et al., 1999). Previous works have reported that conversions of linear datasets to cel-25
BGD
12, 2307–2355, 2015Relationship between N : P : Si ratio and
phytoplankton
A. K. Choudhury and P. Bhadury
Title Page
Abstract Introduction
Conclusions References
Tables Figures
◭ ◮
◭ ◮
Back Close
Full Screen / Esc
Printer-friendly Version Interactive Discussion
Discussion
P
a
per
|
Discussion
P
a
per
|
Discussion
P
a
per
|
Discussion
P
a
per
|
often assumptive. Keeping in view the MacDonald–Pfitzer diminutive hypothesis (Mac-Donald, 1869; Pfitzer, 1869), measurements of at least five individual cells for each taxon were recorded and mean values were considered for each dimension to deter-mine the biovolumes. Cellular biovolumes were converted for cellular carbon content to understand the seasonal and spatial patterns (Menden Deuer and Lessard, 2000) 5
that may possibly occur due to changes in nutrient status of the habitat.
2.6 Statistical analysis
Principal Component Analyses (PCA) were performed to statistically establish habitat variability of both the stations (creek (Station 1) and estuarine station (Station 3)) by considering environmental parameters as variables (STATISTICA 7.0). The datasets for 10
each variable were log(x+1) transformed to reduce the scale variability and were used as the input data. Similar PCA plot of the cases (months) were performed to under-stand if any seasonal pattern was present with respect to diversity of habitat. In order to envisage the relationship between phytoplankton and environment, the datasets were condensed into two matrices, one representing the species abundance for each site 15
and the other one for environmental variables. A Canonical Correspondence Analysis (CCA) was applied for each station so as to represent not only the species composition variation pattern but also the relationships between species and each environmental variable for each of the creek (Station 1) and estuarine stations (Station 3) (Ter Braak and Prentice, 1988). Biotic variables were represented by abundances of individual 20
phytoplankton taxa determined from microscopic analysis. Environmental variables in-cluded physical parameters like air temperature (AT), water temperature (WT), pH, salinity, tide, light attenuation coefficient (LA Coeff), SPM load (SPM) and chemical pa-rameters like nitrate, phosphate, silicate, ammonia, dissolved oxygen (DO) along with molar ratio of nutrients (DIN–DIP, DIN–DSi, DSi–DIP). Like PCA, all variables were 25
BGD
12, 2307–2355, 2015Relationship between N : P : Si ratio and
phytoplankton
A. K. Choudhury and P. Bhadury
Title Page
Abstract Introduction
Conclusions References
Tables Figures
◭ ◮
◭ ◮
Back Close
Full Screen / Esc
Printer-friendly Version Interactive Discussion
Discussion
P
a
per
|
Discussion
P
a
per
|
Discussion
P
a
per
|
Discussion
P
a
per
|
factor loadings show the correlation between variables and determine the importance of each environmental species in determining the phytoplankton (numbers in CCA plots represent individual species) variability of the study area.
2.7 Environmental DNA extraction and PCR amplification ofrbcL gene fragment
On transportation to laboratory, 2 L water sample specifically collected for molecu-5
lar study was filtered through 0.45 µm nitrocellulose filter paper (47 mm diameter; Rankem) using a vacuum pump. The filters were subsequently stored at−20◦C until
DNA extraction. Environmental DNA extraction from filters followed by PCR amplifica-tion ofrbcL gene fragments and subsequent steps were followed as detailed previously by Samanta and Bhadury (2014).
10
2.8 Cloning and sequencing
After purification, the PCR products were cloned using pGEM-T Easy vector system (Promega, Madison, WI, USA) following manufacturer’s instructions. Plasmid DNA con-taining inserts was sequenced with SP6 primer in an ABI Prism 3130 Genetic Analyzer based on BigDye Terminator chemistry. The clone library abbreviations used for 18 Oc-15
tober 2012, 22 March 2013 and 1 August 2013 are Stn3_Oct_12_, Stn 3_Mar13_and Stn3_Aug13_ respectively.
2.9 Sequence analysis and molecular phylogeny
Chromatograms were manually checked in BioEdit v7.0 (Carlsbad, CA, USA) for any ambiguity or error before undertaking further downstream analysis. The DNA 20
BGD
12, 2307–2355, 2015Relationship between N : P : Si ratio and
phytoplankton
A. K. Choudhury and P. Bhadury
Title Page
Abstract Introduction
Conclusions References
Tables Figures
◭ ◮
◭ ◮
Back Close
Full Screen / Esc
Printer-friendly Version Interactive Discussion
Discussion
P
a
per
|
Discussion
P
a
per
|
Discussion
P
a
per
|
Discussion
P
a
per
|
in this study based on blastp validation (only top ten blastp hits were included) were aligned using Clustal Omega (Dublin, Ireland). The alignment file generated was man-ually checked in Seaview v4.0 for any error or ambiguity. On verification, a phylogenetic tree was constructed using Neighbor-joining method in MEGA version 6 (Saitou and Nei, 1987; Tamura et al., 2011). Bootstrap test (1000 replicates) was performed to 5
get the best topology of consensus tree with the value>50 % significant branching (Felsenstein, 1985). The sequences generated as part of this study have been submit-ted to GenBank and their accession numbers are from KJ720820–KJ720885.
3 Results
3.1 Hydrological features of the habitat 10
The general environmental and hydrological properties of the study area were typi-cal for tropitypi-cal estuarine area where the entire sampling period was categorised as pre monsoon (February–June 2013), monsoon (July–October 2013) and post mon-soon (November 2013–January 2014). Spatial differences in water temperature were observed with the mean water temperature of the estuarine station (29.39±4.28◦C) 15
being higher than the creek station (28.42±3.23◦C) (Fig. 1a). The pH largely
re-mained around 8, which decreased slightly during monsoon due to precipitation events (Fig. 1b). In contrast, mean salinity at the estuarine station (15.71±7.32) was higher
as compared to the creek station (11.67±7.23) with drastic fluctuations between pre
monsoon, monsoon and post monsoon (Fig. 1c). Fluctuations in SPM load and Light At-20
BGD
12, 2307–2355, 2015Relationship between N : P : Si ratio and
phytoplankton
A. K. Choudhury and P. Bhadury
Title Page
Abstract Introduction
Conclusions References
Tables Figures
◭ ◮
◭ ◮
Back Close
Full Screen / Esc
Printer-friendly Version Interactive Discussion
Discussion
P
a
per
|
Discussion
P
a
per
|
Discussion
P
a
per
|
Discussion
P
a
per
|
3.2 Distribution of nutrients and habitat variability
Dissolved Inorganic Nitrogen (DIN) was constituted by both nitrate and ammonia as these are the two assimilatory forms of nitrogen that are mainly utilised by phytoplank-ton populations. At the estuarine station, nitrate concentrations showed an irregular pattern with maximum values during peak monsoon period (July–September 2013) 5
that gradually receded during early post monsoon (October–November 2013). How-ever, there was a gradual increasing trend in the subsequent late post monsoon period (December 2013–January 2014) (Fig. 2a). Ammonia concentrations largely remained low and sometimes reached below detection limits (Fig. 2b). Phosphate concentra-tions were much lower (1–7.9 µM) compared to nitrate (30.88–65.08 µM) and silicate 10
(6.22–44.75 µM) although it never reached below detection limits. Phosphate concen-trations were maximum in pre monsoon (May–June 2013) which did not fluctuate sig-nificantly in the subsequent monsoon and post monsoon periods (Fig. 2c). Unlike both nitrate and phosphate, silicate concentrations began to increase from monsoon period (August 2013) and continued to increase during post monsoon with almost a 7-fold 15
increase in concentration (6.22 µM (July 2013)–44.75 µM (January 2014)) (Fig. 2d). Thus, variations in nutrient concentrations were independent of each other and showed different temporal patterns. The profiles of all the nutrients showed similar temporal pat-terns at the creek station as well with slight variations. The annual mean nitrate level at creek station was lower (45.31 µM) as compared to the estuarine station (47.07 µM) 20
and were similar for phosphate concentrations. In contrast, mean annual silicate con-centration at creek station (21.13 µM) was comparatively higher to that of the estuar-ine station (19.39 µM). However, these differences were statistically not significant and hence it suggests that although temporal variations were evident, spatial differences in habitat were less pronounced. The N : P ratio ranged from 9.38 (November 2013) to 25
BGD
12, 2307–2355, 2015Relationship between N : P : Si ratio and
phytoplankton
A. K. Choudhury and P. Bhadury
Title Page
Abstract Introduction
Conclusions References
Tables Figures
◭ ◮
◭ ◮
Back Close
Full Screen / Esc
Printer-friendly Version Interactive Discussion
Discussion
P
a
per
|
Discussion
P
a
per
|
Discussion
P
a
per
|
Discussion
P
a
per
|
(April 2013) to 35.65 (February 2013) (Fig. 3b). On the other hand, variations in N : Si ratio at the creek station was less pronounced (0.95 (December 2013)–9.8 (Febru-ary 2013)) (Fig. 3a) as compared to the estuarine station [1.18 (Janu(Febru-ary 2014)–14.03 (July 2013)] (Fig. 3b).
Seasonally, nutrient concentrations for both nitrate and phosphate were found to 5
be maximum during monsoon, although highest silicate concentrations were recorded during post monsoon period. As mentioned earlier, ammonia represents a key compo-nent of the dissolved inorganic nitrogen pool. However, unlike other nutrients ammonia was not detected during most of the sampling period, suggesting the apparent ab-sence or very low levels of ammonia concentrations. Thus, nitrate primarily accounted 10
for the bulk of inorganic nitrogen in our study area. Seasonal nitrate level between sta-tions largely remained same whereas ammonia levels at the creek station was twice to that of the estuarine station in pre monsoon and vice versa during post monsoon (Fig. 2b). Even though ammonia levels fluctuated between stations, low concentrations of the same did not affect the total dissolved inorganic nitrogen pool of the habitat. 15
Accordingly, seasonal estimates of N : P ratio showed that it mostly remained below the proposed Redfield ratio of 16N : 1P, although it equalled the 16 : 1 ratio during pre monsoon at creek station (Fig. 3a). This was indicative for a weakly nutrient limited condition as per the proposed Redfield ratio. However, during this period ammonia concentrations were significantly high as compared to other seasons, which may have 20
accounted for the high N : P ratio, rather than due to phosphate limitation. Seasonal N : P : Si ratio (Table 1) also remained well below the limited condition ratio of 16 : 1 : 15 thereby confirming that neither of the basic elements of the habitat indicated nutrient limitation.
3.3 Principal Component Analysis (PCA) 25
BGD
12, 2307–2355, 2015Relationship between N : P : Si ratio and
phytoplankton
A. K. Choudhury and P. Bhadury
Title Page
Abstract Introduction
Conclusions References
Tables Figures
◭ ◮
◭ ◮
Back Close
Full Screen / Esc
Printer-friendly Version Interactive Discussion
Discussion
P
a
per
|
Discussion
P
a
per
|
Discussion
P
a
per
|
Discussion
P
a
per
|
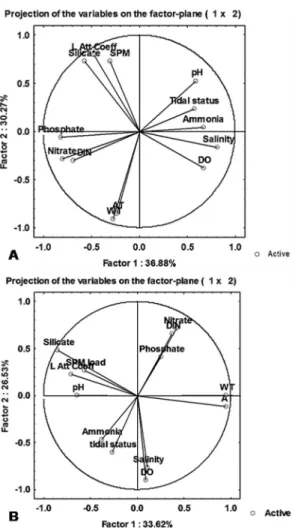
and Factor 2 (F1 v/s F2) that cumulatively explained 67.15 and 60.15 % of cumulative variance of the dataset at the creek station and estuarine station respectively (Supple-ment data I). At the creek station, pH, tidal status and ammonia with high positive factor loadings clustered together with salinity and dissolved oxygen (DO) which had positive loadings along F1 but negative loading along F2 (Fig. 4a). This suggests the apparent 5
inter dependence of these variables with similar temporal trends. However, the lengths of vector indicate that even though tidal effects were correlated with pH, salinity, DO and ammonia levels, it was not the sole factor responsible for bringing out temporal alterations of these variables. In contrast, water temperature (WT) and air temperature (AT) grouped together very closely with high factor loadings. This would mean that wa-10
ter temperature was solely regulated by air temperature. On the other hand, nitrate, phosphate and dissolved inorganic nitrogen (DIN) all grouped together in the opposite quadrat to that of tidal status, indicative of freshwater sources as the major factor that determined the temporal trends of these parameters. Finally, SPM load, Light attenua-tion Coefficient and Silicate concentrations grouped together in a different quadrat with 15
negative loadings for F1 but positive loadings with F2. The close proximity and length of the vectors suggest that they were significantly interdependent on each other for the temporal variations in the fluctuation patterns during the entire sampling period.
Similarly, at the estuarine station grouping of abiotic variables largely remained sim-ilar to that of creek station although they clustered in different quadrats of the PCA plot 20
(Fig. 4b). Thus, as expected both air and water temperature grouped together ammonia and tidal status tended to group together with intermediate factor loadings and vector lengths that suggested tides as an important component in determining the tempo-ral patterns of ammonia concentrations. The nutrient pattern (nitrate, phosphate, DIN) largely remained similar with that of the creek station aligning in a diagonally opposite 25
quadrat to that of tidal status. This also held true with regard to silicate, SPM load and Light Attenuation Coefficient.
estu-BGD
12, 2307–2355, 2015Relationship between N : P : Si ratio and
phytoplankton
A. K. Choudhury and P. Bhadury
Title Page
Abstract Introduction
Conclusions References
Tables Figures
◭ ◮
◭ ◮
Back Close
Full Screen / Esc
Printer-friendly Version Interactive Discussion
Discussion
P
a
per
|
Discussion
P
a
per
|
Discussion
P
a
per
|
Discussion
P
a
per
|
arine stations. As evident from Fig. 5a, months representing monsoon and post mon-soon periods clearly separated out in the PCA plot. However, during late pre monmon-soon (April–June 2013) and early monsoon (July 2013), the representative months over-lapped. This would indicate towards seasonal transitions when temperature variations were not very significant. Similarly, at the estuarine station the seasonal separation for 5
habitat heterogeneity was more prominent as compared to the creek station (Fig. 5b).
3.4 Phytoplankton community composition
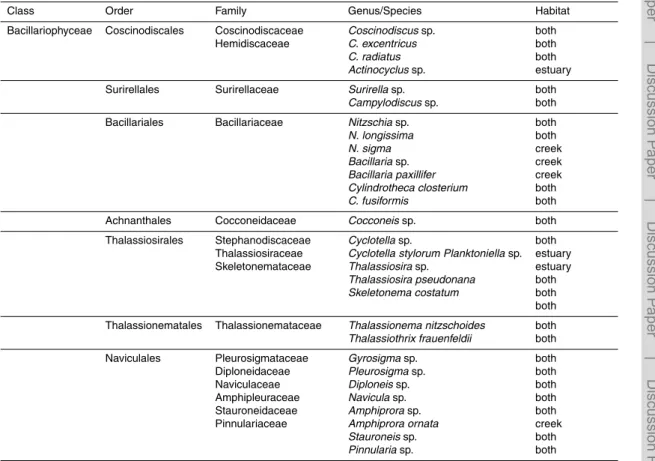
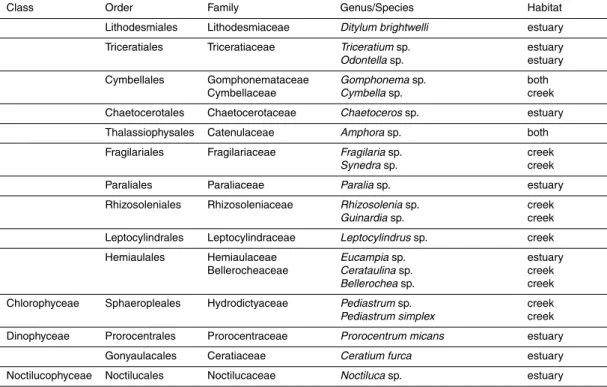
The phytoplankton community was composed mainly of diatoms with intermittent oc-currence of green algae (Chlorophyceae) and dinoflagellates (Dinophyceae). Thus, the entire phytoplankton community was composed of forty six species of diatoms belong-10
ing to twenty seven families and seventeen orders. The green algal population was represented by two species representing Hydrodictyaceae that comes under the or-der Sphaeropleales. The dinoflagellate taxa belonged to three different orders, each being the type specimen for the representative family (Table 2). Among diatoms, Nav-iculales was maximally presented with eight species belonging to six different families. 15
The second largest representative order was Bacillariales with seven different species belonging to the family Bacillariaceae. The other dominant order was Thalassiosirales with six different genera belonging to three distinct families viz. Stephanodiscaceae, Thalassiosiraceae and Skeletonemataceae (Table 2).
Analyses of the temporal trend in phytoplankton functional groups showed that at 20
the creek station the bulk of the diatom population was largely constituted by pennate diatoms with a gradual increase of centric species during post monsoon (Fig. 6a and b). Interestingly, dinoflagellate population remained restricted to the estuarine station and was consistently present during pre monsoon with a gradual increasing trend of centric diatom population (Fig. 6b). Seasonally, centric species at estuarine station was 25
BGD
12, 2307–2355, 2015Relationship between N : P : Si ratio and
phytoplankton
A. K. Choudhury and P. Bhadury
Title Page
Abstract Introduction
Conclusions References
Tables Figures
◭ ◮
◭ ◮
Back Close
Full Screen / Esc
Printer-friendly Version Interactive Discussion
Discussion
P
a
per
|
Discussion
P
a
per
|
Discussion
P
a
per
|
Discussion
P
a
per
|
Estimates of biotic indices revealed that phytoplankton species diversity was more at Station 1 (1.039 (June 2013) to 2.90 (April 2013)) as compared to Station 3 (0.912 (December 2013) to 2.431 (February 2013)). Interestingly, at both stations diversity was maximum during the pre monsoon period (Table 3). Species evenness being a measure of the relative contributions of individual species to the total population, 5
varied from 0.814 (May 2013) to 0.953 (August 2013) at Station 1 and 0.382 (Novem-ber 2013) to 0.976 (May 2013) at Station 3 respectively. (Table 3). Thus, a decrease in the species evenness indicated the possibility of single species dominance which was clearly evident when species likeThalassiosirasp. andNaviculasp. accounted for about 40–50 % of the total population during post monsoon (Table 3). Results further 10
show that the phytoplankton population at station 1 was mostly dominated byNitzschia sp. (Table 3). Another dominant species in our study area was Thalassiosirasp. with ubiquitous presence during the entire study period from pre monsoon to post monsoon at both stations (Bhattacharjee et al., 2013). This was the most abundant species at station 3 and persistently remained the same for most part of our sampling efforts (Ta-15
ble 3). Monthly data from station 3 showed that in September 2013 (monsoon)Navicula sp. began to dominate the population and made up to 26.9 % of the population. In the subsequent months, this trend persisted and accounted for 53.68 % of the population in November 2013. The significant presence ofNavicula sp. was also recorded in De-cember 2013 although it was not the most abundant species and made up to 23.22 % 20
of the total phytoplankton population. Thus, based upon cell count data, four major taxa (Thalassiosirasp.,Naviculasp.,Nitzschia sp.,Skeletonema costatum) were identified as the primary contributors to the total phytoplankton abundance at our study area.
3.5 Analysis of eukaryotic phytoplankton community byrbcL clone library
ap-proach 25
(Gen-BGD
12, 2307–2355, 2015Relationship between N : P : Si ratio and
phytoplankton
A. K. Choudhury and P. Bhadury
Title Page
Abstract Introduction
Conclusions References
Tables Figures
◭ ◮
◭ ◮
Back Close
Full Screen / Esc
Printer-friendly Version Interactive Discussion
Discussion
P
a
per
|
Discussion
P
a
per
|
Discussion
P
a
per
|
Discussion
P
a
per
|
Bank/EMBL/DDBJ). Bacillariophyceae like rbcL sequences (>84 % of total 64 rbcL type ID clones) dominated clone libraries in the present study.
In the post monsoon clone library (Stn3_Oct_12_), 28 of 30 clones (>93 %) were Bacillariophyceae like sequences (97–100 %) whereas 1 clone (Stn3_Oct12_Clone43) showed sequence identity with Cryptophyceae like rbcL sequences. Another clone 5
(Stn3_Oct12_Clone69) separated out as a divergent lineage in the phylogenetic tree and showed only 89 % sequence identity with reported rbcL like amino acid se-quences available in databases. On the other hand, in the pre monsoon clone li-brary (Stn 3_Mar13_), 24 out of 30rbcL clones (80 %) showed sequence identity with cultured and uncultured Bacillariophyceae like rbcL sequences (97–100 % at amino 10
acid level) whereas 5 clones and 1 clone showed significant identity with published rbcL sequences of Cryptophyceae and Haptophyceae. For the monsoon clone library (Stn3_Aug13_), even though 6rbcL clones were sequenced, only 4 clones were taken into consideration for phylogenetic analyses as 2 clones showed sequence identity with published type IA/BrbcL uncultured marine phototrophic eukaryotic sequences. Thus, 15
out of the 4 clones, 2 clones showed identity with Bacillariophyceae like sequences whereas other 2 showed identity with Cryptophyceae like sequences (Supplement data II).
A phylogenetic tree based on the NJ approach revealed that in case of Bacillario-phyceae clade, 4 different major subclades were observed. The largest subclade con-20
sisted of 19 clones, of which 10 clones represented post monsoon (Stn3_Oct12_), 7 clones represented pre monsoon (Stn3_Mar13_) and 2 clones were representatives of monsoon samples (Stn3_Aug13_) with close phylogenetic affiliation withAmphora montana TCC477 (Acc. No. AGG86629) and A. caribaea (Acc. No. AHX02804) like rbcL sequences, representing the order Thalassiophysales.
25
BGD
12, 2307–2355, 2015Relationship between N : P : Si ratio and
phytoplankton
A. K. Choudhury and P. Bhadury
Title Page
Abstract Introduction
Conclusions References
Tables Figures
◭ ◮
◭ ◮
Back Close
Full Screen / Esc
Printer-friendly Version Interactive Discussion
Discussion
P
a
per
|
Discussion
P
a
per
|
Discussion
P
a
per
|
Discussion
P
a
per
|
Stn3_Mar13_) that clustered withrbcL sequences of cultured diatoms, namely Minuto-cellus polymorphusCCMP497 (Acc. No. AEB91188),Leyanella arenariaR23 (Acc. No. AEP69260),Papiliocellulus simplex CS431 (Acc. No. AEB91250) from Cymatosirales and several unculturedrbcL sequences previously reported from Gulf of Mexico (West Florida Shelf), Monterey Bay (California), northern South China Sea, Daya Bay (China) 5
as well as from Chemaguri creek and Mooriganga estuary of Indian Sundarbans. Finally, 7 clones from both pre monsoon (Stn3_Mar13_) and post monsoon (Stn3_Oct12_) grouped together with rbcL sequences of cultured centric diatoms like Thalassiosira minima (Acc. No. ABF60355), Discostella stelligera (Acc. No. ABF60389), Thalassiosira nodulolineata (Acc. No. ABF60345), Lithodesmium intri-10
catum (Acc. No. AEB91298) belonging to the order Thalassiosirales and several uncultured rbcL sequences previously targeted from both Chamaguri creek and Mooriganga estuary of Indian Sundarbans. Three clones (Stn3_Mar13_Clone 15, Stn3_Mar13_Clone06 and Stn3_Oct12_Clone58) separated out and clustered only with clones previously recorded from Chemaguri creek, Sundarbans suggesting that 15
these sequences are novel in nature and possibly unique to this estuarine mangrove habitat (Supplement data II).
The second dominant clade in the phylogenetic tree was represented by 8 clones that grouped with Cryptophyceae likerbcL sequences. Out of 8rbcL clones, 5 clones were from pre monsoon library (Stn3_Mar13_), 3 clones represented monsoon clone 20
library (Stn3_Aug13_) whereas 1 clone was from post monsoon period (Stn3_Oct12_) showing close phylogenetic affiliation withrbcL sequence ofTeleaulaxsp. TUC-2 (Acc. No. BAD42424) and other uncultured rbcL sequences previously reported from vari-ous coastal ecosystems such as the L4 site of English Channel, Monterey Bay (Cali-fornia), northern South China Sea as well as from Chemaguri creek and Mooriganga 25
BGD
12, 2307–2355, 2015Relationship between N : P : Si ratio and
phytoplankton
A. K. Choudhury and P. Bhadury
Title Page
Abstract Introduction
Conclusions References
Tables Figures
◭ ◮
◭ ◮
Back Close
Full Screen / Esc
Printer-friendly Version Interactive Discussion
Discussion
P
a
per
|
Discussion
P
a
per
|
Discussion
P
a
per
|
Discussion
P
a
per
|
from English Channel, L4 site, Monterey Bay (California) as well as Sundarbans man-grove ecoregion that represented Haptophyceae population in this area as evident from phylogenetic tree (Supplement data II).
3.6 Variations in cellular biovolumes and C content of dominant taxa
As mentioned in the previous section, cellular biovolumes and carbon contents were 5
determined for dominant phytoplankton taxa (Skeletonema costatum, Thalassiosira sp.,Naviculasp. andNitzschiasp.). Interestingly, spatial patterns were evident as cen-tric diatom taxa had higher biovolumes and C content (S. costatum,Thalassiosirasp.) in estuarine station (Station 3) relative to creek station (Station 1). An opposite pattern was observed for pennate diatom taxa (Naviculasp. andNitzschiasp.) in both the sta-10
tions (Table 4). Some seasonal changes were also observed where a gradual increase in C content was recorded both the pennate taxa from pre monsoon to post monsoon through monsoon in station 1. However, cellular C content for S. costatum, Thalas-siosirasp. andNitzschiasp. showed a gradual decreasing trend from pre monsoon to post monsoon. Even though both spatial and temporal changes were observed, spatial 15
variations were more pronounced. The cellular C content forThalassiosirasp. changed by 40–45 % between stations, being more pronounced inNitzschia sp. that altered by 4.5–62 % between the two stations on a seasonal basis. A plot between nutrient con-centrations and cellular C contents of dominant phytoplankton species in the creek (Navicula sp., Nitzschia sp. and Thalassiosira sp.) (Fig. 7a–c) and estuarine stations 20
(Thalassiosira sp. and Nitzschia sp.) revealed that there was an apparent increasing trend in cellular C content during periods of high N : P ratio at the estuarine station with no such general pattern at the creek station (Fig. 7d and e).
3.7 Relationship between species composition and environmental variables
CCA (Canonical Correspondence Analyses) were performed for each of the creek and 25
se-BGD
12, 2307–2355, 2015Relationship between N : P : Si ratio and
phytoplankton
A. K. Choudhury and P. Bhadury
Title Page
Abstract Introduction
Conclusions References
Tables Figures
◭ ◮
◭ ◮
Back Close
Full Screen / Esc
Printer-friendly Version Interactive Discussion
Discussion
P
a
per
|
Discussion
P
a
per
|
Discussion
P
a
per
|
Discussion
P
a
per
|
lected environmental variables. Physical parameter like salinity and light attenuation coefficient along with chemical parameters like orthophosphate, silicate and molar ra-tio of DIN–DIP and DIN–DSi largely explained the variara-tion in phytoplankton assem-blage in both stations. However, with respect to other environmental parameters, the importance of each variable was spatially different.
5
In creek station (Station 1), the first two significant canonical roots explained 52.3 % of the observed variance within the dataset (Fig. 8a, Table 5). The 1st canonical root separated species (explained 33.8 % of variance) mainly on the basis of nutrient sta-tus of the habitat whereas the 2nd canonical root (18.5 % of variance) distinguished species on the basis of nutrient molar ratio (negatively) and physical parameters. 10
Species likeCyclotellasp. (15),Pinnulariasp. (31),Leptocylindrussp. (29),Cocconeis sp. (21), Cymbella sp. (28), Gyrosigma sp. (6) and Triceratium sp. (30) grouped to-gether with nitrate and silicate as well as SPM load and Light attenuation coefficient. This would suggest that under high nutrient availability these species tend to proliferate under low light conditions brought about by increased light attenuation because of high 15
SPM load. In the other quadrat rare species likeBollerochea sp. (3), Cerataulinasp. (4) and more abundant species likeThalassionemasp. (13) andThalassiothrixsp. (14) showed a preference for conditions of high ammonia where molar ratio of DIN–DIP and DIN–DSi seemed to play regulatory role as well. Apparently since these species had an affinity towards ammonia, the other nutrients seem to play an indirect but less 20
important role in determining the contribution of these species to the phytoplankton community composition. The dominant species of the study area likeThalassiosirasp. (2),Amphora sp. (19),Campylodiscussp. aligned very closely with temperature, sug-gesting the preference towards higher temperature. However, the lengths of vectors for air (AT) and water temperature (WT) indicate temperature as a less important vari-25
BGD
12, 2307–2355, 2015Relationship between N : P : Si ratio and
phytoplankton
A. K. Choudhury and P. Bhadury
Title Page
Abstract Introduction
Conclusions References
Tables Figures
◭ ◮
◭ ◮
Back Close
Full Screen / Esc
Printer-friendly Version Interactive Discussion
Discussion
P
a
per
|
Discussion
P
a
per
|
Discussion
P
a
per
|
Discussion
P
a
per
|
their abundance were more influenced by freshwater inflow and seasonal precipitation rather than marine water brought about by tidal actions.
In the estuarine station (Station 3), first two canonical roots explained 51.7 % of the cumulative variance. Unlike Station 1, here neither of the canonical roots can be con-sidered for explaining any specific property of the habitat (Fig. 8b, Table 5). However, 5
species specific alignments remained independent of salinity suggesting that even though it was an important property of the habitat, the species were not affected which would suggest the euryhaline nature of the phytoplankton community. There were two major groups of which the first group composed of 11 taxa that showed positive re-sponse towards condition of high silicate availability under low light conditions (high 10
Kt) where species likeCyclotellasp. (6),Thalassionemasp. (7) andGyrosigmasp. (8)
similar response to that of the creek station. The other important taxa in this group were Coscinodiscusspp. (1, 27),Nitzschia spp. (3, 9),Bacillariasp. (5) and the exclusively marine species (Ditylum brightwelli(10)) even though their alignments to environmen-tal variables were different from the creek station. The other major cluster constituted of 15
10 taxa of which 4 pennate taxa namelyNaviculasp. (14),Fragilariasp. (21),Nitzschia sp. (23) andN. longissima(25) aligned with pH as was observed for Station 1, suggest-ing pH of habitat as the primary determinant of their abundance. Likewise,Amphiprora sp. (16) and Pleurosigma sp. (15) showed a preference towards conditions of high DIN–DSi that was similar to what was observed from CCA plot of Station 1.
20
If we consider CCA plots as indicative representation of species specific responses to environmental conditions, only ten species showed almost similar response at both stations. Among them all taxa other than Cyclotella sp. were pennate which would suggest that pennate population were restrictive in their response to environmental conditions thereby making them less adaptive to diversity and temporal changes of 25
BGD
12, 2307–2355, 2015Relationship between N : P : Si ratio and
phytoplankton
A. K. Choudhury and P. Bhadury
Title Page
Abstract Introduction
Conclusions References
Tables Figures
◭ ◮
◭ ◮
Back Close
Full Screen / Esc
Printer-friendly Version Interactive Discussion
Discussion
P
a
per
|
Discussion
P
a
per
|
Discussion
P
a
per
|
Discussion
P
a
per
|
4 Discussion
The hydrological parameters of the study area especially with respect to water tem-perature and salinity were typical for tropical coastal estuary with distinct seasonal patterns. The low spatial variations in salinity profiles at both stations confirm the ap-parent inter connection between these stations with greater influence of marine water 5
in the estuarine habitat. In contrast, the drop in salinity and consequent “freshening up” during periods of seasonal precipitation was more evident at the creek station that implied the greater proximity of freshwater sources at creek station. Thus, with respect to salinity levels, these two habitats largely represent transitional water affected by tidal actions that cannot be segregated as distinctly freshwater or estuarine in nature. The 10
pH was weakly alkaline which is expected for a tidally influenced estuary.
Nutrient concentrations fluctuated on a temporal scale primarily with regard to ni-trate, phosphate and silicate concentrations. Such high concentrations of major nu-trients apparently seem to be an important property not only for Sundarbans but for other mangrove ecosystems located across South East Asia (Talane-McManus et al., 15
2001). Works from different estuaries have suggested that the concentration of nutri-ents like nitrate and silicate are often several times higher than the receiving coastal water as was found for Amazon River (Edmond et al., 1981), Missisippi River (Dortch and Whitledge, 1992; Rabalais et al., 1996) and in the freshwater region of Chesa-peake Bay (Ward and Twilley, 1986; Fisher et al., 1988). However, unlike other estuar-20
ies, ecoregions at the land ocean interface like the Sundarbans mangrove show com-paratively more temporal variations due to localised influences like agricultural runoffs, non point discharges from anthropogenic sources and aquacultural farms. The influ-ences of runoffs can be testified from the findings that DIN (nitrate and ammonia) levels were maximum during monsoon when localised runoffs were higher as compared to 25
BGD
12, 2307–2355, 2015Relationship between N : P : Si ratio and
phytoplankton
A. K. Choudhury and P. Bhadury
Title Page
Abstract Introduction
Conclusions References
Tables Figures
◭ ◮
◭ ◮
Back Close
Full Screen / Esc
Printer-friendly Version Interactive Discussion
Discussion
P
a
per
|
Discussion
P
a
per
|
Discussion
P
a
per
|
Discussion
P
a
per
|
abundance is quite high in this area that therefore would possibly utilize oxygen to enzymatically convert ammonia to nitrite through nitrification (Dayal, 2013). The low availability of ammonia seems to contradict the general concept of eutrophication that is prevalent with regard to the habitat of the Sundarbans mangrove ecoregion.
Results further show that not only nutrients fluctuated on a temporal scale, but the 5
molar ratio of nutrients like N : P (Redfield ratio), N : Si changed as well. Apparently, although the nutrient levels varied significantly on a monthly basis, seasonally the nu-trient levels largely remained below the proposed Redfield ratio of 16 : 1 suggesting that neither N- nor P-limitation was prevalent at our study area. In monsoon there was a slight increase in N : P ratio which was mainly because of excess nitrogen inputs due 10
to anthropogenic activities and non point discharges.
Multivariate analysis of abiotic variables (PCA) not only revealed the inter relation-ship between the variables but plot of the cases further established the existence of well demarcated seasonal patterns of the habitat at both stations. Thus, seasonal diversity of habitat at our study area was well established, a condition that further questions the 15
general perception of the Sundarbans mangrove ecoregion to be eutrophic. Rather we would like to opine that nutrient concentrations were high at this area which may be-come eutrohic if nitrogen and phosphorus loadings remain unmonitored and continues to increase in recent future, primarily due to anthropogenic activity.
Analysis of the phytoplankton community revealed that it was largely composed of 20
similar taxa at both stations, further supporting our opinion of transitional water of this area. Comparisons of microscopic observations suggest that through the years, even though the basic the phytoplankton population were similar, inter annual varia-tions were significant in the phytoplankton community composition as revealed from some previous work from this area (Bhattacharjee et al., 2013). However, such con-25
BGD
12, 2307–2355, 2015Relationship between N : P : Si ratio and
phytoplankton
A. K. Choudhury and P. Bhadury
Title Page
Abstract Introduction
Conclusions References
Tables Figures
◭ ◮
◭ ◮
Back Close
Full Screen / Esc
Printer-friendly Version Interactive Discussion
Discussion
P
a
per
|
Discussion
P
a
per
|
Discussion
P
a
per
|
Discussion
P
a
per
|
and molecular approach. Observation of dinoflagellate taxa was highly restrictive and appeared only in periods when temperature and salinity profiles favoured their growth and proliferation. Thus,Prorocentrum micans, a bloom forming species was recorded in our sampling efforts only once on when maximum water temperature (39◦C) was recorded in the study area (5 April 2013). Sequencing efforts also showed the pres-5
ence of Phaeocystis like rbcL sequences, another bloom forming haptophyte which has been reported from previous studies (Bhattacharjee et al., 2013; Samanta and Bhadury, 2014).
TherbcL clone library work although preliminary in nature, strongly support our find-ings of microscopic studies, suggesting that the eukaryotic phytoplankton population 10
were represented by similar taxa, although temporal and inter annual variations were evident. Temporal patterns were clearly observable where a less dominant order Nav-iculales (Samanta and Bhadury, 2014) that made up only 4 % of the clone library in 2010–2011 started to dominate the clone libraries in 2012–2013. However, database search separated out Naviculales in the present study where some new sequences 15
were added as Halamphora spp., which segregated our clones with Amphora like sequences under Naviculaes and Thalassiophysales, previously grouped only under Thalassiophysales (Stepanek and Kociolek, 2014). The grouping ofHalamphoraspp. and Amphora spp. like sequences in the same cluster indicate that the amino acid sequences specific torbcL gene did not resolve Naviculales and Thlassiophysales as 20
a separate clade. However, even though clone library work reported Thalassiophysales to dominate the phytoplankton community, very fewAmphoraspp. were observed mi-croscopically possibly because of the small size of these taxa (9–15 µm (Krasske, 1932); 12–20 µm (Stepanek and Kociolek, 2011)). Interestingly, significant sequence identity were observed with both Mooriganga estuary and Chemaguri creek uncul-25
BGD
12, 2307–2355, 2015Relationship between N : P : Si ratio and
phytoplankton
A. K. Choudhury and P. Bhadury
Title Page
Abstract Introduction
Conclusions References
Tables Figures
◭ ◮
◭ ◮
Back Close
Full Screen / Esc
Printer-friendly Version Interactive Discussion
Discussion
P
a
per
|
Discussion
P
a
per
|
Discussion
P
a
per
|
Discussion
P
a
per
|
the ubiquitous existence of eukaryotic phytoplankton communities across a wide range of habitat. The detection of novelrbcL sequences as revealed by phylogeny indicates the presence of unique phytoplankton taxa that may have adapted themselves to this ecosystem. One such new species, a centric diatom Thalassiosira sundarbana has been recently identified and described from this ecosystem (Samanta and Bhadury, 5
2015).
Even though observable seasonal variability of habitat was found, it can be said that the eukaryotic phytoplankton community was more resilient to both spatial and tem-poral changes in response to the general water quality of the habitat. It was further revealed through sequencing efforts that inter annual changes were low in the eu-10
karyotic phytoplankton community (Bhattacharjee et al., 2013; Samanta and Bhadury, 2014) which would indicate strong environmental filtration. In other words, the environ-ment exerts its influence in selecting specific traits that are shared by phylogenetically related species which complements the habitat of our study area (Webb et al., 2002).
As observed in CCA, the responses of individual taxa to different variables indi-15
cate that the physiological requirement of phytoplankton population largely regulated their proliferation in a habitat, rather the habitat imparting any effect on the popula-tion. In the previous section it has been established that the habitats of either station did not vary much and were transitional water affected by tidal influences. However, there was distinct seasonal diversity of the environmental conditions of the habitat as 20
was revealed from PCA plot of cases, although the phytoplankton community did not show such well defined seasonal patterns. Studies have shown that interactive effects between temperature and light (Novak and Brune, 1985), salinity (Cho et al., 2007), nutrient concentrations (Maddux and Jones, 1964) can shift the optimum temperature for growth thereby altering species specific responses. In both the CCA plots, even 25
BGD
12, 2307–2355, 2015Relationship between N : P : Si ratio and
phytoplankton
A. K. Choudhury and P. Bhadury
Title Page
Abstract Introduction
Conclusions References
Tables Figures
◭ ◮
◭ ◮
Back Close
Full Screen / Esc
Printer-friendly Version Interactive Discussion
Discussion
P
a
per
|
Discussion
P
a
per
|
Discussion
P
a
per
|
Discussion
P
a
per
|
distribution data ofrbcL clone library work in the present study.The apparent adaptabil-ity of the phytoplankton communadaptabil-ity to salinadaptabil-ity variations were further established from biogeographic distribution, as revealed from clone library data. Thus, in disagreement with general idea about Sundarbans, we would propose that it is the functional trait and corresponding elemental stoichiometry of phytoplankton species/groups that de-5
termined the phytoplankton community composition at our study area (Ho et al., 2003; Quigg et al., 2003; Klausmeier et al., 2004; Arrigo, 2005) rather than eutrophication and related changes in the habitat.
As a further testimony to our opinion, our observations show that there was an in-crease in cellular biovolume for centric taxa (Skeletonema costatum,Thalassiosirasp.) 10
by 2.6–45 % (Table 4) at the estuarine station as compared to the creek station. This was possibly because under such conditions of fluctuating nutrient at our study sta-tions, larger sized diatom species with increased nutrient storage capacity in vacuoles (Pahlow et al., 1997) are better adapted to this environment, a phenomenon pertain-ing to “luxury consumption.” Moreover, the nutrient profile especially with respect to 15
N : P ratio was intricately balanced and complied well with the theory of Redfield ratio, although at times it did reach the benchmark of 16 : 1. However, the consistencies of populations with no large and sudden change especially with regard to HAB (Harm-ful Algal Bloom) forming species indicate towards the adaptability to fluctuations in N : P ratio. This complements well with previous works where phytoplankton growth 20
has been demonstrated to occur over a wide range of N : P ratios, ranging from 5 to 34 (Geider and La Roche, 2002). The wide range of environmental N : P ratios in which phytoplankton can grow is a reflection of the highly variable elemental stoichiometry of phytoplankton species/groups. Thus we would agree with the idea that the canonical Redfield N : P ratio of 16 is not a universal biochemical optimum, but instead represents 25
BGD
12, 2307–2355, 2015Relationship between N : P : Si ratio and
phytoplankton
A. K. Choudhury and P. Bhadury
Title Page
Abstract Introduction
Conclusions References
Tables Figures
◭ ◮
◭ ◮
Back Close
Full Screen / Esc
Printer-friendly Version Interactive Discussion
Discussion
P
a
per
|
Discussion
P
a
per
|
Discussion
P
a
per
|
Discussion
P
a
per
|
5 Conclusion
In conclusion we can say that even though nutrient concentrations at our study area were high, the general perception of Sundarbans being eutrophic does not hold true at our study area. As per the Oslo–Paris convention (OSPAR, 2009), eutrophication is not only about nutrient concentrations but includes other features like bloom formation 5
and hypoxia which was not observed in our study area. The water quality with respect to Redfield ratio and phytoplankton community do not indicate eutrophication, the per-sistent high N loadings due to anthropogenic and localized influences can render eu-trophication of habitat in the near future. Since the recent concept of functional traits and elemental stoichiometry holds true for phytoplankton population of this area, an in-10
crease in N loadings may promote selected group of phytoplankton, thereby decreasing diversity of this area. Since this trait based approach has not been much worked out for phytoplankton in this part of the world, especially under natural conditions, we would fo-cus in understanding how individual species isolated from this ecoregion may possibly respond to higher N loadings through experimental approach in our future work. This 15
would possibly allow us to predict “true eutrophication” by analyzing the phytoplank-ton community composition of the Sundarbans mangrove ecoregion. Such predictive analyses will be helpful in implementing necessary measures to sustain and conserve the water quality and minimize the incidence of eutrophication of our study area and Sundarbans as a whole.
20
The Supplement related to this article is available online at doi:10.5194/bgd-12-2307-2015-supplement.
Acknowledgements. Avik Kumar Choudhury is the recipient of Department of Biotechnology,
Govt. of India Research Associateship Programme (DBT-RA). This work is supported by grants awarded to Punyasloke Bhadury from the Ministry of Earth Science (MoES), Govt. of India
BGD
12, 2307–2355, 2015Relationship between N : P : Si ratio and
phytoplankton
A. K. Choudhury and P. Bhadury
Title Page
Abstract Introduction
Conclusions References
Tables Figures
◭ ◮
◭ ◮
Back Close
Full Screen / Esc
Printer-friendly Version Interactive Discussion
Discussion
P
a
per
|
Discussion
P
a
per
|
Discussion
P
a
per
|
Discussion
P
a
per
|
under MLRP program. The authors would like to thank Mayukh Das and Brajogopal Samanta for help with the nutrient and phylogenetic analyses respectively.
References
Ahlgren, G.: Temperature functions in biology and their application to algal growth constants, Oikos, 49, 177–190, 1987.
5
Arrigo, K. R.: Marine micro-organisms and global nutrient cycles, Nature, 437, 349–355, 2005. Basu, A. K. and Ghosh, B. B.: Observations on diurnal variations in some selected stretch of
the Hooghly estuary (India), Schweiz. Z. Hydrol., 32, 271–283, 1970.
Bhattacharjee, D., Samanta, B., Danda, A. A., and Bhadury, P.: Temporal succession of phyto-plankton assemblages in a tidal creek system of the Sundarbans mangroves – an integrated
10
approach, Int. J. Biodiv., ID824543, 15 pp., 2013.
Biswas, H., Mukhopadhyay, S. K., De, T. K., Sen, S., and Jana, T. K.: Biogenic controls on the air-water carbon dioxide exchange in the Sundarban mangrove environment, northeast coast of Bay of Bengal, India, Limnol. Oceanogr., 49, 95–101, 2004.
Biswas, H., Dey, M., Ganguly, D., De, T. K., Ghosh, S., and Jana, T. K.: Comparative analysis
15
of phytoplankton composition and abundance over a two-decade period at the land ocean boundary of a tropical mangrove ecosystem, Estuar. Coast., 33, 384–394, 2010.
Boesch, D. F.: Challenges and opportunities for science in reducing nutrient over-enrichment of coastal ecosystems, Estuaries, 25, 744–758, 2002.
Boesch, D. F., Field, J. C., and Scavia, D.: The Potential Consequences of Climate Variability
20
and Change on Coastal Areas and Marine Resources. A Report of the National Assess-ment Group for the US Global Change Research Program, NOAA Coastal Ocean Program Decision Analysis Series No. 21, National Oceanic and Atmospheric Administration.
Boström, K. H., Simu, K., Hagström, A., and Riemann, L.: Optimization of DNA extraction for quantitative marine bacterioplankton community analysis, Limnol. Oceanogr.-Meth., 2, 365–
25
373, 2004.
Briand, J. F., Leboulanger, C., Humbert, J. F., Bernard, C., and Dufour, P.:Cylindrospermopsis
raciborskii(Cyanobacteria) invasion at mid-latitudes: selection, wide physiological tolerance,