Submitted12 November 2014
Accepted 3 November 2016
Published20 December 2016
Corresponding author
Aine M. Gormley-Gallagher, a.m.gormley-gallagher@rug.nl
Academic editor
Jack Stanford
Additional Information and Declarations can be found on page 22
DOI10.7717/peerj.2749 Copyright
2016 Gormley-Gallagher et al.
Distributed under
Creative Commons CC-BY 4.0 OPEN ACCESS
Metal to phosphorus stoichiometries
for freshwater phytoplankton in three
remote lakes
Aine M. Gormley-Gallagher, Richard W. Douglas and Brian Rippey
School of Geography & Environmental Sciences, University of Ulster, Coleraine, United Kingdom
ABSTRACT
Simultaneous measurements of changes in phytoplankton biomass and the metal and phosphorus (P) content of cells have been captured to attest to metal to P stoichiometries for freshwater phytoplankton. Three Scottish lakes that had received high, medium or low metal contamination from the atmosphere were selected for study. Phytoplankton cells were collected and Inductively Coupled Plasma-Mass Spectrometry was used to measure their lead (Pb), cadmium (Cd), mercury (Hg), copper (Cu), zinc (Zn), nickel (Ni), chromium (Cr), manganese (Mn), cobalt (Co) and P content. In-creased phytoplankton growth in the lakes resulted in significant algae growth dilution of the mass-specific Pb, Cd, Hg, Cu, Ni and Cr in the phytoplankton. Changes in the phytoplankton cell count and their Hg, Pb, Cd, Cu, Mn, Co, Ni and Cr concentrations showed the process of algae bloom dilution to be subject to exponential decay, which accelerated in the order of Mn < Cu < Ni < Pb and Cd < Cr and Hg < Co. This indicated a metabolic and detoxification mechanism was involved in the active selection of metals. For the first time simultaneous measurements of metals and P stoichiom-etry in freshwater phytoplankton are reported. The mean metal to P stoichiomstoichiom-etry generated was (C106P1N16)1000Pb0.019Hg0.00004Cu0.013Cd0.005Cr0.2Co0.0008Mn0.2Ni0.012 based on field measurements and the Redfield average C, N and P stoichiometry of (CH2O)106(NH3)16H3PO4.
SubjectsBiodiversity, Ecology, Ecosystem Science, Environmental Sciences
Keywords Metal, Phytoplankton, Phosphorus, Freshwater, Lakes, Stoichiometries, Scotland
INTRODUCTION
Phytoplankton cells are typically composed of carbon (C), nitrogen (N) and phosphorus (P) and have a commonly accepted average stoichiometry of (CH2O)106(NH3)16H3PO4 (Redfield, Ketchum & Richards, 1963;Sanudo-Wilhelmy et al., 2004). Phytoplankton can exploit iron (Fe), manganese (Mn), zinc (Zn), copper (Cu) and nickel (Ni) for N acquisition, oxygen cycling, chlorophyll synthesis, and sulfate reduction (Moffett et al., 1997;Twining, Baines & Fisher, 2004). These nutrient metals can be replaced at their metabolic site by micronutrient metals such as cadmium (Cd), mercury (Hg), lead (Pb) and chromium (Cr) (Bruland, Knauer & Martin, 1978;Sunda & Huntsman, 1998).
1Sulphur (S), potassium (K), magnesium
(Mg), calcium (Ca), strontium (Sr), cobalt (Co), molybdenum (Mo).
dissociate back into solution or travel into the cytoplasm (Sunda & Huntsman, 1998). This has been reported as a dominant process of trace metal removal from solution (Whitfield, 2001; Lohan et al., 2005). Alternatively, cellular metal uptake may also occur through transport proteins or porins that are embedded in the outer membrane and allow for non-selective passive diffusion of metal ions across the outer membrane (Ma, Jacobsen & Giedroc, 2009).
Due to the realisation of the proclivity of metals to bind non-specifically to cell surfaces, studies have extended the concept of Redfield et al.’s nutrient stoichiometry to include metals. Ho et al. (2003) calculated a mean stoichiometry (mol:mol) of (C124N16P1S1.3K1.7Mg0.56Ca0.5)1000Sr5.0Fe7.5Zn0.80Cu0.38Co0.19Cd0.21Mo0.03,1 while Twining, Baines & Fisher (2004)found (C72P1S0.70)1000Zn5.4Fe1.8Ni0.61Mn0.26for marine phytoplankton. Research has identified the risk posed to ecosystems and humans via toxic metal accumulation by phytoplankton with consequential transfer through the aquatic food chain (UNECE, 1998;Chen & Folt, 2000;Schultz & Seaward, 2000). As a result, the United Nations Economic Commission for Europe adopted the Heavy Metals Protocol to encourage modelling, research and descriptions of metal pathways (UNECE, 1998). Yet simultaneous measurements of metal to nutrient stoichiometry in freshwater phytoplankton have only been estimated (Wang & Dei, 2006).
WhenReynolds & Hamilton-Taylor (1992)calculated stoichiometries of C106P1Zn0.034 for Lake Windermere, United Kingdom (UK), they estimated P based on regressions of dissolved P concentrations and the C: Si atomic ratio of 1:0.40 in phytoplankton cells. Likewise,Sigg (1985)andSigg, Sturm & Kistler (1987)presented mean stoichiometries of C113P1Zn0.06Cu0.008 and (CH2O)106(NH3)16H3PO4Cu0.0006Zn0.03for the phytoplankton of Lake Constance and Lake Zurich (Switzerland) respectively. However, the mean surface areas of the algae cells were estimated from correlation of the organic material content of the settling particles using typical cell dimensions of diatoms. Sigg therefore acknowledged that the stoichiometries are approximations that could vary if different algal species were taken into account.
Another mechanism (in addition to the influence of surface communities) that has been proposed to explain variations in metal to nutrient stoichiometries in phytoplankton is algae bloom density dilution. If phytoplankton share a finite pool of metals and have a constant uptake, enhanced lake productivity reduces metal concentrations per unit mass of phytoplankton (Chen & Folt, 2005). Additionally, if the trace element to macronutrient (i.e., phosphorus or carbon) ratios is a balance of net steady-state uptake and growth rates (Sunda & Huntsman, 1997;Sunda & Huntsman, 2004)—growth rates will increase as nutrients become more available, inducing a decline in cellular element to nutrient ratios. This suggests that, because P is a limiting nutrient for phytoplankton growth, increased cellular P would correlate with a decline in cellular metal concentrations.
prediction (Di Toro et al., 2002). The models assumed a fixed rate of metal uptake occurred according to ambient concentrations, thus they were extended to include ambient water chemistry (Paquin et al., 2002).De Schamphelaere et al. (2005)then showed that cellular metal concentrations were better than ambient metal concentrations for predicting the threat of toxicity to freshwater phytoplankton. They stressed that cell surfaces should be used as the ligand for metals in the same way as fish gills apply to the BLM for predicting metal toxicity to fish species.Wang & Dei (2006)then showed that the metal to nutrient stoichiometry in phytoplankton cells better predicts metal toxicity than cellular metal burden. Determining what biogeochemical characteristics influence toxic metal uptake and accumulation in the aquatic food chain is important for identifying communities and species at risk of adverse impacts from metal contamination—and for developing management strategies to mitigate this risk (Ward et al., 2010).
The need for a simultaneous measurement of metal to nutrient (in this case P) stoichiometry in freshwater phytoplankton will be addressed in this contribution. Our underlying hypothesis is that cellular metal to P ratios decline as P becomes more available—and thus the dilution of metals in freshwater phytoplankton is a function of increased phytoplankton growth.
SITE DESCRIPTIONS
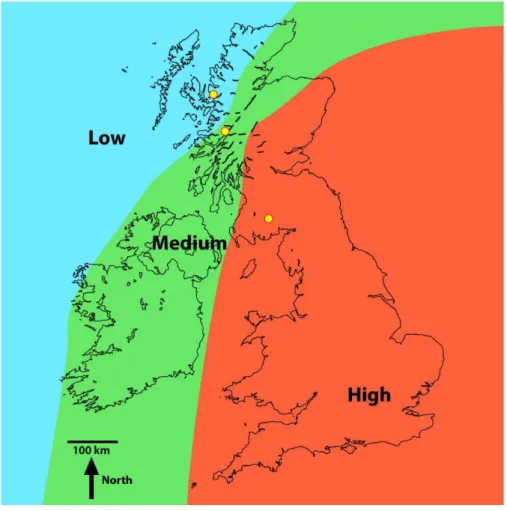
Investigations were undertaken in three UK lakes that have received varying degrees of metal contamination from the atmosphere (Rippey & Douglas, 2004). One lake was selected in each of the high, medium and low metal contaminated regions (Fig. 1). The three lakes receive metal contamination solely from atmospheric deposition—and thus metal contamination from runoff or direct discharges would not influence our results (Murray, 1987;Rippey & Douglas, 2004). Additionally, the size and bathymetry of the lakes meant that regular sediment resuspension events (and by association high suspended particulate matter) would be unlikely to influence our investigation outcome (Hilton, 1985;Douglas & Rippey, 2000;Douglas, Rippey & Gibson, 2003;Gormley-Gallagher, Douglas & Rippey, 2015).
In the following site descriptions, lake surface area, perimeter, altitude, grid reference, catchment area, maximum basin relief, and distance from the sea and to the nearest village were calculated and/or obtained using the OS LandrangerR Memory-MapTMV5 edition (2006) for northern and southern Scotland (Licence number PU 100034184). The maximum lake depths were based on collected field data, while catchment geology, vegetation and soil type were derived from Patrick, Monteith & Jenkins (1995).
Loch Coire nan Arr has a surface area of 13.21 ha, a maximum lake depth of 11 m and a catchment area of 8.45 km2 (Table 1). It is the most northerly of the three sites and lies in the region of low metal contamination from the atmosphere (Fig. 1). Permission for sampling the site was obtained from The Applecross Trust, a conservation charity responsible for the management of the lake (contact:admin@applecross.org.uk).
Figure 1 Regions of high, medium and low Pb contamination of lake sediment due to atmospheric deposition (fromRippey & Douglas, 2004).The yellow circles in in the low, medium and high regions of contamination indicate the locations of Loch Coire nan Arr, Loch Doilet and Loch Urr, respectively
(Gormley-Gallagher, Douglas & Rippey, 2015).
is the largest of the three lakes and has received moderate metal contamination from the atmosphere (Fig. 1). The catchment rises from the lake to a peak of approximately 720 m. Permission for sampling the site was obtained from the Forestry Commission Scotland, a UK non-ministerial government department responsible for the management of the lake (contact:lochaber@forestry.gsi.gov.uk).
Loch Urr has a surface area of 47 ha with a maximum lake depth of 13 m (Table 1). It lies in the Dumfries and Galloway region of south-west Scotland, an area that has received high metal contamination from the atmosphere (Fig. 1). The lake drains the smallest of the three catchments with an area of 7.73 km2. Permission for sampling the site was obtained from the Urr District Salmon Fisheries Board (contact:mail@gallowayfisheriestrust.org).
SAMPLING
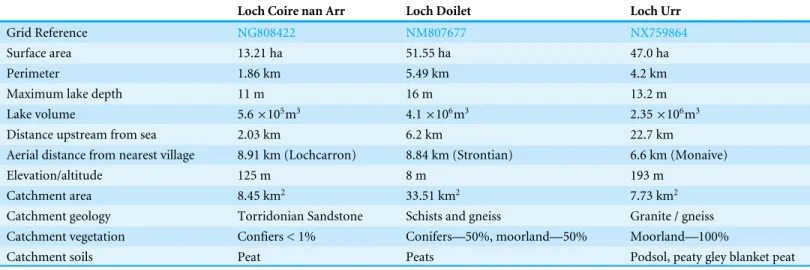
Table 1 Summary of the site characteristics of Loch Coire nan Arr in northwestern Scotland, Loch Doilet in western Scotland and Loch Urr in southern Scotland (Gormley-Gallagher, Douglas & Rippey, 2015).
Loch Coire nan Arr Loch Doilet Loch Urr
Grid Reference NG808422 NM807677 NX759864
Surface area 13.21 ha 51.55 ha 47.0 ha
Perimeter 1.86 km 5.49 km 4.2 km
Maximum lake depth 11 m 16 m 13.2 m
Lake volume 5.6×10⁵m3 4.1×10⁶m3 2.35×10⁶m3
Distance upstream from sea 2.03 km 6.2 km 22.7 km
Aerial distance from nearest village 8.91 km (Lochcarron) 8.84 km (Strontian) 6.6 km (Monaive)
Elevation/altitude 125 m 8 m 193 m
Catchment area 8.45 km2 33.51 km2 7.73 km2
Catchment geology Torridonian Sandstone Schists and gneiss Granite / gneiss Catchment vegetation Confiers < 1% Conifers—50%, moorland—50% Moorland—100%
Catchment soils Peat Peats Podsol, peaty gley blanket peat
of the three lakes. Before fieldwork, all sample containers were prepared to reduce metal contamination and prevent adsorption losses to the container walls (Yu et al., 2003).
During fieldwork, three lake water samples were collected from each lake. The first sample was for the analysis of chlorophyll-a, total phosphorus (TP) and pH. The second was for analysis of total metal concentrations. The third was for phytoplankton identification and calculations of biomass. The water was taken from a central location (6 m) near the deepest point of the lake using a Perspex Ruttner sampler, as recommended bySykes, Lane & George (1999).
(2004) and in the larger study from which this investigation stems (Gormley, 2008). Furthermore, given the sampling difficulty in collecting sufficient uncontaminated biomass for metal analysis, abating sample handling by separating the plankton assemblages in this manner in-situ was deemed critical to minimise the possibility of metal contamination (Ho et al., 2007).
The water samples collected for phytoplankton identification and biomass calculations were transferred on site from LDPE bottles to acid washed scintillation vials (25 ml) that were pre-prepared with glutaraldehyde (Electron Microscopy grade, EMS, Pennsylvania, USA) to produce a final concentration of 2% (v/v).
The net haul material was transferred to a total of 36 polyethylene acid cleaned sampling vials (32 ml) at each site (AGB Scientific Ltd., UK). The vials used to store the net haul material were also pre-prepared to achieve 2% glutaraldehyde in the sample, except in this case, the glutaraldehyde was passed through a Dowex 50-W X8-200 cation exchange resin (50X4-400; H-form) to remove trace metals (Twining, Baines & Fisher, 2004).
SAMPLE ANALYSIS
TP concentrations were measured spectrometrically after digestions at 882 nm (Murphy & Riley, 1962;Eisenreich, Bannerman & Armstrong, 1975). Chlorophyll-awas extracted from the filtered samples into 90% V/V methanol, and the detection was performed with a spectrophotometer set at an emission wavelength of 665 nm (Riemann, 1978). A Shimadzu UV-Mini 1240 Spectrophotometer was used for this at the Ulster University.
A Nikon-5400 inverted light microscope at 40×was used to examine the phytoplankton samples and identify the species present. For this, 10 ml of the lake water sample preserved in glutaraldehyde was allowed to sediment in a settling chamber for no less than 8 h. Blue– green and green algae organisms were identified following the interactive keys produced byWhitton et al. (2002)andWhitton, Balbi & Donaldson (2003). For those organisms that proved difficult to distinguish, a more detailed text was consulted, i.e.,John, Whitton & Brook (2002). The guidelines presented byKelly (2000)were followed to identify any cells representative of the Phylum Bacillariophyta and the Phylum Fragilariophyceae (Diatoms).
During identification, the species/genre/groups were also counted and measured for volume and surface area calculations following the procedures described byOlrik et al. (1998). At least 10 length and width measurements were recorded for each species (wall to wall), and when fewer than 10 cells were present, those present were measured. Cell counts were converted to counts per volume of lake water. Cell volumes and surface areas were calculated using the geometric equations ofHillebrand et al. (1999). The volume of colonial and filamentous cells was calculated from the volume of a single cell multiplied by the number of cells in each colony/filament. The surface area of cells per volume of lake water was then calculated following the guidelines ofOlrik et al. (1998).
The phytoplankton samples were made soluble (digested) by treatment with hydrofluoric, nitric and perchloric acid, following the acid digestion technique provided inBock (1979). An empty beaker (a reagent blank), and two samples of certified reference material (CRM) were included with every batch (between 20–30 samples). The CRM used for this study was Chinese stream sediment (GBW 07301) issued under the laboratory of the Government Chemist (LGC) trademark (LGC Promochem, UK). The digested samples were stored in acid cleaned 25 ml scintillation vials until further analysis with Inductively Coupled Plasma-Mass Spectrometry (ICP-MS).
The XSeriesI ICP-MS (ThermoFisher Scientific Cooperation) was used for the analysis of metals and P in the samples (Table S1). All prepared standard solutions, samples and blanks were acidified with 2% (w/v) HNO−3 (BDH Aristar, AGB Scientific Ltd., UK). The precision of every element was assessed from replicate and, when possible, triplicate analysis of reference material and of samples collected in fieldwork. This was found to be 5% relative standard deviation (RSD) or better, which is generally considered acceptable precision (Long, Martin & Martin, 1990). Also, instrument stability was indicated in the RSD of triplicate ICP-MS measurements for all analytes of less than 5% in all cases, and in many cases less than 2%.
RESULTS
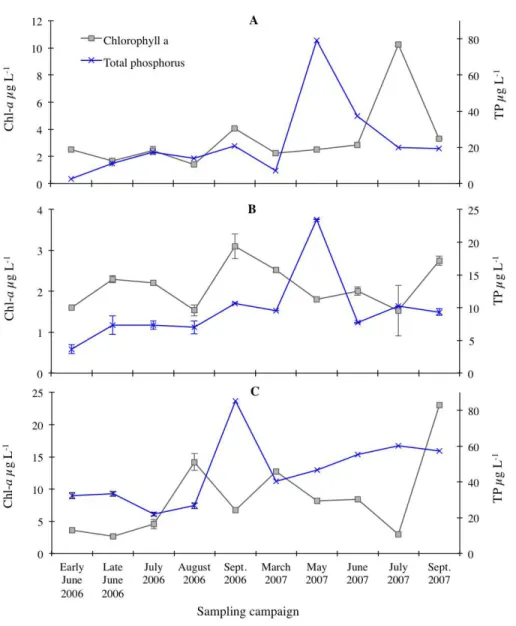
The measured concentrations of chlorophyll-a and TP and modelled chlorophyll-a concentrations based on OECD (1982)andPrairie, Duarte & Kalff (1989)models for predicting chlorophyll-abased on TP concentrations are presented inFig. 2. The peak of TP concentrations was recorded in mid-May 2007 for Loch Doilet (23.5µg/l) and Coire nan Arr (79.3µg/l), whereas the peak in Loch Urr (85.3µg/l) occurred in late September 2006. The chlorophyll-atrends inFig. 2 show a peak during August/September 2006 for Loch Doilet (3.10 µg/l) and September 2007 for Loch Urr (23.0µg/l), whereas the peak in Loch Coire nan Arr was during the month of July 2007 (10.25µg/l). The lowest chlorophyll-a concentrations were 1.4, 1.5 and 2.7µg/l respectively for Loch Coire nan Arr, Loch Doilet and Loch Urr. In many cases,Fig. 2shows that an increase in TP is followed by a rise in chlorophyll-a on the subsequent sampling occasion, particularly in Loch Coire nan Arr and Loch Urr. Also, the patterns of chlorophyll-agenerally show similar timing in their fluctuations to that of the predictions of chlorophyll-aconcentrations, notably in Loch Doilet.
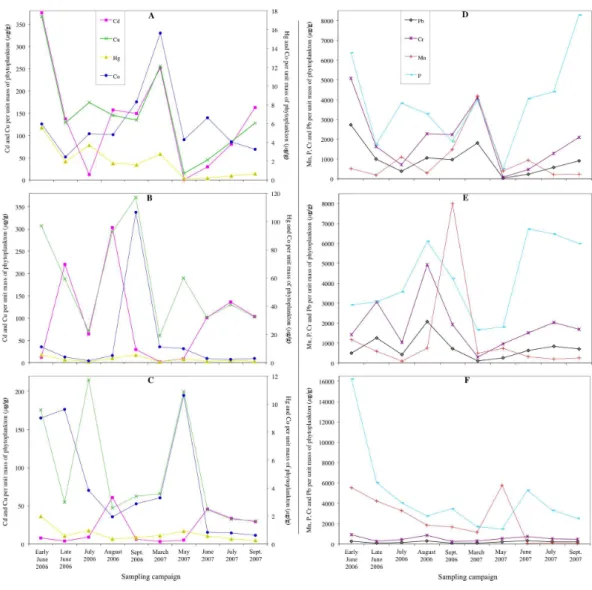
Figure 3shows the concentrations of Pb, Hg, Cd, Cu, Cr, Co, Mn and P determined per unit mass of the phytoplankton cells in Loch Coire nan Arr, Loch Doilet and Loch Urr. The trend lines show high fluctuation across the sampling dates from early June 2006 to September 2007. In the majority of cases the phytoplankton of Loch Urr held the lowest concentrations of metals, but the highest concentration of P in the cells.
Figure 2 Chlorophyll-a(Chl-a) and total phosphorus (TP) concentrations measured in Loch Coire nan Arr (A), Loch Doilet (B), and Loch Urr (C).The series keys located in the top left of the diagram ap-plies to each of the trend lines. Error bars are the standard error between the triplicate measurements of each result (n=3).
concentration of metals per unit mass of phytoplankton. Before completing the regression analysis inFig. 4, the Kolmogorov–Smirnov and Shapiro–Wilk’s tests on the normality of the (raw) data showed the TP concentrations and the mass-specific metal concentration in the phytoplankton to not be normally distributed (p<0.05). However, using the log-transformed metal concentrations and the cubic root of TP concentrations, the data showed normal distribution (p>0.05) in the Kolmogorov–Smirnov and Shapiro–Wilk’s tests.
Figure 3 Concentrations of Pb, Hg, Cd, Cu, Cr, Co, Mn and P determined per unit mass of the phyto-plankton cells collected in Loch Coire nan Arr, Loch Doilet, and Loch Urr.Concentrations of Hg, Cd, Cu and Co determined per unit mass of the phytoplankton cells collected in Loch Coire nan Arr (A), Loch Doilet (B), and Loch Urr (C). Concentrations of Mn, P, Cr and Pb determined per unit mass of the phyto-plankton cells collected in Loch Coire nan Arr (D), Loch Doilet (E), and Loch Urr (F). All values are inµg
of metal per g of phytoplankton. The series key located in the (A) diagram applies to A–C. The series key located in the (D) diagram applies to D–F.
relationship exists between TP and Pb (r= −0.823,p=0.00), Hg (r= −0.741,p=0.01), Cu (r= −0.748,p=0.00), Cd (r= −0.662,p=0.00), Cr (r= −0.837,p=0.00) and Ni (r= −0.532,p=0.02) per unit mass of phytoplankton in the lakes.
Figure 4 Correlation between Pb, Cd, Hg, Cr, Cu and Ni concentrations per unit mass of phytoplank-ton and TP concentrations.Correlation between Pb (A), Hg (B), Cu (C), Cd (D), Cr (E) and Ni (F) con-centrations per unit mass of phytoplankton and TP concon-centrations. The data was collected from the sam-ples of all three lakes during each sampling occasion (n=29).
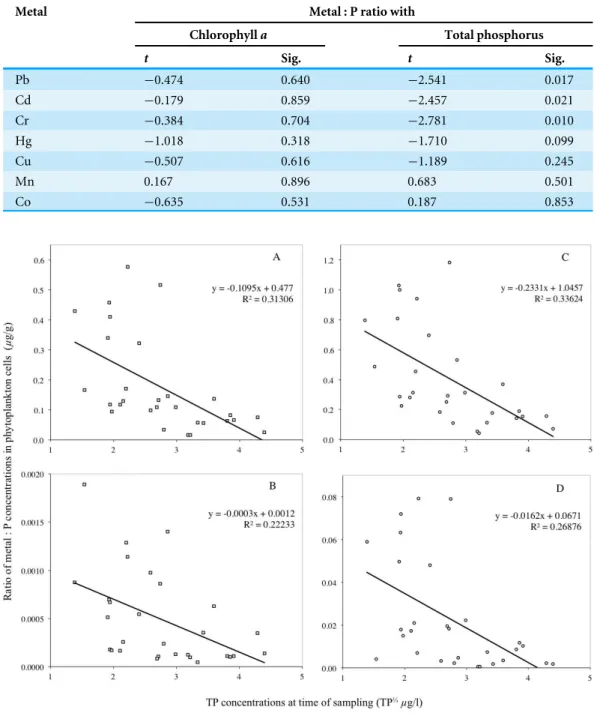
Table 2 summarises the results of the multiple regressions carried out using a combination of chlorophyll-a and TP (as the independent variables) against metal (Pb, Cd, Cr, Hg, Cu, Mn, Co) to P ratios per unit mass of phytoplankton cells (the dependant variable). An examination of the t-values inTable 2indicates that TP is a significant predictor of the variations in Pb:P, Cd:P and Cr:P ratios in cells at the 5% level, but chlorophyllaalone is not. For the Hg:P ratio in cells, TP is a significant predictor at the 10% level, but chlorophyll-aalone is not a significant predictor.
Table 2 Summary of the simultaneous multiple regression performed using chlorophyll-aand total phosphorus (TP) as independent variables and the metal (Pb, Cd, Cr, Hg, Cu, Mn, Co) to P ratios in phytoplankton cells from the three lakes as the dependant variable. Wherep<0.05, the relationship was significant at the 5% level, and wherep<0.10, the relationship is significant at the 10% level.
Metal Metal : P ratio with
Chlorophylla Total phosphorus
t Sig. t Sig.
Pb −0.474 0.640 −2.541 0.017
Cd −0.179 0.859 −2.457 0.021
Cr −0.384 0.704 −2.781 0.010
Hg −1.018 0.318 −1.710 0.099
Cu −0.507 0.616 −1.189 0.245
Mn 0.167 0.896 0.683 0.501
Co −0.635 0.531 0.187 0.853
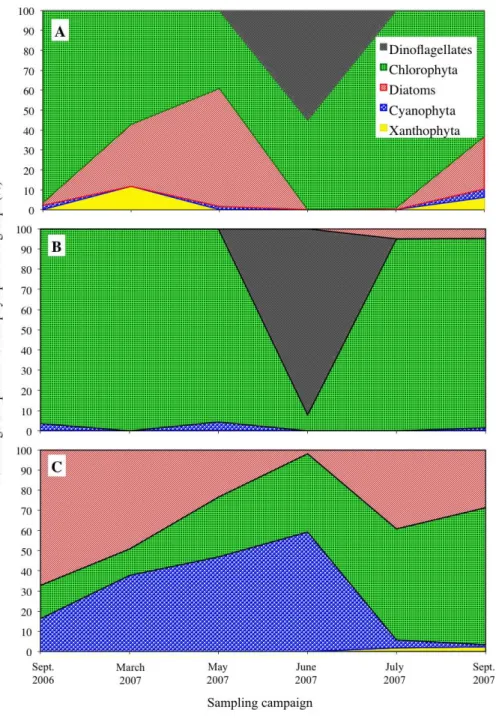
Figure 6 The dominant groups of phytoplankton (as a percentage of the total volume) in the three lakes.The percentage composition is presented for Loch Coire nan Arr (A), Loch Doilet (B) and Loch Urr (C). The series key located in diagram (A) applies to (A–C).
Figure 6shows the dominant groups of phytoplankton (as a percentage of the total volume), illustrating the shifts in species association of the phytoplankton over the sampling period. Among these, the dominant groups in Loch Coire nan Arr (Fig. 6A) were the Chlorophytes (particularlyCosmariumsp.) and the Dinoflagellates (particularly
Peridinium willei). In Loch Doilet (Fig. 6B), the Chlorophytes were also a dominant group,
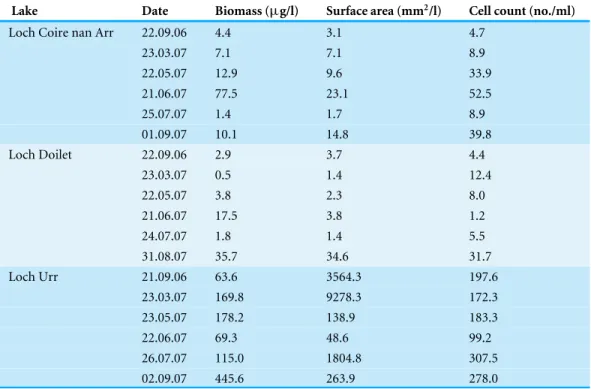
Table 3 Biomass, surface area and cell count determined for the three lakes on each of the sampling occasions.
Lake Date Biomass (µg/l) Surface area (mm2/l) Cell count (no./ml)
Loch Coire nan Arr 22.09.06 4.4 3.1 4.7
23.03.07 7.1 7.1 8.9
22.05.07 12.9 9.6 33.9
21.06.07 77.5 23.1 52.5
25.07.07 1.4 1.7 8.9
01.09.07 10.1 14.8 39.8
Loch Doilet 22.09.06 2.9 3.7 4.4
23.03.07 0.5 1.4 12.4
22.05.07 3.8 2.3 8.0
21.06.07 17.5 3.8 1.2
24.07.07 1.8 1.4 5.5
31.08.07 35.7 34.6 31.7
Loch Urr 21.09.06 63.6 3564.3 197.6
23.03.07 169.8 9278.3 172.3
23.05.07 178.2 138.9 183.3
22.06.07 69.3 48.6 99.2
26.07.07 115.0 1804.8 307.5
02.09.07 445.6 263.9 278.0
abundance of the blue–green algae, such as the genusOscillatoriasp., which is from the prokaryotic group the Cyanophytes. There was also a higher dominance of the Diatoms in Loch Urr in comparison to the other lakes.
The biomass, surface area and cell count calculated for Loch Coire nan Arr, Loch Doilet, and Loch Urr are detailed inTable 3. Based on these data, the correlation between cells count and TP at the time of sampling was significant at the 5% level (Fig. 7), however, the correlations between TP and cell surface area as well as biomass were not significant at the 5% level.
The regression models obtained for TP and cell count (Fig. 7), and those generated for cell count and the concentration of metals per gram of cells (Eqs. 1–8) were used to calculate the best-fit values that describe the effect of changes in cell density on metal uptake by the phytoplankton under different trophic states.
This was completed by firstly using the regression equation for TP and cell count (Fig. 7) to estimate the number of cells per ml under a range of TP concentrations. These data were then incorporated into the following regression equations obtained from the analysis of the metals and P per unit mass of phytoplankton and the corresponding cell count.
Pb=((−1.888×log10(cell count))+9.973)3 (1)
Hg=((−0.268×log10(cell count))+1.354)3 (2)
Cu=((−0.874×log10(cell count))+5.813)3 (3)
Figure 7 Correlation between cell count and TP concentrations from early June 2006 to late Septem-ber 2007 in all three lakes.The significance (p) value was computed with SPSS on the significance of the regression line.
Cr=((−2.530×log10(cell count))+13.412)3 (5)
Co=((−0.538×log10(cell count))+2.572)3 (6)
Mn=((−0.967×log10(cell count))+10.609)3 (7)
P=((−1.114×log10(cell count))+16.551)3 (8)
This generated best-fit values for each metal per gram of cells. For example, the Hg per gram of phytoplankton in water with a TP concentration of 30µg/l was calculated as follows:
• Phytoplankton cells per ml:
=10ˆ((0.7188×301/3) – 0.727)
=31.9 cells.
• Hg per gram of phytoplankton:
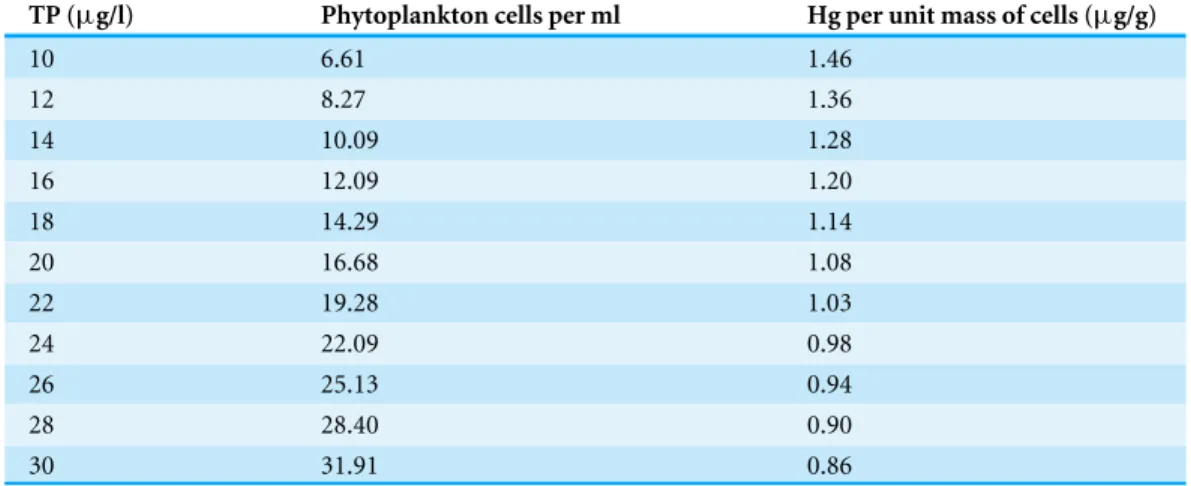
Table 4 Best-fit values of the number of phytoplankton cells per ml under a range of trophic states and the concentration of Hg per unit mass of those cells.The cells per ml were predicted using the re-gression formula generated for TP and cell counts in this study (Fig. 7). Concentrations of Hg perµg of
cells were estimated using the predicted cells per ml and the regression equation for Hg per unit mass of phytoplankton (Eq. 2).
TP (µg/l) Phytoplankton cells per ml Hg per unit mass of cells (µg/g)
10 6.61 1.46
12 8.27 1.36
14 10.09 1.28
16 12.09 1.20
18 14.29 1.14
20 16.68 1.08
22 19.28 1.03
24 22.09 0.98
26 25.13 0.94
28 28.40 0.90
30 31.91 0.86
Table 4provides details on how the predicted Hg concentrations change per gram of cells with a range of TP concentrations.
Figure 8shows the best-fit lines for the relationship of cell counts and the concentration of Hg, Cd, Cr, Cu, Co, Mn, Ni and Pb per gram of cells. These were calculated in the same way as described in detail for Hg, with an extension of that data to include the range of TP values recorded in this study (7–85µg/l). As the best-fit curves are without noise, and because they represent the correlations in the data obtained from this study, they can be used to examine the rate of metal uptake by phytoplankton cells in this study. The data points, i.e., the true measurements recorded, were used in an exponential regression to quantitatively describe the rate of uptake by the phytoplankton.
The best-fit lines inFig. 8suggest that the uptake of Hg, Pb, Cd, Cu, Co, Ni and Cr by the phytoplankton is subject to exponential decay. This is characterised by an initially rapid decline in metal concentrations perµg of phytoplankton with increasing cells, until the concentration approaches zero, where the rate of the absolute decrease in the metals decelerates. The exponential regression equations for the data points inFig. 8shows the decay constant, which defines the rate of metal decay in phytoplankton cells with an increasing number of cells. The larger the rate constant, the more rapid the decay of the dependent variable (y, metals in phytoplankton). The rate of Pb, Cd, Cr, Hg, Cu, Co, Ni and Mn decay in phytoplankton cells with an increasing number of cells is 0.0046, 0.0046, 0.0045, 0.0045, 0.0037, 0.0069, 0.004 and 0.0031 (mL/cell) respectively.
Figure 8 Relationship of phytoplankton cell counts with Pb (A), Cr (B), Cu (C), Mn (D), Cd (E), Hg (F), Co (G) and Ni (H) per gram of cells.The best-fit lines (in red) were calculated from the predicted cell counts (Fig. 7) and the metal (and P) concentrations per unit mass of cells (Fig. 3). The data points are the actual measurements recorded in this study and were used in the exponential regression of the formula displayed for each relationship.
rise in cell count with increasing TP, but as more TP is introduced, the rate of growth accelerates.
The metal concentrations in one cell of phytoplankton were calculated by firstly calculating the weight of an individual cell. For example, in Loch Doilet on the 22/05/2007 the phytoplankton cell count was 7.95 cells/ml and the mean phytoplankton biomass was 3.77µg/l (Table 3). Therefore the weight of one cell is calculated as follows.
• Phytoplankton cell biomass (µg/l)÷number of cells per litre (cells/l) =3.77µg/l÷7950 cells/l
=4.74×10⁻⁴
Figure 9 The relationship of phytoplankton cell counts with TP concentrations.The best-fit line was calculated from the regression analysis of TP and cell counts (Fig. 7). The data points are the actual mea-surements recorded in this study and were used in the exponential regression of the formula displayed.
Secondly, the concentration of metals was calculated for one cell. This was carried out by using the weight of one cell and the concentration of metal per unit weight of cells. The above cell weight for Loch Doilet on the 22/03/2007 and the concentration of Cd per gram of cells will be used as an example here.
• Weight of individual cell (g/cell)×Cd per gram of cells (µg/g) =4.74×10⁻¹⁰(g/cell)×8.5 (
µg/g)
=4.03×10⁻¹⁵g of Cd per cell.
Table 5shows the calculated concentrations for Hg, Pb, Cd, Cu, Cr, Co, P, Mn and Ni in the phytoplankton cells of each of the lakes on all sampling occasions.
DISCUSSION
As P is a limiting nutrient for phytoplankton growth, TP is a good measure of a lakes trophic status (Brooks, Bennion & Birks, 2001). From the range (maximum to minimum) of TP concentrations recorded for each lake (Fig. 2), the associated trophic status of the lakes ranges from oligio- mesotropic for Loch Doilet (3.7–23.5µg TP l−1), oligio- eutrophic for Loch Coire nan Arr (2.7–79.3µg TP l−1), and meso- eutrophic for Loch Urr (22.0–85.3
Table 5 Content of Pb, Cd, Hg, Cr, Co, Ni, Mn, P and Cu per phytoplankton cell in the three lakes on all sampling occasions.The values were calculated from the av-erage weight of one cell, and the metal (and P) concentrations per gram of cell on the same date.
Lake Date Metal content per phytoplankton cell
Pb (g×10−15)
Cd (g×10−15)
Hg (g×10−15)
Cr (g×10−14)
Co (g×10−16)
Ni (g×10−14)
Mn (g×10−14)
P
(g×10−12)
Cu (g×10−14)
22.09.06 906.6 139.0 1.5 207.5 77.3 13.2 138.2 1.8 12.6
23.03.07 1444.3 200.1 2.2 325.3 124.1 20.4 333.6 3.2 20.4
22.05.07 14.5 0.4 0.1 3.0 16.4 1.0 14.8 0.2 0.6
21.06.07 343.7 44.4 0.3 68.2 97.5 2.5 137.9 6.0 6.7
25.07.07 90.2 12.5 0.1 20.0 6.4 0.5 3.3 0.7 1.3
Loch Coire nan Arr
01.09.07 229.8 41.4 0.2 53.3 8.4 0.7 5.9 2.1 3.3
22.09.06 471.3 19.1 3.6 125.9 693.9 40.7 520.8 2.8 24.1
23.03.07 4.3 0.1 0.0 1.2 4.7 0.4 2.1 0.1 0.3
22.05.07 124.1 4.0 1.2 45.4 46.5 19.4 34.7 0.9 9.0
21.06.07 9461.8 1509.8 16.9 2255.6 434.5 54.6 479.5 100.7 152.5
24.07.07 273.6 44.6 0.5 66.6 7.5 1.7 6.6 2.1 4.3
Loch Doilet
31.08.07 797.7 116.5 1.1 189.6 33.8 2.2 27.9 6.8 11.6
21.09.06 27.5 2.0 0.2 8.0 9.3 2.8 54.1 1.1 2.0
23.03.07 92.4 3.2 0.6 29.9 32.5 10.8 113.1 1.7 6.5
23.05.07 195.7 4.9 0.9 52.8 103.0 19.6 559.3 1.4 19.4
22.06.07 230.4 31.9 0.4 52.1 5.6 1.3 4.1 3.7 3.1
26.07.07 80.7 12.5 0.1 19.0 3.0 0.5 4.0 1.2 1.2
Loch Urr
02.09.07 333.6 46.9 0.4 76.7 9.6 2.0 11.9 4.0 4.9
concentrations (Carlson, 1977;Knowlton & Jones, 1997;O’Gorman, Lantry & Schneider, 2004). If the mean TP concentrations over the sampling period are used to assign a trophic status to the lakes in this study, that yields a status of mesotrophic for Loch Coire nan Arr with a mean TP of 22.9µg/l, oligotrophic for Loch Doilet (9.6µg TP l−1), and eutrophic for Loch Urr (45.9µg TP l−1). The variation in the mean trophic state between the three lakes may be partially attributed to several differences in lake and catchment morphometry. For example, Loch Doilet has the lowest mean TP concentration at 9.6µg TP l−1but has a lake volume (4.2×10⁶m3) that greatly exceeds that of the other two lakes (5.0×10⁵m3 in Loch Coire nan Arr, 2.4×10⁶m3in Loch Urr). It also has a relatively higher maximum lake depth recorded at approximately 16 m in comparison to a maximum depth of 12 m recorded in the other two lakes (Table 1). A larger lake volume and maximum depth tends to result in lower nutrient concentrations (Chow-Fraser, 1991). This is because firstly, a high volume of lake water can dilute the TP, and secondly, at greater lake depths there is less possibility of mixing and therefore P can be more readily removed from the water column by the sediment to the lake bed (Jeppesen et al., 2003).
The correlation between TP and the number of cells per ml at the time of sampling was significant at the 5% level (Fig. 7), however the correlations between TP and cell surface area as well as biomass were not. Insignificance in the correlation of TP and surface area has been previously noted byThomann (1977)who suggests that the relationship is a combination of biomass, TP, retention time, and sinking rates. It is possible that the measurements of phytoplankton cell count, surface area and biomass in this study responded to TP at different rates. For example, count can remain constant even if volume increases, but if the volume per cell declines then the opposite applies, i.e., cell total volume remains constant but the number of cells increases. Surface area can vary with either, for example, a small spherical cell can have a greater surface area to volume ratio than a larger spherical cell. Equally, the variations in the correlations may also be because the method for the determination of cell count is open to less error than that of cell surface area and/or biomass. The latter are an extension of the determination of cell count and their final values include measurements of cell dimensions that fit into an assigned geometric formula. Additionally, Gleskes & Kraay (1983)andReyonlds (1984) shed doubt on the accuracy of the ‘classical method’ for the quantification of phytoplankton growth. This is because it is based on spot samples that do not account for lateral and vertical fluctuations in lake temperature, nutrients and light availability, as these strongly influence the species composition and abundance of phytoplankton. Phycologists have also recognised that phytoplankton biomass can never be accurately quantified due to diurnal variations (B Whitton, pers. comm., 2006). Furthermore, the abundance of bacterioplankton and phytoplankton <20µm are not accounted for in this investigation. As the bacterioplankton and phytoplankton <20µm can compete with algae for P in the water column (Currie ,
interpretations of phytoplankton growth and metal interactions on cell count as opposed to biomass or surface area.
The significant correlations between the mass-specific Pb, Cd, Hg, Cr, Cu and Ni in the phytoplankton and TP concentrations (Fig. 4) suggest that algae bloom density dilution occurred in the lakes investigated. This evidence supports the findings ofPickhardt et al. (2002)for algae bloom dilution of Hg. It also relates to studies that have reported algae bloom dilution of As (Chen & Folt, 2000), and polychlorinated biphenyls (Larsson et al., 1992).
Two mechanisms may explain these findings. First is surface availability (Chen & Folt, 2005). This means the phytoplankton share a finite pool of metals and have a constant uptake. Thus enhanced lake productivity reduced the mass-specific metal concentrations. Yet it is difficult to accept that surface availability controlled metal uptake by the phytoplankton alone because the mass-specific concentrations of Mn showed no correlation with TP (r2=0.0004), while Co (and P) showed no significant decline with increasing TP concentrations. Secondly, because the trace element to macronutrient (i.e., phosphorus or carbon) ratios is a balance of net steady-state uptake and growth rates (Sunda & Huntsman, 1997;Sunda & Huntsman, 2004). As nutrients become more available, growth rates increase, which eventually results in a decline in element to phosphorus ratios in the cells. The significant correlations (p<0.05) between the mass-specific metal (Pb, Cd, Cr, Hg) to P ratios in phytoplankton and TP (Fig. 5), and their negative correlation against chlorophyll-aappear to be in agreement with this biodilution hypothesis. This also may explain why Mn showed no correlation with TP. Mn is an essential element for phytoplankton growth (Morel, Hudson & Price, 1991), and so new cells may assimilate the available Mn.
Figure 9 indicates that the relationship of increasing TP and cell count is subject to exponential growth (Serruya & Berman, 1975).Figure 8suggests the relationship of increasing cell numbers and their Hg, Pb, Cd, Cu, Co, Ni and Cr concentrations follows the pattern of exponential decay. The association betweenFigs. 8and9provides potential insight into the rate at which algae bloom dilution occurs. That is, as TP increases, phytoplankton cell growth accelerates gently, and the concentration of metals in cells rapidly decline until it approaches zero, where the rate of the absolute decrease in the metals reduces. This deceleration in algae bloom dilution may eventually be paralleled by a lack of P to sustain the growth of more phytoplankton or insufficient growth space.
Table 6 Metal to P stoichiometries (mol:mol) of the freshwater phytoplankton collected in Loch Coire nan Arr, Loch Doilet and Loch Urr for this study.Calculations were based on the mean concentrations of the metals per cell in the three lakes (Table 5). These were then converted to molar concentrations, and divided by the sum of all components, which included C and N molar concentrations that were calculated based on the standardRedfield (1958)ratio of C106:P1:N16. The averages of the ratios across the lakes yields a mean metal to P stoichiometry of (C106P1N16)1000Pb0.019Hg0.00004Cu0.013Cd0.005Cr0.2Co0.0008Mn0.2Ni0.012.
Element Loch Coire nan Arr Loch Doilet Loch Urr Mean
C 105,860 106,197 105,989 106,015
N 15,979 16,030 15,998 16,002
P 999 1,002 1,000 1,000
Pb 0.03 0.01 0.01 0.019
Hg 0.00005 0.00003 0.00003 0.00004
Cu 0.02 0.01 0.01 0.013
Cd 0.009 0.004 0.002 0.005
Cr 0.3 0.1 0.1 0.2
Co 0.001 0.001 0.001 0.0008
Mn 0.3 0.1 0.3 0.2
Ni 0.01 0.01 0.01 0.012
metals in a detoxified form (Walsh & Hunter, 1995). If the correlation between the ratios of metals to P in cells with TP in this study (Fig. 5) is consulted again, it is notable that the only metals that showed a significant decrease in their ratio to P were Pb, Cd, Hg and Cr. It is also notable that these four metals had a strikingly similar decay constant with their relationship in phytoplankton to increasing cells. That is, 0.0046 for both Pb and Cd, and 0.0045 for Cr and Hg (Fig. 8). Additionally, of the metals tested in this study, these four metals are considered the most toxic to phytoplankton (Xue & Sigg, 1993). Therefore, it is possible that when nutrients became more available, growth rates and cellular P increased, forming intracellular polyphosphate bodies that selected less toxic metals more rapidly.
Table 6 presents the metal to P stoichiometries (mol:mol) of the freshwater phytoplankton collected in this study. The calculations were based on the mean concentrations of the metals per cell in each of the three lakes (Table 5). These were converted to molar concentrations and divided by the sum of all components, which included the C and N molar concentrations based on the standardRedfield (1958)ratio of C106:P1:N16.Table 6shows the ratios of the metals between the lakes are in the same order of magnitude. The mean metal to P stoichiometry from this investigation is (C106P1N16)1000Pb0.019Hg0.00004Cu0.013Cd0.005Cr0.2Co0.0008Mn0.2Ni0.012. This is similar to the phytoplankton cell stoichiometry presented byTwining, Baines & Fisher (2004)who found, for instance, 0.26 mol of Mn for every 1 mol of P, whereas this study found 0.21 mol of Mn for every 1 mol of P. The slightly higher ratio offered by Twining et al. may be expected as their study was on marine phytoplankton. This is because P is generally more concentrated in the phytoplankton of freshwater lakes, and thus lowering the metal to P ratio.
1.55×10⁻¹⁰g, and using the Cd: P ratio of 0.000005/1, the estimated Cd concentration bound to a cell is 7.76×10⁻¹⁶ mol (or 87.2×10⁻¹⁵g). If the P concentration is raised by a factor of 4, the estimated Cd is 3.11×10⁻¹⁸mol (or 3.49×10⁻¹⁶g). The risk of toxicity can then be predicted by comparing the results to those of toxicity tests. For instance, Wang & Dei (2006)observed toxicity at a Cd:P ratio of >0.2. While this may be useful, using the stoichiometry as a predictor on a wider scale than the lakes investigated has large uncertainties because it would assume the ratio is constant.
CONCLUSIONS
1.A higher TP concentration in the lakes resulted in significant algae growth dilution of the mass-specific Pb, Cd, Hg, Cu, Ni and Cr in the phytoplankton. This was because the available metals had to be shared among more and as P became more available, the mass specific metal to P ratios in the phytoplankton declined. The same mechanisms were not effective on Mn because it is assimilated during phytoplankton growth.
2.The relationship between the number of phytoplankton cells per millilitre of lake water and the mass-specific metal concentrations in the phytoplankton provides an examination of the rate of algae bloom dilution in the lakes. As TP increased, phytoplankton cell growth accelerated gradually, and the concentration of metals in cells rapidly declined until it approached zero. The decay constants indicate that Mn has the lengthiest rate of algae bloom dilution among the metals. This suggests the involvement of two intracellular mechanisms in the active selection of metals. The first is metabolic in that growing cells have preference for Mn and thus it is diluted at a more gradual rate. The second is a detoxification process that stores excess P as intracellular polyphosphate, which selects the less toxic metals more rapidly.
3. The simultaneous measurements of metals and P in phytoplankton cells, along with quantification of changes in cell mass, generated a mean metal to P stoichiometry of (C106P1N16)1000Pb0.019Hg0.00004Cu0.013Cd0.005Cr0.2Co0.0008Mn0.2Ni0.012 based on the Redfield average C, N and P stoichiometry of (CH2O)106(NH3)16H3PO4. This stoichiometry can be used to estimate the concentration of metals in cells based on their P content and may be incorporated into BLM if the concentration of cell surfaces were to be used as the biotic ligands.
ADDITIONAL INFORMATION AND DECLARATIONS
Funding
This work was funded as a PhD studentship by the Department for Employment and Learning (DEL) Northern Ireland. The funders had no role in study design, data collection and analysis, decision to publish, or preparation of the manuscript.
Grant Disclosures
Competing Interests
The authors declare there are no competing interests.
Author Contributions
• Aine M. Gormley-Gallagher conceived and designed the experiments, performed the experiments, analyzed the data, contributed reagents/materials/analysis tools, wrote the paper, prepared figures and/or tables, reviewed drafts of the paper.
• Richard W. Douglas and Brian Rippey contributed reagents/materials/analysis tools, reviewed drafts of the paper.
Data Availability
The following information was supplied regarding data availability:
EThOS, British Library:http://ethos.bl.uk/OrderDetails.do?uin=uk.bl.ethos.529532.
Supplemental Information
Supplemental information for this article can be found online athttp://dx.doi.org/10.7717/ peerj.2749#supplemental-information.
REFERENCES
Bock R. 1979.A handbook of decomposition methods in analytical chemistry. Marr IL trans. Glasgow: International Textbook Company.
Brooks SJ, Bennion H, Birks JB. 2001.Tracing lake trophic history with a chironomid-total phosphorus inference model.Freshwater Biology46:513–533.
Bruland KW, Knauer GA, Martin JH. 1978.Cd in northeast Pacific waters.Limnology
and Oceanography23:618–625DOI 10.4319/lo.1978.23.4.0618.
Carlson RE. 1977.A trophic state index for lakes.Limnology and Oceanography 22:361–369.
Chen CY, Folt CL. 2000.Bioaccumulation and diminution of arsenic and lead in a freshwater food web.Environmental Science and Technology 34:3878–3884 DOI 10.1021/es991070c.
Chen CY, Folt CL. 2005.High plankton densities reduce mercury biomagnification.
Environmental Science and Technology 39:115–121DOI 10.1021/es0403007.
Chow-Fraser P. 1991.Use of the morphoedaphic index to predict nutrient status and algal biomass in some Canadian lakes.Canadian Journal of Fisheries and Aquatic
Sciences48:1909–1918.
Currie DJ. 1990.Large-scale variability and interactions among phytoplankton, bacterioplankton, and phosphorus.Limnology and Oceanography35:1437–1455 DOI 10.4319/lo.1990.35.7.1437.
De Schamphelaere KAC, Stauber JL, Wilde KL, Markich SJ, Brown PL, Franklin NM, Creighton NM, Janssen CR. 2005.Toward a biotic ligand model for freshwater green algae: surface-bound and internal copper are better predictors of toxicity than free Cu2+-ion activity when pH is varied.Environmental Science and Technology
Di Toro DM, Allen HE, Bergman HL, Meyer JS, Paquin PR, Santore RC. 2002.Biotic ligand model of the acute toxicity of metals. 1. Technical basis.Environmental
Toxicology and Chemistry20:2383–2396.
Donald NM. 2004.Interactions of trace metals with phytoplankton and zooplankton in Lough Neagh, Northern Ireland. Ph.D. thesis, University of Ulster, Coleraine, Northern Ireland.
Douglas RW, Rippey B. 2000.The random redistribution of sediment by wind in a lake.
Limnology and Oceanography45(3):686–694DOI 10.4319/lo.2000.45.3.0686.
Douglas RW, Rippey B, Gibson CE. 2003.Estimation of the in-situ settling velocity of particles in lakes using a time series sediment trap.Freshwater Biology48:512–518 DOI 10.1046/j.1365-2427.2003.01027.
Eisenreich SJ, Bannerman RT, Armstrong DE. 1975.A simplified phosphorus analysis technique.Environmental Letters9:43–53DOI 10.1080/00139307509437455. Gleskes WWC, GW Kraay. 1983.Dominance of Cryptophyceae during the
phytoplank-ton spring bloom in the central North Sea detected by HPLC analysis of pigments.
Marine Biology 75:179–185.
Gormley AM. 2008.The impact of phytoplankton growth on the biogeochemical cycling of
metals in lakes. British Library. Available athttp:// ethos.bl.uk/ OrderDetails.do?uin=
uk.bl.ethos.52952.
Gormley-Gallagher AM, Douglas RW, Rippey B. 2015.The applicability of the distribution coefficient, KD, based on non-aggregated particulate samples from lakes with low suspended solids concentrations.PLoS ONE 10(7):e0133069 DOI 10.1371/journal.pone.0133069.
Hillebrand H, Durselen CD, Kirschtel D, Pollingher U, Zohary T. 1999.Biovolume calculation for pelagic and benthic microalgae.Journal of Phycology39:1145–1159 DOI 10.1046/j.1529-8817.1999.3520403.x.
Hilton J. 1985.A conceptual framework for predicting the occurrence of sediment focusing and sediment redistribution in small lakes.Limnology and Oceanography 30:1131–1143DOI 10.4319/lo.1985.30.6.1131.
Ho TY, Quigg A, Finkel ZV, Milligan AJ, Wyman K, Falkowski PG, Morel FMM. 2003. The elemental composition of some marine phytoplankton.Journal of Phycology 39:1145–1159DOI 10.1111/j.0022-3646.2003.03-090.x.
Ho TY, Wen LS, You CF, Lee DC. 2007.The trace-metal composition of size-fractioned plankton in the South China Sea: biotic versus abiotic sources.Limnology and
Oceanography 52(5):1776–1788DOI 10.4319/lo.2007.52.5.1776.
Jeppesen E, Jensen JP, Jensen C, Faafeng B, Hessen DO, Sondergaard M, Lauridsen T, Brettum P, Christoffersen K. 2003. The impact of nutrient state and lake depth on top-down control in the pelagic zone of lakes: a study of 466 lakes from the temperate zone to the arctic.Ecosystems6:313–325.
Kelly M. 2000.Identification of common benthic diatoms in rivers.Field Studies 9:583–700.
Knowlton MF, Jones JR. 1997.Trophic status of Missouri River floodplain lakes in relation to basin type and connectivity.Wetlands17:648–475.
Larsson P, Collivin L, Okia L, Meyer G. 1992.Lake productivity and water chemistry as governs of the uptake of persistent pollutants in fish.Environmental Science and
Technology26:346–352DOI 10.1021/es00026a016.
Lohan MC, Crawford DW, Purdie DA, Statham PJ. 2005.Iron and zinc enrichments in the northeast subarctic Pacific: ligand production and zinc availability in re-sponse to phytoplankton growth.Limnology and Oceanography50:1427–1437 DOI 10.4319/lo.2005.50.5.1427.
Long SE, Martin TD, Martin ER. 1990.Method 200.8—Determination of trace elements in waters and wastes by inductively coupled plasma-mass spectrometry. Cincinnati: Office of Research and Development, U.S. Environmental Protection Agency.
Ma Z, Jacobsen FE, Giedroc DP. 2009.Metal transporters and metal sensors: how coordination chemistry controls bacterial metal homeostasis.Chemistry Reviews 109:4644–4681DOI 10.1021/cr900077w.
Moffett JW, Brand LE, Croot PL, Barbeau KA. 1997.Cu speciation and cyanobacterial distribution in harbors subject to anthropogenic Cu inputs.Limnology and
Oceanog-raphy42:789–799DOI 10.4319/lo.1997.42.5.0789.
Monteith DT, Shilland EM. 2007.The United Kingdom acid waters monitoring network assessment of the first 18 years of data. Report to the department for environment, food and rural affairs (Contract EPG 1/3/160).Available athttp:// awmn.defra.gov.uk/ resources/ interpreports/ 18yearInterpRpt.pdf.
Morel FMM, Hudson RJM, Price NM. 1991.Limitation of productivity by trace metals in the sea.Limnology and Oceanography36:1742–1755
DOI 10.4319/lo.1991.36.8.1742.
Murphy J, Riley JP. 1962.A modified single-solution method for the determi-nation of phosphate in natural waters.Analytical Chimcia Acta27:31–36 DOI 10.1016/S0003-2670(00)88444-5.
Murphy JF, Winterbottom JH, Orton S, Simpson GL, Shilland EM, Hildrew AG. 2014.Evidence of recovery from acidification in the macroinvertebrate assem-blages of UK fresh waters: a 20-year time series.Ecological Indicators37:330–340 DOI 10.1016/j.ecolind.2012.07.009.
Murray JW. 1987. Mechanisms controlling the distribution of trace elements in oceans and lakes. In: Hites RA, Eisenreich S, eds.Sources and fates of aquatic pollutants. Washington D.C.: American Chemical Society, 153–184.
OECD. 1982.Eutrophication of waters-monitoring, assessment and control. Paris: Organi-sation for Economic Cooperation and Development.
O’Gorman R, Lantry BF, Schneider CP. 2004.Effect of stock size, climate, predation, and trophic status on recruitment of alewives in Lake Ontario, 1978–2000.
Olrik K, Blomqvist P, Brettum P, Cronberg G, Eloranta P. 1998.Methods for quantita-tive assessment of phytoplankton in freshwaters part I. Stockholm: Naturvårdsverket för lag, 86.
Paquin PR, Zoltay V, Winfield RP, Wu KB, Mathew R, Santore RC. 2002.Extension of the biotic ligand model of acute toxicity to a physiologically-based model of the survival time of rainbow trout (Oncorhynchus mykiss) exposed to silver. Comparative Biochemistry and Physiology Part C: Toxicology and Pharmacology 133:305–343.
Patrick S, Monteith DT, Jenkins A. 1995.UK acid waters monitoring network: the first five years—analysis and interpretation of results, April 1988–March1993. London: ENSIS Publishing.
Pickhardt PC, Folt CL, Chen CY, Klaue B, Blum JD. 2002.Algal blooms reduce the uptake of toxic methylmercury in freshwater food webs.Proceedings of the
National Academy of Sciences of the United States of America99:4419–4423
DOI 10.1073/pnas.072531099.
Prairie YT, Duarte CM, Kalff J. 1989.Unifying nutrient-chlorophyll relationships in lakes.Canadian Journal of Fisheries and Aquatic Sciences46:1176–1182.
Redfield AC. 1958.The biological control of chemical factors in the environment.
American Scientist 46:205–221.
Redfield AC, Ketchum BH, Richards FA. 1963. The influence of organisms and the composition of seawater. In: Hill MN, ed.The Sea. New York: Wiley Interscience, 26–77.
Reyonlds CS. 1984.Phytoplankton periodicity: the interactions of form, function and environmental variability.Freshwater Biology14:111–142.
Reynolds GL, Hamilton-Taylor J. 1992.The role of planktonic algae in the cycling of Zn and Cu in a productive soft-water lake.Limnology and Oceanography37:1759–1769 DOI 10.4319/lo.1992.37.8.1759.
Riemann B. 1978.Absorption coefficients for chlorophyll a and b in methanol and comment on the interference of chlorophyllbin determination of chlorophylla.
Vatten3:187–194.
Rippey B, Douglas RW. 2004.Reconstructing regional-scale lead contamination of the atmosphere (1850–1980) in the United Kingdom and Ireland using lake sediments.
Global Biogeochemical Cycles18: GB4.26DOI 10.1029/2004GB002305.
Santana-Casiano JM, Gonzalez-Davila M, Perez-Pena J, Millero FJ. 1995.Pb2+
interactions with the marine phytoplanktonDunaliella tertiolecta.Marine Chemistry 48:115–129DOI 10.1016/0304-4203(95)91418-K.
Sanudo-Wilhelmy SA, Tovar-Sanchez A, Fu FX, Capone DG, Carpenter EJ, Hutchins DA. 2004.The impact of surface-adsorbed phosphorus on phytoplankton Redfield stoichiometry.Nature432:897–901DOI 10.1038/nature03125.
Schultz TW, Seaward JR. 2000.Health-effects related structure-toxicity relationships: a paradigm for the first decade of the new millennium.The Science of the Total
Serruya C, Berman T. 1975.Phosphorus, nitrogen and the growth of algae in Lake Kinneret.Journal of Phycology11:155–162.
Sigg L. 1985. Metal transfer mechanisms in lakes; the role of settling particles. In: Stumm W, ed.Chemical processes in lakes. New York: Wiley-Interscience, 283–310.
Sigg L, Sturm M, Kistler D. 1987.Vertical transport of heavy metals by settling particles in Lake Zurich.Limnology and Oceanography32:112–130
DOI 10.4319/lo.1987.32.1.0112.
Sunda WG, Huntsman SA. 1997.Interrelated influence of iron, light and cell size on marine phytoplankton growth.Nature 390:389–392DOI 10.1038/37093. Sunda WG, Huntsman SA. 1998.Processes regulating cellular metal accumulation
and physiological effects: phytoplankton as model systems.The Science of the Total
Environment 219:165–181DOI 10.1016/S0048-9697(98)00226-5.
Sunda WG, Huntsman SA. 2004.Relationships among photoperiod, carbon fixation, growth, chlorophyll a, and cellular iron and zinc in a coastal diatom.Limnology and
Oceanography 49:1742–1753DOI 10.4319/lo.2004.49.5.1742.
Sykes JM, Lane AMJ, George DG. 1999.The United Kingdom environmental change network: protocols for standard measurements at freshwater sites. Centre for Ecology and Hydrology, Wallingford, UK, National Environmental Research Council.
Available athttp:// nora.nerc.ac.uk/ 16517/ 1/ O120426BK.pdf.
Thomann RV. 1977.Comparison of lake phytoplankton models and loading plots.
Limnology and Oceanography22:370–373.
Twining BS, Baines SB, Fisher NS. 2004.Element stoichiometries of individual plankton cells collected during the Southern Ocean Iron Experiment (SOFeX).Limnology and
Oceanography 49:2115–2128DOI 10.4319/lo.2004.49.6.2115.
UNECE. 1998.Protocols to the 1979 Geneva Convention on long-range transboundary air pollution: the 1998 protocol on heavy metals. The United Nations Economic Commission for Europe (UNECE), Geneva, Switzerland.
Vasconcelos MTSD, Leal MFC, Van den Berg CMG. 2002.Influence of the nature of the exudates released by different marine algae on the growth, trace metal uptake and exudation ofEmiliania huxleyiin natural seawater.Marine Chemistry77:187–210 DOI 10.1016/S0304-4203(01)00087-1.
Vollenweider RA. 1974.A manual on methods for measuring primary production in
aquatic environments. I.B.P. Handbook no. 12. Oxford: Blackwell Scientific
Publi-cations.
Walsh RS, Hunter KA. 1995.Influence of phosphorus storage on the uptake of cadmium by the marine algaMacrocystis pyrifera.Limnology and Oceanography37:1361–1369 DOI 10.4319/lo.1992.37.7.136.
Wang WX, Dei RCH. 2006.Metal stoichiometry in predicting Cd and Cu toxicity to a freshwater green algaChlamydomonas reinhardtii.Environmental Pollution 142:303–312DOI 10.1016/j.envpol.2005.10.005.
Ward DM, Nislow KH, Chen CY, Folt CL. 2010.Reduced trace element concentrations in fast-growing juvenile Atlantic Salmon in natural streams.Environmental Science
Whitfield M. 2001.Interactions between phytoplankton and trace metals in the ocean.
Advances in Marine Biology41:3–128DOI 10.1016/S0065-2881(01)41002-9.
Whitton BA, Balbi DM, Donaldson A. 2003.Blue–green algae of the British Isles inter-active key to the species. Durham: CD-ROM School of Biological and Biomedical Sciences, University of Durham.
Whitton BA, Balbi DM, John DM, Eilwood NTW, York PV, Donaldson A. 2002.Green algae of the British Isles. Interactive key to the commoner genera and species. Durham: School of Biological and Biomedical Sciences, University of Durham (CD-ROM produced in collaboration with The Natural History Museum, London and the Environment Agency of England and Wales).