The relationship between phytoplankton diversity and community function
in a coastal lagoon
Pedro Duarte
1,*, Maria Filomena Macedo
2& Luı´s Cancela da Fonseca
31Center for Modelling and Analysis of Environmental Systems, Faculty of Science and Technology, Fernando Pessoa
University, Prac¸a 9 de Abril 349, 4249-004 Porto, Portugal
2Department of Conservac¸a˜o e Restauro, Faculty of Sciences and Technology, New University of Lisbon, P-2825-114
Monte de Caparica, Portugal
3
IMAR/Lab. Mar. Guia and FCMA – DCB, University of Algarve, Campus de Gambelas, 8005-139, Faro, Portugal (*Author for correspondence: E-mail: [email protected])
Key words: Phytoplankton diversity, production, coastal lagoons
Abstract
The decrease of biodiversity related to the phenomena of global climate change is stimulating the scientific community towards a better understanding of the relationships between biodiversity and ecosystem functioning. In ecosystems where marked biodiversity changes occur at seasonal time scales, it is easier to relate them with ecosystem functioning. The objective of this work is to analyse the relationship between phytoplankton diversity and primary production in St. Andre´ coastal lagoon – SW Portugal. This lagoon is artificially opened to the sea every year in early spring, exhibiting a shift from a marine dominated to a low salinity ecosystem in winter. Data on salinity, temperature, nutrients, phytoplankton species composition, chlorophylla(Chla) concentration and primary production were analysed over a year. Modelling studies based on production-irradiance curves were also conducted. A total of 19 taxa were identified among diatoms, dinoflagellates and euglenophyceans, the less abundant group. Lowest diversities (Shannon– Wiener index) were observed just before the opening to the sea. Results show a negative correlation (p<0.05) between diversity and chlorophylla(Chla) concentration (0.2–40.3 mg Chlam)3). Higher Chla values corresponded to periods when the community was dominated by the dinoflagellateProrocentrum minimum(>90% of cell abundance) and production was maximal (up to 234.8 mg C m)3h)1). Maximal photosynthetic rates (Pmax) (2.0–22.5 mg C mg Chla)1h)1) were higher under lower Chlaconcentrations. The results of this work suggest that decreases in diversity are associated with increases in biomass and production, whereas increases correspond to opposite trends. It is suggested that these trends, contrary to those observed in terrestrial and in some benthic ecosystems, may be a result of low habitat diversity in the water column and resulting competitive pressure. The occurrence of the highest photosynthetic rates when Chla is low, under some of the highest diversities, suggests a more efficient use of irradiance under low biomass–high diversity conditions. Results suggest that this increased efficiency is not explained by potential reductions in nutrient limitation and intraspecific competition under lower biomasses and may be a result of niche complementarity.
Introduction
Biodiversity changes at various temporal and spatial scales (Krebs, 1994). The former may be as large as evolutionary time scales and as small as
seasonal or even shorter time scales. The latter may range from latitudinal to local diversity gra-dients. Given the important shifts observed in biodiversity and the long-term effects of global change, it is important to understand the impact of
these changes on ecosystem functioning and eco-system services.
Biodiversity (hereafter referred as diversity) is a measure of community structure, whether it is expressed merely as species richness or with a specific index. Production is a measure of com-munity function. Therefore, relating diversity with production is one of the several ways to relate community structure with community function. The relationship between these two parameters has been a topic of much debate over the years, mostly in terrestrial ecology. In spite of all this debate, it is not yet a matter of consensus among the scientific community (e.g. Huston et al., 2000). One ques-tion that may be asked about these two parame-ters, assuming that they are related, is ‘‘Which is the cause and which is the effect?’’. According to some classical ecology textbooks (Krebs, 1994), production may hardly be the cause, since some of the most productive ecosystems have a low diver-sity. Recent studies on grassland ecosystems sug-gest that more diverse communities are more productive, because of niche complementarity (Hector et al., 1999; Tilman et al., 2001). This leads to the concept of ‘overyielding’, when poly-cultures exhibit higher production than monocul-tures, due to positive synergies between different species, as in the presence of nitrogen-fixing plants. In such a case, diversity would be the cause of higher production.
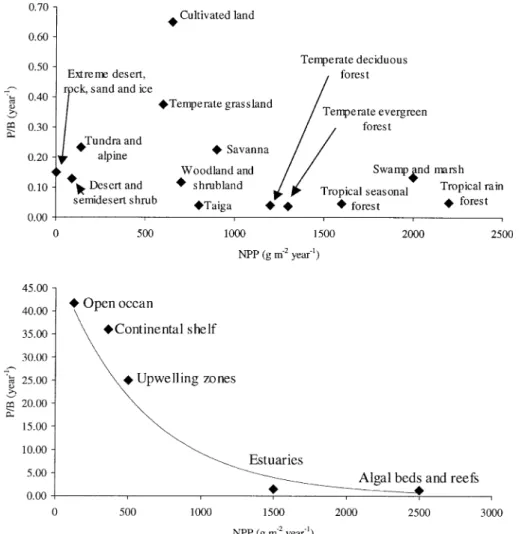
When production of different terrestrial eco-systems is compared, from grasslands to rain for-ests, it is apparent that as diversity increases towards tropical forests, ecosystems have larger gross and net areal productions. But when these values are related to biomass standing stock (the P/B ratio), the opposite seems to be the rule (Fig. 1) (Whittaker & Likens, 1975). Following the same authors, when areal production of conti-nental shelf ecosystems and upwelling zones are compared with production of open ocean ecosys-tems, the formers exhibit much higher values than the latter, whilst the opposite is true for the P/B ratio. As in terrestrial ecosystems, those with higher biomass standing stocks exhibit higher production but lower P/B ratios than the ones with lower biomass densities (Fig. 1). However, whereas large biomass standing stocks are gener-ally associated with higher diversity in terrestrial ecosystems, the opposite seems to be the rule in
pelagic marine ecosystems, where it is generally reported that increased production is associated with decreased diversity (Pearl, 1988; Krebs, 1994). There seems to be a relatively scarcity of field and experimental data relating diversity, production and the P/B ratios in different marine ecosystems, whereas this is a very active field of research in terrestrial ecosystems, with manipula-tive experiments in current usage (e.g. Hector et al., 1999; Tilman et al., 2001). One of the few works where phytoplankton diversity and pro-duction were analysed together is that of Agard et al. (1996). These authors found some empirical evidence to confirm the dynamic equilibrium model of Huston (1979, 1994). According to this model, diversity is reduced by competitive exclu-sion under conditions of high production and low levels of disturbance, or where production is too slow to allow recovery from mortality. Diversity is therefore maximised at ‘intermediate’ disturbance and production levels.
Changes in species composition and diversity may produce changes in community level param-eters, like phytoplankton growth rate and those parameters regulating the photosynthetic response to irradiance or other limiting factors. It is important to understand how these changes are reflected in ecosystem functioning and ecosystem services. The relationship between photosynthetic rate and irradiance (P–I) is of utmost importance in phytoplankton production studies. The knowl-edge of the dynamics of the P–I parameters over the annual cycle can be used to estimate primary production over seasonal scales. It may also help to understand some of the mechanisms controlling photosynthesis and operating from the species to the ecosystem level (Macedo et al., 2001).
Thalassiosira pseudonana Hasle & Heimdal and lower when the blooms were dominated by dino-flagellates. Shaw & Purdie (2001) observed in the UK coastal waters of the North Sea that the October peak in the parameters of the P–I curves coincided with a period in which dinoflagellates accounted for a high proportion of phytoplankton biomass. In a study conducted in Santo Andre´ coastal lagoon Macedo et al. (2001) obtained P–I curves every month for a period of 13 months together with phytoplankton species composition and cell counts. A significant Arrhenius type relationship was obtained between light saturated photosynthesis (Pmax) and temperature when blooms were dominated by the dinoflagellate
Prorocentrum minimum (Pavillard) Schiller. None of the previous authors related phytoplankton diversity with the P–I curve parameters. Moreover, none separated the effects of species composition from the effects of other environmental variables that may contribute to photoacclimation and photoadaptation of phytoplankton cells, leading to differences in the P–I curve parameters. According to Pahl-Wostl & Imboden (1990) pho-toresponse has typical time scales between a few minutes and a few hours and corresponds to the time it takes for photosynthesis to reach a steady state response to light. Photoacclimation occurs at time scales of several hours to days and corre-sponds to changes in cell composition, as
phyll a (Chl a) contents per cell. These two pro-cesses may mask differences that result from changes in community composition.
Ecosystems that undergo significant changes in species composition over time are suitable to analyse the relationship between diversity and production. This work is about phytoplankton communities in a Portuguese eutrophic coastal lagoon (St. Andre´ lagoon, SW Portugal). It is not based on an experimental design specifically de-fined to analyse the relationship between diversity and production. It is an exploratory study that may help to establish hypothesis about the men-tioned relationship to be tested in future works. Therefore, the objective of this work is to get some insight into the following question:
‘‘How is phytoplankton diversity related to phytoplankton community production and pho-tosynthetic rates in a coastal lagoon?’’
Methods
The sampling and analytical methods used in this study have been described elsewhere (Macedo et al., 1998, 2001). Therefore, only a brief description will be provided here.
Study area
Santo Andre´ Lagoon (38° 05¢N, 8° 47¢W) is a
shallow (average annual depth of about 1 m, with a maximum of 5 m in autumn) land-locked coastal system located on the southwest coast of Portugal (Fig. 2). The lagoon is connected with the sea only in two periods: during about one month in March– April, by a man-made channel, and occasionally when seawater overpasses the dunes. In the first situation, low salinity water and sediments are exported and colonisation by marine species oc-curs. After the lagoon is closed, salinity progres-sively decreases and organic matter accumulates leading to summer dystrophy (Cancela da Fonseca et al., 1989). The lagoon receives freshwater from six small rivers forming a drainage basin of about 96 km2. The lagoon can be stratified or vertically mixed, depending on the prevailing environmental conditions (Bernardo, 1990). Fishing is the main economic activity in Santo Andre´ Lagoon, although it is also used for recreation. The shifting
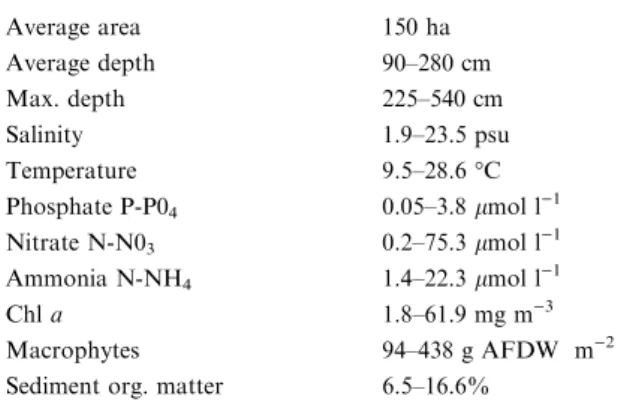
between a predominantly fresh water ecosystem and a predominantly salt water ecosystem explains the large variability of physical, chemical and biological variables (Table 1).
Sampling and treatment
Physical and chemical variables (temperature, pH, salinity, dissolved nitrogen and phosphorus) Chla concentrations, cell counts and species composi-tion were monitored from January 1998 to Janu-ary 1999, on a monthly basis (13 sampling campaigns) at one sampling station (Fig. 2). Water samples for phytoplankton biomass, species com-position, inorganic nutrients and P–I experiments were collected simultaneously at 0.5 m depth. Samples for P–I determination were collected in the morning and kept in the dark for about 4 h before the incubations (see below).
Chemical analyses
Inorganic nutrient analyses (nitrate, nitrite, ammonia and phosphate) were performed according to the methods described in A.P.H.A. (1992) and Parsons et al. (1984). Total available inorganic carbon was determined in the water samples prior to incubation from pH (pH Meter ESD model 69) and alkalinity measurements according to Parsons et al. (1984). Samples for Chl a and phaeopigments (Phae) were filtered onto 0.45 lm membrane filters. Pigments were ex-tracted in 90% acetone and analysed fluorometri-cally by the method of Yentsch & Menzel (1963) as modified by Holm-Hansen et al. (1965).
Species determination
P–I experiments
Samples were incubated in the laboratory at the same temperature measured in the field, at the time of sampling and under variable irradiance. Light was provided by 1500 W tungsten halogen lamps. Heat produced by the lights was dissipated using a
cold water flow system. Irradiance (0–1445lmol quanta m)2s)1) was measured by a LI-COR underwater cosine quantum sensor (model LI)192SA) and attenuation was achieved by means of grey PVC nets. Preservation of the spectral characteristics was verified by spectral analysis (see Macedo et al., 1998).
Photosynthetic rates were measured at different irradiances by the standard 14C incubation tech-nique (Steemann Neilsen, 1952) and following the ICES CM 1996/L:3 recommendations. Water samples were placed in 60 ml Winkler bottles and inoculated with 1 ml NaH14CO3 with 10lCi (371.88 kBq cm)3) (14C Centralen). A dark bottle was used as blank.
P–I parameters were calculated from the pho-tosynthesis and irradiance using the Eiler & Peet-ers (1988) model (1).
PðIÞ ¼ I
aI2þbIþc mg Cðmg ChlaÞ
1 h1
h i
ð1Þ
Table 1.Main characteristics of St. Andre´ lagoon (average ranges from Bernardo, 1990)
Average area 150 ha
Average depth 90–280 cm
Max. depth 225–540 cm
Salinity 1.9–23.5 psu
Temperature 9.5–28.6°C
Phosphate P-P04 0.05–3.8lmol l)1 Nitrate N-N03 0.2–75.3lmol l)1 Ammonia N-NH4 1.4–22.3lmol l)1
Chla 1.8–61.9 mg m)3
Macrophytes 94–438 g AFDW m)2
Sediment org. matter 6.5–16.6%
where:
P(I) – Light limited photosynthetic rate; I– Irradiance (lmol quanta m)2s)1); a,b andc– Adjustment parameters.
By differentiating this function, the parameters
a (initial slope), Pmax (light saturated
photosyn-thesis) and Iopt (optimal irradiance) can be ex-pressed as a function ofa,b, andc:
a¼1
c mgCðmgChlaÞ
1
h1lmol quanta1m2s
h i
ð2Þ
Iopt¼ ffiffiffi c a r
lmol quanta m2s1
ð3Þ
Pmax¼ 1 bþ2 ffiffiffiffiffi
ac
p hmg Cðmg ChlaÞ1h1i ð4Þ
A variant of this model combined with an Arrhe-nius temperature limitation function was also used following Duarte (1995):
PðI;tÞ ¼I:expðd ðe=tÞÞ
aI2þbIþc mg Cðmg ChlaÞ
1 h1
h i
ð5Þ Where, P(I, t) is Light and temperature limited photosynthetic rate;dandeare parameters of the Arrhenius function; andtis Temperature (°C).
A simplification of this model was made in order to reduce the number of parameters to be estimated, by dividing both the numerator and the denominator by exp(d) (Macedo et al., 2001):
PðI;tÞ ¼ I:expðe=tÞ
a0I2þb0Iþc0 ð6Þ
Again, by differentiating this function, the param-etersa,PmaxandIoptcan be expressed as a function
of a, b, and c. The solution for Iopt is as shown before (Eq. (3)) and the solutions for the former two parameters are shown below (Duarte, 1995):
a¼expðe=tÞ
c ð7Þ
Pmax¼
expðe=tÞ bþ2 ffiffiffiffiffi
ac
p ð8Þ
Thirteen P–I curves were fitted with Eq. (1) (one for each sampling campaign), using the
Quasi-Newton non-linear least-squares regression tech-nique (Statistica software). For some campaigns it was possible to obtain a good fit with Eq. (6) as well (see below) (Macedo et al., 2001). Linear regressions (type II) between observed and pre-dicted values were used to verify the fitting equa-tion. For each curve, the slope of the regression line was checked for significant differences from one and they-intercept was checked for significant differences from zero. The significance of these differences is an indication of a poor fit to ob-served data (Keller, 1989). Also, analysis of vari-ance was used to test for the significvari-ance of the variance explained by the regression line. All sta-tistical analyses were done for a 95% confidence level. P–I curves considered in this study were only those for which all tests confirmed the quality of the obtained fit.
Mathematical simulations
Daily average primary production was calculated for each of the sampling occasions using the above mathematical relationships (1 and 6) integrated over depth and over time with parameters de-scribed in Macedo et al. (2001), simulated light intensity data over a 24-h period, with the equa-tions described in Brock (1981) and Portela & Neves (1994), and measuredin situtemperature.
Results
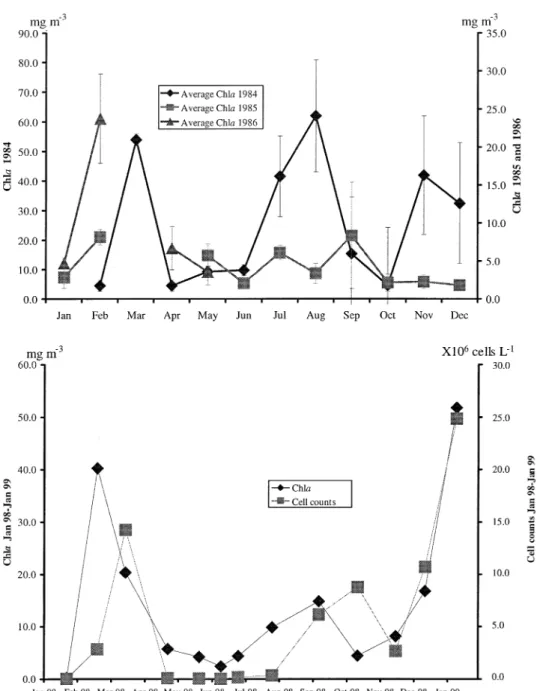
Chla data for St. Andre´ lagoon is shown in Fig-ure 3, for years 1984, 1985 (January–December), 1986 (January–May), 1998 and 1999 (January). Phytoplankton cell counts (Figure 3) were directly correlated with Chla (p<0.05).
The results presented in Figure 4 show that during the January 98–January 99 period, lowest phytoplankton diversity was observed in winter, whereas higher values were observed in spring or late summer. Although the correlation between Chlaand diversity was not significant (p>0.05), it is apparent that minimum diversity corresponds to some of the highest Chl a values, whereas the opposite is true for maximum diversity results (Figs. 3, 4).
In Figure 5, the percentage of different phyto-plankton groups over the sampling period is shown. Dinoflagellates and diatoms were the dominant groups. Lower diversities coincided with periods of dinoflagellate dominance, whereas higher diversities coincided with periods of diatom dominance. Dinoflagellate proportion, after the arc sin transformation (Underwood, 1981), is negatively correlated with diversity (p<0.05). A total of 19 taxa were identified among diatoms, dinoflagellates and euglenophyceans, the less abundant group (Macedo et al., 2001).
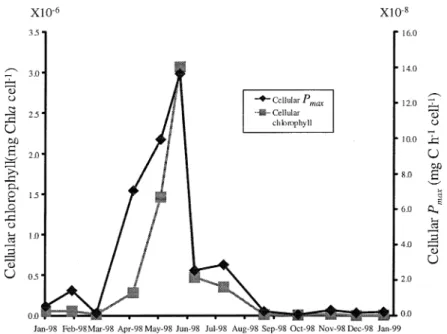
Temporal variability of Pmax (Eq. (4), cf. – values reported in Table II of Macedo et al. (2001)) and maximal volume integrated production (MaxProd) – the product ofPmaxand chlorophyll concentration – showed different patterns (Fig. 6). Both parameters exhibited a high variability.Pmax showed higher values between May and August, with another maximum in October. Minimum values occurred in winter months. MaxProd reached maximum values in some winter months (February and March 1998 and January 1999). However, the lowest value occurred also in winter (January 1999). There is a negative correlation between Pmax and Chl a concentration and the opposite between MaxProd and Chl a (p<0.05). Pmaxis directly correlated solely with temperature. MaxProd is directly correlated with nitrogen and the proportion of dinoflagellates (p<0.05). Highest Pmax values coincided with some of the highest diversities (Figs. 4, 6). Cellular Chl a, obtained from the ratio Chla/cell counts, and cellularPmax,
obtained from the Production/Chl a cell counts ratio, are shown in Figure 7. There is a significant correlation between both variables (p<0.05).
Temporal variability ofais shown in Figure 8.
No significant correlation was found between the initial slope and any other parameter or variable, except a negative correlation with inorganic phosphorus (p<0.05). However, peaks ina
coin-cide with peaks in diversity (cf. Fig. 4).
Figure 9 depicts the parabolic relationship be-tween diversity and MaxProd. A linear relation-ship results in a much lowerR2– 0.436.
In Figure 10 a tree clustering, obtained from the Pearson correlation coefficient, displays two main groups of variables:
(i) An upper group with diversity, equitability, salinity, species richness, Pmax, temperature, cellular Pmax, cellular Chl a, diatom abun-dance anda, the initial slope of P–I curves, at
a much larger linkage distance;
(ii) A lower group with Chl a, cell numbers, pH, MaxProd, the proportion of diatoms, flagellate abundance, the proportion of dino-flagellates, inorganic nutrients and the ratio between nutrient and Chlaconcentrations.
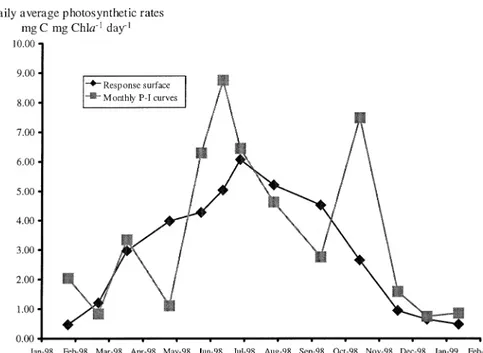
In Figure 11 the results of the mathematical simulations described above (cf. – Methodology – Mathematical simulations) are presented. The comparisons between both data sets by a one-way ANOVA did not reveal any significant differences (p>0.05).
Discussion
high nutrient inputs by runoff in winter months and internal nutrient recycling in summer months. There is a relatively scarcity of data on phyto-plankton species richness. In most studies only major taxonomic groups are listed, or proportions of dominant species given. Considering the
num-ber of phytoplankton species listed for some coastal ecosystems; e.g. the Rhode river estuary (Maryland, USA) (Gallegos, 1992), the Elbe (Germany), the Shelde (Belgium/The Netherlands) and the Girond (France) estuaries (Muylaert & Sabbe, 1999), the Pearl River estuary (China)
(Huang et al., 2004) and the Bras de Port solar salterns in Santa Pola (Spain) (Estrada et al., 2004), species richness in Santo Andre´ lagoon (19 taxa identified) is comparable to the lower values reported – 29 species for the Girond estuary, 18 species for the Rhode river estuary and between 10 and 32 for the Bras de Port solar salterns. How-ever, it is noteworthy that in all these studies the number of samples was much larger than in the
present work. The low species richness in Santo Andre´ lagoon may partly be explained by the frequent overwhelming dominance of Prorocen-trum minimum(up to >90% cell counts) (Macedo et al., 2001) and the alternating periods of low/ high salinity (cf. – Methods, Study Area). If the Shannon diversity index is used for comparison, instead of species richness, the range reported in this study (0.08–2.53 bitts individual)1) (Fig. 4)
Figure 4. Diversity calculated by the Shannon–Wiener function.
includes the range reported in Estrada et al. (2004) (0.5 – ca. 2.6 bitts individual)1), the average value reported for the Pearl river estuary (2.47 bitts individual)1) (Huang et al., 2004) and the value
reported for the Sado estuary (Portugal) by Peneda et al. (1980) – 1.1 bitts individual)1.
The two groups depicted in Figure 10 (cf. – Results) suggest that higher photosynthetic rates
Figure 6. Light saturated photosynthesis (Pmax) and maximal volume integrated production (MaxProd) (see text).
are associated with lower nutrient concentrations and higher temperatures, whereas higher MaxProd values are associated with higher nutrient loads and higher nutrient/Chl a ratios. From these re-sults, it is apparent that higherPmaxvalues are not related to release from nutrient limitation. In this work only nitrogen and phosphorus were consid-ered. However, it is expectable that in winter periods, when MaxProd is higher, runoff trans-ports all potentially limiting nutrients to the la-goon. If this is the case, then higherPmax values may be explained mostly by temperature as sug-gested by the positive and significant correlation
referred above (cf. – Results). This is an expected result since Pmaxis known to be a function of the enzymatic processes in photosynthesis and there-fore it is temperature dependent (Eppley, 1972; Harrison & Platt, 1980; Davison, 1991). The neg-ative correlation betweenPmax and Chla concen-tration and the opposite between MaxProd and Chl a concentration (p<0.05) are expected, since the former is calculated from a ratio where Chlais the denominator and the latter is calculated from a product by Chla (cf. – Results). Generally, when Chlais higher, intra and interspecific competition for light and/or nutrients is more likely to occur
Figure 8. Initial slope (a) of the P–I curves for the study period (see text).
Figure 10. Cluster analysis using the Pearson correlation coefficient and the weighted pair-group average amalgamation scheme. The horizontal line separates two main groups of variables (see text).
reducing Pmax. Further, low Chl a values and corresponding phytoplankton biomasses are not likely to result in high MaxProd, since this is a volume integrated value (cf. – Results).
The coincidence between diversity and a
max-ima (cf. – Results and Figs. 4, 8) and the fact that
ais associated with higherPmax and diversity (cf.
Results and Fig. 10), suggests that phytoplankton assemblages with higher diversity may also be more efficient at low light levels than lower diver-sity assemblages.
The absence of significant differences between the two simulated datasets in Figure 11 (cf. – Results) is not surprising because it is apparent that the curve based on the response surface smoothes out the larger variability of the curve calculated with monthly estimates of the photo-synthetic parameters. Therefore, it is apparent that long-term (seasonal) average estimates of daily productivity are similar. However, short-term estimates may differ by more than 100%. This demonstrates the importance of having data on the temporal variability of the P–I curve parameters. Pmax values estimated by the monthly P–I curves are much larger than maximum values obtained with the response surface obtained for the dino-flagellates, and occur in some of the higher diver-sity periods (Fig. 4). Therefore, it may be speculated that the observed differences were not due solely to temperature effects, already ac-counted for, but also to community diversity. If this is the case, then niche complementarity may be the explanation.
The results presented here on diversity and production are in contradiction to those of Hector et al. (1999) and Tilman et al. (2001), on grassland communities. Whilst these authors suggest that more diverse communities exhibit larger areal production, the results of this work reveal higher maximal volume integrated production under lower diversity. If niche complementarity is at work in St. Andre´ lagoon phytoplankton com-munities, its effect is reflected not on production but on photosynthetic rates. One might then ask the following question: ‘‘Why more productive phytoplankton assemblages are low in diversity?’’ The coexistence of several phytoplankton spe-cies under a few limiting resources has been known as the ‘paradox of plankton’. It has been explained by the non-equilibrium nature of phytoplankton
communities (Krebs, 1994). The model of Huis-man et al. (1999) suggested that the coexistence of several phytoplankton species may be explained by the internal dynamics of competitive interactions, capable of generating chaos and opportunities for several species to coexist under a number of lim-iting resources lower than the number of compet-ing species. Accordcompet-ing to these authors, if the number of limiting factors increases (different factors for different species), there is more room for more species to coexist. The recent modelling study of Yamamoto & Hatta (2004) provides theoretical evidence for the importance of pulsed nutrient supply in increasing phytoplankton diversity. These authors found that nutrient pulses with ‘intermediate frequency’ (corresponding to a period of 9 days) maximised the survival of mod-elled species, in line with the ‘Intermediate Dis-turbance Hypothesis’ (IDH) (Connell, 1978). These studies may help to justify the diversity of plankton communities, from internal dynamics and/or external forcing, but they do not explain why more diverse communities produce less bio-mass in spite of being more efficient.
In one of the rare works where phytoplankton diversity and production were analysed together, Agard et al. (1996) found empirical evidence to support Huston’s dynamic equilibrium hypothesis (Huston, 1979, 1994) (cf. – Introduction) – species richness of Caribbean phytoplankton appeared to be maximized under intermediate conditions of disturbance and primary production. On one hand, low production reduces recovery from mortality and may therefore reduce species diver-sity. On the other hand, higher production may lead to lower diversity through competitive exclu-sion. The parabolic relationship between diversity and MaxProd obtained in the present work agree with those findings (Fig. 9).
maintain high biomasses. Therefore, competitive exclusion is more likely to occur. Later in the year, the lower nutrient concentrations may limit bio-mass growth and production. Furthermore, the number of limiting nutrients is likely to increase, generating adequate conditions for the coexistence of more species, according to Huisman’s hypoth-esis. In summer, when rainfall only rarely occurs, nutrient pulses are limited to phosphorus release from the sediments under episodes of bottom an-oxia (Bernardo, 1990).
In terrestrial vegetation, although limiting nutrients may be less than coexisting species (Krebs, 1994), niche diversity may be larger, since soil heterogeneity and the plant canopy itself may provide more environmental diversity than the relatively homogeneous water column environ-ments and therefore more opportunities for more species. This may help to explain the differences observed between terrestrial and pelagic ecosys-tems, concerning the relationship between diver-sity and production. In fact, similar differences for similar reasons are likely to occur between pelagic and some benthic ecosystems. Algal beds and reefs are generally associated with high diversity and their areal production is among the highest in marine environments (Fig. 1).
From the results discussed so far, the following conclusions may be drawn regarding the St. Andre´ lagoon phytoplankton communities:
(1) Phytoplankton communities with lower diversity are dominated by dinoflagellates, exhibit higher cell numbers, Chla concentra-tions and production, in conjunction with higher nitrogen and phosphorus concentra-tions, than communities with higher diversity. (2) The latter are dominated by diatoms, exhibit the highest photosynthetic rates and efficien-cies, related with higher Chl a cell contents, water temperature, salinity, diversity, species richness and equitability.
(3) These highest photosynthetic rates are not correlated with either inorganic P or inor-ganic N. Temperature may explain part of the observed results as well as niche complementarity.
(4) Seasonal changes in photosynthetic parame-ters do not seem to have a major impact on community production averaged over large
time scales, but have a major impact at daily time scales.
Furthermore, the following hypothesis may be defined:
(1) Higher nutrient loads in a relatively homoge-neous water column may reduce the number of limiting nutrients increasing competitive pressure and leading to high dominance. Low nutrient loads are more likely to result in limitation by more nutrients.
(2) If different species are limited by two or three different nutrients (one per species) there should be more opportunity for more diver-sity to develop due to non-equilibrium oscillations within the community, following Huisman et al. (1999). More diverse com-munities are probably more efficient in uti-lizing irradiance energy due to niche complementarity.
These hypotheses may be tested by experi-mental designs similar to those employed in ter-restrial ecology (Hector et al., 1999; Tilman et al., 2001). These designs imply measuring community production after the random addition of different species and have been criticised by Huston et al. (2000) among other things, due to the fact that random species addition does not mimic either natural or human-caused processes. Ideally, experiments should compare production and photosynthetic rates of different realistic species assemblages, with similar salinity and temperature tolerances, testing simultaneously for the effects of Chl a concentration, that is clearly related to photosynthetic rates (see above), and nutrient additions.
Acknowledgements
The authors wish to thank Maria Joa˜o Guerreiro and two anonymous reviewers for their helpful comments.
References
Agard, J. B. R., R. H. Hubbard & J. K. Griffith, 1996. The relation between productivity, disturbance and the biodi-versity of Caribbean phytoplankton: applicability of Hu-ston’s dynamic equilibrium model. Journal of Experimental Marine Biology and Ecology 202: 1–17.
Banse, K., 1982. Cell volumes, maximal growth rates of uni-vellular algae and ciliates, and the role of ciliates in the marine pelagial. Limnology and Oceanography 27: 1059– 1071.
Bernardo, J. M., 1990. Dinaˆmica de uma lagoa costeira eu-tro´fica (Lagoa de Santo Andre´). Ph.D. Dissertation, Uni-versity of Lisbon, 322 pp.
Brock, T. D., 1981. Calculating solar radiation for ecological studies. Ecological Modelling 14: 1–19.
Cancela da Fonseca, L. M. Q., 1989. Estudo da influeˆncia da ‘‘abertura ao mar’’ sobre um sistema lagunar costeiro: A Lagoa de Santo Andre´. Ph.D. Dissertation, University of Lisbon, 355 pp.
Cancela da Fonseca, L. M. Q., A. M. Costa & J. M. Bernardo, 1989. Seasonal variation of benthic and fish communities in a shallow land-locked coastal lagoon (St. Andre´, SW Por-tugal). Scientia Marina 53: 663–669.
Connell, J., 1978. Diversity in tropical rain forests and coral reefs. Science 199: 1304–1310.
Davison, I. R., 1991. Environmental effects on algal photo-synthesis: temperature. Journal of Phycology 27: 2–8. Dogde, J. D., 1975. The Prorocentrales (dinophyceae). II.
Revision of the taxonomy within the genusProrocentrum. Botanical Journal of the Linnean Society 71: 103–125. Drebes, G., 1974. Marines Phytoplankton. Eine Auswahl der
Helgol der Planktonalgen (Diatomeen, Peridieen) Georg Thieme-Verlag, Stuttgard, 123 pp.
Duarte, P., 1995. A mechanistic model of the effects of light and temperature on algal primary productivity. Ecological Modelling 82: 151–160.
Eilers, P. H. C. & J. C. H. Peeters, 1988. A model for the relationship between light intensity and the rate of photosynthesis in phytoplankton. Ecological Modelling 42: 199–215.
Eppley, R. W., 1972. Temperature and phytoplankton growth in the sea. Fisheries Bulletin 70: 1063–1084.
Estrada, M., P. Henriksen, J. M. Gasol, E. O. Casamayor & C. Pedro´s-Alio´, 2004. Diversity of planktonic photoauto-trophic microorganisms along a salinity gradient as de-picted by microscopy, flow cytometry, pigment analysis and DNA-based methods. FEMS Microbiology Ecology 49: 281–293.
Gallegos, C. L., 1992. Phytoplankton photosynthesis, produc-tivity, and species composition in a eutrophic estuary: comparasion of bloom and non-bloom assemblages. Marine Ecology Progress Series 81: 257–267.
Platt, T., 1980. Variations in assimilation number of coastal marine phytoplankton: Effects of environmental co-variates. Journal of Plankton Research 2: 249–260.
Hasle, G. R., 1978. The inverted microscope method. In Sournia, A. (ed.), Monographs on Oceanographic Methodology, 6. Phytoplankton Manual. UNESCO, Paris: 148–150. Hasle, G. R., E. E. Syvertsen, K. A. Steidinger & K. Tangen,
1996. Identifying marine diatoms and dinoflagellates. In
Tomas C. R. (ed.), Identifying Marine Phytoplankton. Academic Press, pp. 387–584.
Hector, A., B. Schmid, C. Beierkuhnlein, M. C. Caldeira, M. Diemer, P. G. Dimitrakopoulos, J. A. Finn, H. Freitas, P. S. Giller, J. Good, R. Harris, P. Hogberg, K. Huss-Danell, J. Joshi, A. Jumpponen, C. Korner, P. W. Leadley, M. Loreau, A. Minns, C. P. Mulder, G. O’Donovan, S. J. Otway, J. S. Pereira, A. Prinz & D. J. Read, 1999. Plant diversity and productivity experiments in european grasslands. Science 286: 1123–1127.
Holm-Hansen, O., C. J. Lorenzen, R. W. Holmes & J. H. D. Strickland, 1965. Fluorometric determination of chlorophyll. Journal du Conseil, Conseil permanent International pour l’Exploration de la Mer 30: 3–15.
Huang, L., W. Jian, X. Song, X. Huang, S. Liu, P. Qian, K. Yin & M. Wu, 2004. Species diversity and distribution for phy-toplankton of the Pearl River estuary during rainy and dry seasons. Marine Pollution Bulletin 49: 588–596.
Huisman, J., V. Opstveen & F. J. Weissing, 1999. Critical depth and critical turbulence: two different mechanisms for the development of phytoplankton blooms. Limnology and Oceanography 44: 1781–1787.
Huston, M. A., 1979. A general hypothesis of species diversity. American Naturalist 113: 81–101.
Huston, M. A., 1994. Biological Diversity: The Coexistence of Changing Landscapes. Cambridge University Press, Cam-bridge, 681 pp.
Huston, M. A., L. W. Arssen, M. P. Austin & B. S. Cade, 2000. No consistent effect of plant diversity on productivity. Sci-ence 289: 1255a.
ICES C. M., 1996/L:3. Biological Oceanography Committee. Report of the working group on phytoplankton ecology. Ref: C+E+Env: pp. 28–30.
Keller, A. A., 1989. Modelling the effects of temperature, light and nutrients on primary productivity: an empirical and mechanistic approach compared. Limnology and Oceanog-raphy 34: 82–95.
Krebbs, C. J., 1994. Ecology: The Experimental Analysis of Distribution and Abundance, 4a edn. Harper Collins College Publishers, 801 pp.
Macedo, M. F., J. G. Ferreira & P. Duarte, 1998. Dynamic behavior of photosynthesis-irradiance curves determined from oxygen production during variable incubation periods. Marine Ecology Progress Series 165: 31–43.
Macedo, M. F., P. Duarte, P. Mendes & J. G. Ferreira, 2001. Annual variation of environmental variables, phytoplankton species composition and photosynthetic parameters in a coastal lagoon. Journal of Plankton Research 23: 719–732. Muylaert, K. & K. Sabbe, 1999. Spring phytoplankton
assem-blages in and around the maximum turbidity zone of estu-aries of the Elbe (Germany), the Schelde (Belgium/The Netherlands) and the Gironde (France). Journal of Marine Systems 22: 133–149.
Pahl-Wostl, C. & D. M. Imboden, 1990. DYPHORA - a dy-namic model for the rate of photosynthesis of algae. Journal of Plankton Research 12: 1207–1221.
Pearl, H. W., 1988. Nuisance phytoplankton blooms in coastal, estuarine, and inland waters. Limnology and Oceanography 33: 823–847.
Peneda, M. C., M. M. Cruces, J. L. Biscaya, M. C. Santos, 1980. Preliminary evaluation of physico-chemical and bio-logical data collected during a yearly cycle in the Sado estuary. In Actual Problems of Oceanography in Portugal. Junta Nacional de Investigac¸a˜o Cientı´fica e Tecnolo´gica and NATO Marine Sciences Panel Lisbon Portugal. pp. 171–188.
Portela, L.I. & R. Neves, 1994. Modelling temperature distri-bution in the shallow Tejo estuary. In Tsakiris, G. & M. A. Santos (eds), Advances in Water Resources Technology and Management. Balkema, Rotterdam: 457–463.
Shaw, P. J. & D. A. Purdie, 2001. Phytoplankton photo-synthesis-irradiance parameters in the near-shore UK coastal waters of the North Sea: temporal variation and environmental control. Marine Ecology Progress Series 216: 83–94.
Steeman Neilsen, E., 1952. Inactivation of the photochemical mechanism in photosynthesis as a means to protect cells
against to high light intensities. Physiologica Plantarum 15: 161–171.
Tilman, D., P. B. Reich, J. Knops, D. Wedin, T. Mielke & C. Lehman, 2001. Diversity and productivity in a long-term grassland experiment. Science 294: 843–845.
Throndsen, J., 1978. Preservation and storage. In Sournia, A. (ed.), Monographs on Oceanographic Methodology, 6. Phytoplankton Manual. UNESCO, Paris: 69–74. Underwood, A. J., 1981. Techniques of analysis of variance in
experimental marine biology and ecology. Oceanography and Marine Biology Annual Review 19: 513–605.
Whittaker, R. H. & G. E. Likens, 1975. The biosphere and man. In Lieth, H. & R. H. Whittaker (eds), Primary Productivity of the Biosphere. Springer-Verlag, Berlin: 305–328.
Yamamoto, T. & G. Hatta, 2004. Pulsed nutrient supply as a factor inducing phytoplankton diversity. Ecological Model-ling 171: 247–270.