Critical Slowing Down Governs the Transition
to Neuron Spiking
Christian Meisel1,2*, Andreas Klaus1, Christian Kuehn3, Dietmar Plenz1
1Section on Critical Brain Dynamics, National Institute of Mental Health, Bethesda, Maryland, United States of America,
2Department of Neurology, University Clinic Carl Gustav Carus, Dresden, Germany,3Institute for Analysis and Scientific Computing, Vienna University of Technology, Vienna, Austria
Abstract
Many complex systems have been found to exhibit critical transitions, or so-called tipping points, which are sudden changes to a qualitatively different system state. These changes can profoundly impact the functioning of a system ranging from controlled state switching to a catastrophic break-down; signals that predict critical transitions are therefore highly desir-able. To this end, research efforts have focused on utilizing qualitative changes in markers related to a system’s tendency to recover more slowly from a perturbation the closer it gets to the transition—a phenomenon called critical slowing down. The recently studied scaling of critical slowing down offers a refined path to understand critical transitions: to identify the transition mechanism and improve transition prediction using scaling laws.
Here, we outline and apply this strategy for the first time in a real-world system by study-ing the transition to spikstudy-ing in neurons of the mammalian cortex. The dynamical system ap-proach has identified two robust mechanisms for the transition from subthreshold activity to spiking, saddle-node and Hopf bifurcation. Although theory provides precise predictions on signatures of critical slowing down near the bifurcation to spiking, quantitative experimental evidence has been lacking. Using whole-cell patch-clamp recordings from pyramidal neu-rons and fast-spiking interneuneu-rons, we show that 1) the transition to spiking dynamically cor-responds to a critical transition exhibiting slowing down, 2) the scaling laws suggest a saddle-node bifurcation governing slowing down, and 3) these precise scaling laws can be used to predict the bifurcation point from a limited window of observation. To our knowledge this is the first report of scaling laws of critical slowing down in an experiment. They present a missing link for a broad class of neuroscience modeling and suggest improved estimation of tipping points by incorporating scaling laws of critical slowing down as a strategy applica-ble to other complex systems.
Author Summary
Neurons efficiently convey information by being able to switch rapidly between two differ-ent states: quiescence and spiking. Such sudden shifts to a qualitatively differdiffer-ent state are
OPEN ACCESS
Citation:Meisel C, Klaus A, Kuehn C, Plenz D (2015) Critical Slowing Down Governs the Transition to Neuron Spiking. PLoS Comput Biol 11(2): e1004097. doi:10.1371/journal.pcbi.1004097
Editor:Boris S. Gutkin, École Normale Supérieure, College de France, CNRS, FRANCE
Received:May 23, 2014
Accepted:December 18, 2014
Published:February 23, 2015
Copyright:This is an open access article, free of all copyright, and may be freely reproduced, distributed, transmitted, modified, built upon, or otherwise used by anyone for any lawful purpose. The work is made available under theCreative Commons CC0public domain dedication.
Data Availability Statement:All relevant data are within the paper and its Supporting Information files.
observed in many complex systems; the often dramatic consequences of these tipping points for diverse fields such as economics, ecology, and the brain have spurred interest to better understand their transition mechanisms and predict their sudden occurrences. By studying the transition from neuronal quiescence to spiking, we show that the quantitative scaling laws for critical slowing down, i.e., a system’s tendency to recover more slowly from perturbations upon approaching its transition point, inform about the underlying bi-furcation mechanism and can be used to improve the prediction of a system’s
tipping point.
Introduction
Rapid transitions to a qualitatively different state can be observed in many complex systems. Their sometimes catastrophic outcomes in systems from diverse fields such as climate, ecology, medicine and economics have led to an increased interest in the underlying structure and dy-namics of these transitions [1,2]. While the consequences of such shifts are often undesired, the proximity to a transition can also have various beneficial aspects such as to allow for rapid switching between different states and for small changes to have a large effect on the system state. In the brain, for example, this double-edged role is illustrated by the unwanted transition from normal to epileptic brain activity on one side [3,4], and, on the other side, the role state transitions play in changing between mutually exclusive motor programs [5] or the generation of action potentials to efficiently convey information.
Better insight into these transitions has come from a dynamical systems’perspective. For in-dividual neurons, this approach identified two robust mechanisms for the transition from sub-threshold near-steady activity to repetitive spiking, saddle-node and Hopf bifurcation [6–9]. The type of threshold behavior predicted by these bifurcations has been able to account for var-ious observations in biological neurons. For example, the smooth frequency vs. current (f-I) curve observed in pyramidal neurons stimulated with steady current is predicted by a saddle-node on invariant cycle bifurcation [8,10]. Conversely, a discontinuous f-I curve characterized by an abrupt onset of firing as current injection is ramped up has been discussed in the context of an underlying (subcritical) Hopf bifurcation [7,10,11]. Although the above mapping be-tween bifurcation and continuity of the f-I curve is not perfect [7] and the experimental deter-mination of the underlying bifurcation to spiking can be problematic [12–14], these differences in f-I curves have led to a classification of neurons according to type 1 and type 2 behavior re-ferring to continuous and discontinuous f-I curves, respectively. However, other crucial predic-tions following from theory of bifurcapredic-tions have not been demonstrated experimentally. In particular, theory implies that system dynamics should recover more slowly from small pertur-bations upon approaching the bifurcation or tipping point, a phenomenon called critical slow-ing down [15]. Critical slowing down can be monitored by measuring the recovery rate of system variables after small perturbations but also manifests itself by an increase in its fluctua-tions, i.e. variance due to the longer relaxation times near the bifurcation, as well as higher au-tocorrelation values [16,17]. Although theory provides precise quantitative predictions on signatures of critical slowing down for different bifurcations, direct experimental evidence in neurons approaching their spiking threshold has been lacking. The confirmation of critical slowing down and its characteristic scaling in biological neurons therefore represents a missing link between experiment and theory [18] relevant for a large class of neuroscience modeling.
Critical slowing down has furthermore attracted considerable attention in a wide range of systems outside of neuroscience. In many real-world settings, warning signals of impending
critical transitions are highly desirable because it is often difficult to revert a system to the pre-vious state once a critical transition has occurred [1,19]. While qualitative changes in markers related to slowing down have previously been used to probe the proximity to a tipping point in various systems [20–24], a quantification of their scaling laws, to our knowledge, has never been attempted in an experimental setting. Consequently, the affirmation of scaling laws of critical slowing down in a real-world system could offer refined approaches to the prediction of tipping points by incorporating knowledge about these scaling relations.
In the present work, we quantitatively study the scaling laws of critical slowing down for the transition from quiescence to spiking in cortical neurons recorded in the acute brain slice. We show that this transition equates a critical transition exhibiting slowing down where changes in variance and recovery rate are necessary consequences when the bifurcation point is ap-proached. Using bifurcation theory we derive the precise scaling laws relevant in the context of neuronal spiking and compare them to the scaling of variance and recovery rate observed in bi-ological neurons. Our analysis suggests the scaling of these markers of critical slowing down to be governed by a saddle-node bifurcation in both type 1 and type 2 neurons. Furthermore, in-corporation of these scaling laws improves bifurcation point prediction from a limited window of observation. To our knowledge this work represents the first quantitative analysis of scaling laws governing critical slowing down in a real-world experimental system.
Results
Critical slowing down near the transition to spiking in biological neurons
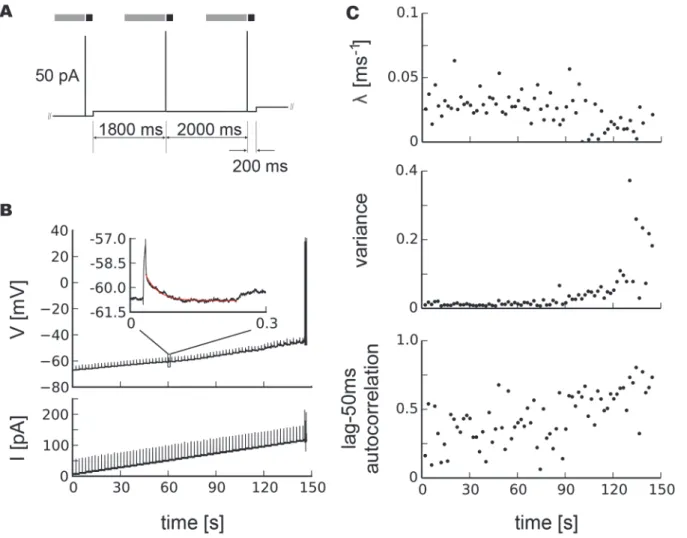
Using the whole-cell patch configuration and acute slices prepared from 2–4 week old rats, we recorded intracellularly the membrane potential of cortical pyramidal neurons and fast-spiking interneurons in response to current injections. We developed a stimulation protocol that al-lowed us to monitor markers of critical slowing down [1,2,16] while systematically increasing the injected current to drive the neuron towards its spiking threshold, i.e. tipping point (Fig. 1 a, b). Specifically, while GABAergic and glutamatergic synaptic transmission was blocked by bath application of PTX (50μM) and AP5/DNQX (50μM/10μM), respectively, we applied a slowly depolarizing step current to gradually drive the membrane potential towards the spiking threshold. In addition to the step current, we applied brief, subthreshold current pulses at regular intervals as small perturbations. When the neuron started to spike the current injection was stopped. We quantified the neuron’s recovery to each perturbation by fitting an exponential decay to the return of the membrane potential trajectory within a few hundred milliseconds to derive a recovery rateλ(Fig. 1 b). The unperturbed one—second segments
be-fore the current pulses were used to calculate variance and autocorrelation from subthreshold voltage. Starting at the resting membrane potential, recovery rates exhibited a gradual decline which became more pronounced towards the spiking threshold. Concomitantly, autocorrela-tion and variance showed a marked increase towards the membrane potential value at which spiking started (Fig. 1 c). The decrease in recovery rate together with the increase in variance and autocorrelation amount to conclusive evidence for critical slowing down in subthreshold neuronal activity prior to spiking.
theory makes precise predictions for the scaling of these markers of critical slowing down. In the following, we will outline in more detail, why it is reasonable to look for critical slowing down in the statistics of subthreshold membrane potential fluctuations near a neuron’s transi-tion from quiescence to spiking. Specifically, we will first present the quantitative scaling laws predicted by theory and second relate them to the scaling observed in experimental measure-ments from biological neurons.
Statistical scaling laws of critical slowing down predicted
by bifurcation theory
Quiescence or spiking can be regarded as two different states a neuron can be in. The mathe-matical study of such transitions is called bifurcation theory. From a dynamical systems’point of view, a neuron’s transition from quiescence to spiking therefore corresponds to a bifurcation in neuron dynamics. It is because of this proximity to a bifurcation that neurons are excitable, i.e., have the ability to exhibit a qualitative change in their dynamics. Neurons can be driven from quiescence toward their spiking threshold by slowly increasing current injections. The Fig 1. Critical slowing down before neuronal spiking in a pyramidal neuron.a, Current stimulation protocol, gray areas mark segments from which variance and autocorrelation were calculated, black areas segments used to determine recovery rates. b, Time course of the membrane potential subject to brief perturbations by current injections on top of a slowly depolarizing step current. The inset shows a magnification of the voltage response to a short current injection and an exponential fit to its recovery (red line). c, Recovery ratesλafter perturbations, variance and lag-50ms autocorrelation in the subthreshold voltage, in this case for a pyramidal neuron.
observation of a very drastic end of quiescence (or steady-state) upon increase of the injected current beyond a certain threshold suggests that the most likely dynamical transitions are ei-ther a saddle-node or a Hopf bifurcation. A saddle-node bifurcation (i.e. a saddle-node bifurca-tion or a saddle-node bifurcabifurca-tion on an invariant circle bifurcabifurca-tion) is characterized by a single eigenvalue of the linearized subsystem passing through the imaginary axis. A Hopf bifurcation (i.e. a subcritical Andronov-Hopf bifurcation) has a complex conjugate pair of eigenvalues passing through the imaginary axis [7,30–32]. These insights yield the important conclusion that, no matter how one decides to model neurons, one has to analyze the statistics near sad-dle-node and Hopf bifurcations to obtain the scaling laws near the transition to spiking. Be-sides being near a local bifurcation, moderate noise levels in the system are a necessary condition to observe critical slowing down, as dynamics could instantly jump to a different at-tractor when noise levels are too high.
Here, we first review the scaling laws governing subthreshold dynamics for both saddle-node and Hopf bifurcation. These scaling laws for recovery rate and variance are known analyt-ically [33]. We will derive the scaling for recovery rate for saddle-node and Hopf bifurcation relevant for the transition to neuronal spiking from their bifurcation normal forms and numer-ically illustrate the scaling relations for both bifurcations in a model system that captures our experimental approach.
Normal forms
Normal forms are model systems associated with a bifurcation exemplifying the bifurcation type. A normal form of a saddle-node bifurcation is
dV
dt ¼yþV 2
: ð1Þ
There are two equilibriaV¼ pffiffiffiffiffiffiyfory<0 and the saddle-node bifurcation occurs for
yc= 0. The equilibriumV ≔ pffiffiffiffiffiffiyis stable since the linearized system aroundV−is
dX
dt ¼ ðDVfÞðV ÞX¼ 2V X¼ 2
ffiffiffiffiffiffiy
p X: ð2Þ
Here,yis the parameter which controls the distance to the bifurcation. In our patch experi-ment, this was the difference between the current at which spiking occurred and the current in-jected. If one assumesyquasi-stationary, we may solve (2) and obtain
XðtÞ ¼Xð0Þe 2pffiffiffiffiyt: ð3Þ
Equation (3)implies that when dynamics is perturbed slightly away from the stable equilib-riumV−fory<0 the trajectory will return toV−exponentially fast and the exponent scales
likeOðpffiffiffiffiffiffiyÞin terms of they-variable asy%0. Consequently, the closer one gets to the
bifur-cation pointyc= 0, the longer it takes to recover from a perturbation which is the well-known
phenomenon of critical slowing down or intermittency [1,15,34]. The factor 2pffiffiffiffiffiffiyis also
refered to as the recovery rateλ[33] or as the first Lyapunov exponent [35].
For the Hopf bifurcation the scaling law for recovery rate can be derived in a similarly straightforward fashion. The normal form of the (subcritical) Hopf bifurcation is given by
dV1
dt ¼ yV1 V2þV1ðV 2 1 þV
2
2Þ; ð4Þ
dV2
dt ¼ V1þyV2þV2ðV 2 1 þV
2
The equilibriumV1= 0 =V2is stable fory<0 and the Hopf bifurcation occurs atyc= 0.
Linearizing around the equilibrium yields
dX1
dt ¼ yX1 X2; ð6Þ
dX2
dt ¼ X1þyX2; ð7Þ
so that the recovery rate scales withOðyÞasy%0 for the Hopf bifurcation.
The same scaling laws for recovery rate also hold when moderate noise levels are included as is often the case in biological systems. Furthermore, the inclusion of noise terms in the nor-mal forms allows the derivation of scaling laws for variance as a function of the distance to the bifurcation. These scaling laws for recovery rateλand variancevunder noise conditions have
been analytically derived elsewhere and can be summarized, under suitable technical assump-tions [36,37], by
l ð yÞ0:5;
v ð yÞ 0:5 ð8Þ
for saddle-node, and
l ð yÞ1:0
;
v ð yÞ 1:0 ð9Þ
for Hopf bifurcation asy%0 =yc, whereycis the bifurcation point.
Scaling at saddle-node bifurcation and Hopf bifurcation in a model system
As an illustration of the scaling laws governing critical slowing down we modeled the dynamics near saddle-node and Hopf bifurcation in a way that directly relates to our experimental work. Specifically, we were interested in the scaling of variance and recovery rate near these bifurca-tions. Since we are mainly interested in the scaling of critical slowing down near the transition to continuous spiking, whose dynamics can be shown to be determined by the local bifurcation in question [7,38], we study the scaling using normal forms of saddle-node and Hopf bifurca-tion, respectively. Furthermore, the focus on normal forms allows our results to be applied to other systems besides neuron models. For the study of these scaling laws in specific neuron models we refer the reader to [18].
We modeled the saddle-node bifurcation by
dV ¼ ð yþrV2
Þdtþs1 dW1þs2;
dy ¼ edt: ð10Þ
Note that (10) takes the form of a non-noisy saddle-node normal form forσ1=σ2=ε= 0.V
can be interpreted as the membrane potential. The second term corresponds to additive white noise of sizeσ1>0 while the third termσ2=σ2(t) desribes small impulsive perturbations onto
the dynamics triggered at fixed deterministic time pointsti= 60. The second equation describes
the slowly changing control parameterygoverned by time scaleεwhich drives the system
to-wards the bifurcation point. In the experimental setting,y=Ic−Icorresponds to the distance
to the critical current at which spiking starts,εis related to the rate by which current is injected
into the cell,σ1describes the Gaussian noise level in the system andσ2the size of small external
perturbations in the form of brief injected current pulses (see experimental stimulation proto-col for details). In the following we setε= 0.001,ρ= 0.1,σ
the trajectory of a single stochastic sample path starting from the initial conditionsy0= 1.6 and
V0=−4. Here, the bifurcation occurs at (Vc,yc) = (0, 0) (red dot) which corresponds to time
tc= (y0−yc)/ε= 1600 (red vertical lines inFig. 2 b, c).
In terms of a neuron’s underlying electrophysiology, the scaling of critical slowing down can be understood by considering the nonmonotonic I-V curve observed at a saddle-node on a limit cycle bifurcation (SNIC) [8,12,14,39]. Such a nonmonotonic curve implies a local maxi-mum above which depolarization activates a net inward current. Until this maximaxi-mum is reached inputs are integrated. These integration properties are similar to RC circuits. Near the maximum or tangent point, the shape of the steady state I-V curve is approximated as a parab-ola in the normal form framework (Fig. 2 a). AsIc−I=yis further decreased, there are two
branches, a stable (left) and an unstable one (right). The slope of the I-V curve (or normal form parabola) can, in biological terms, be interpreted as the instantaneous conductanceg. When linearized about the stable branch, as shown above for normal forms, it follows that g ffiffiffiffiffiffiffiffiffiffiffiI
c I p
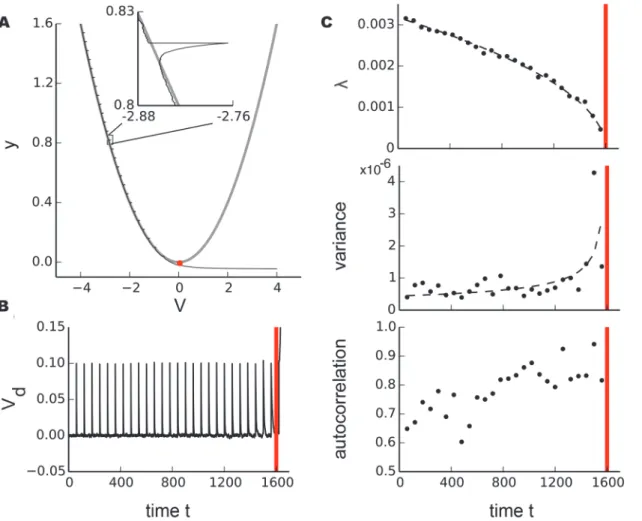
. In integrators such as a RC circuits, the recovery time constant scales with Fig 2. Illustration of stochastic scaling laws near the saddle-node (fold) bifurcation in a model system.a, Phase space with a single stochastic sample path (black) of a saddle-node bifurcation (eq. 10) for the initial condition (V(0),y(0)) = (−4, 1.6) withσ1= 0.001,ε= 0.001 and small perturbations of sizeσ2(ti)
= 0.1 withti= 60. The bifurcation occurs at (Vc,yc) = (0, 0) (red dot). The gray curves are the system equilibria (forε= 0). b, Sample pathVdplotted as a time series where the equilibrium values have been subtracted (i.e. detrending along the equilibrium branch). c, Scaling of recovery rateλ, variancevand autocorrelation as dynamics approaches the bifurcation point (red vertical line). Recovery rate and variance follow a power-law scaling with exponents±0.5 illustrated by black dashed lines.
C/g. Consequently, the recovery rate, being the inverse of the time constant, will scale like
l ffiffiffiffiffiffiffiffiffiffiffiI
c I p
.
To visualize this scaling, we detrendedV(t) by subtraction of the stable branch and analyzed the time seriesVd(t) (Fig. 2 b) for markers of critical slowing down as dynamics approached
the saddle-node bifurcation. Analogously to the experimental protocol, we fit an exponential decay
VdðtÞ ¼a∙ e ltþb ð11Þ
for the 5000 sample points following each perturbation of sizeσ2to obtain the recovery rateλ
and calculated variance and autocorrelation (at lag 100) for the 5000 sampling points of the un-perturbed membrane potential preceding each perturbation. While the recovery rate decreases, the variance of the unperturbed signal will increase due to the longer relaxation times near the bifurcation.Fig. 2 cillustrates the scaling for recovery rate and variance with exponents ±0.5 as expected for a saddle-node bifurcation as well as the increase in autocorrelation values.
To illustrate the scaling at a Hopf bifurcation we modeled it by
dV1 ¼ yV1 V2þV1ðV 2 1 þV
2
2Þdtþs1 dW1þs1 dW2þs3;
dV2 ¼ V1þyV2þV2ðV 2 1 þV
2
2Þdtþs2 dW1þs2 dW2þs3;
dy ¼ edt:
ð12Þ
As for the saddle-node bifurcation, (12) takes the form of a non-noisy Hopf normal form forσ1=σ2=σ3=ε= 0 (eq. (4)). BothV1andV2exhibit the same scaling behavior, so either
one can be interpreted as the membrane potential. Again, white noise of sizeσ1andσ2is added
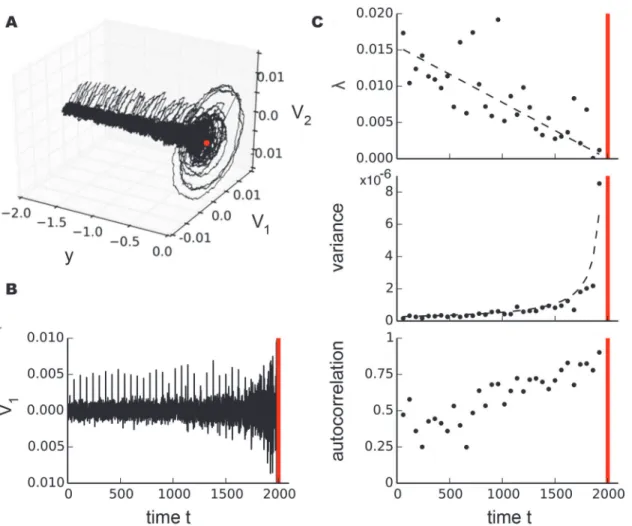
andσ3desribes the small impulsive perturbations. We setε= 0.02,σ1=σ2= 0.01 andσ3= 0.05.
Fig. 3 ashows the trajectory of a single stochastic sample path starting from the initial condi-tions (V1(0),V2(0),y0) = (0, 0,−2). The bifurcation occuring at (V1c,V2c,yc) = (0, 0, 0) (red
dot) corresponds to timetc= 2000 (red vertical lines inFig. 3 b, c). It has been noted that the
membrane near the bifurcation behaves as an underdamped RLC circuit [40]. We derived the recovery rate by fitting the 500 sampling points interval after each perturbation of sizeσ3and
variance and autocorrelation from the 5000 sample point segment preceding each perturba-tion.Fig. 3 cillustrates the scaling for recovery rate and variance with exponents ±−1 as
ex-pected for a Hopf bifurcation. This analysis on model systems demonstrates that, in principle, different bifurcation types can be distinguished by the different scaling laws of critical slowing down governing statistics near the tipping point.
Scaling laws of critical slowing down in biological neurons
We next investigated whether the predicted scaling from theory can be observed in experiment. We thereby focused on neurons for which type 1 and type 2 behaviors have been reported.
Pyramidal neurons
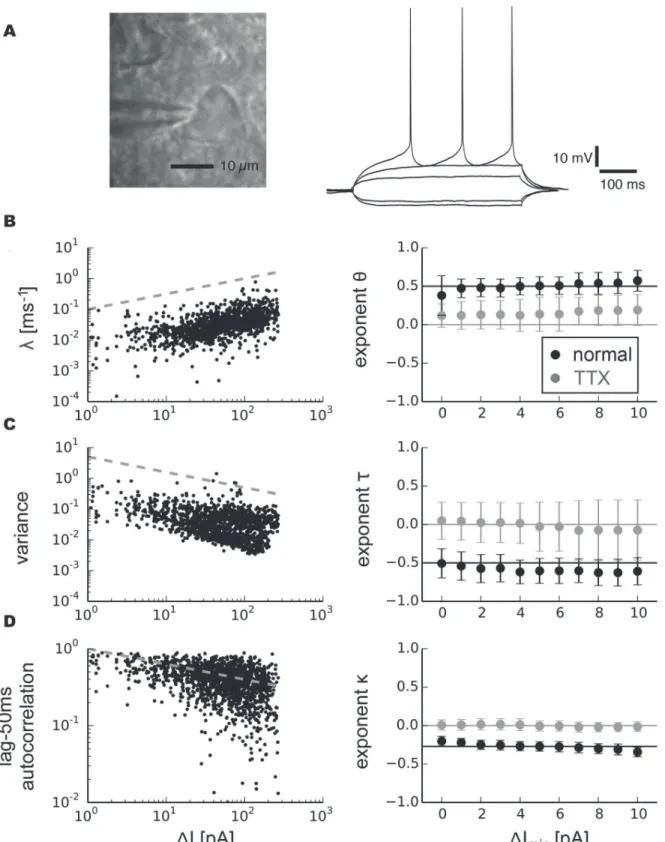
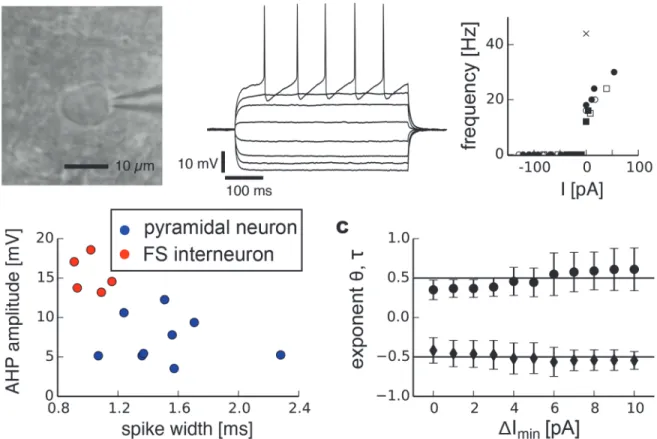
Pyramidal neurons have been suggested to be governed by type 1 behavior under normal con-ditions [7,8,10,13]. We identified pyramidal neurons by their typical pyramidal morphology (Fig. 4 a), comparatively long-duration action potentials and small afterhyperpolarizations (AHPs).Fig. 4 ashows typical spiking responses of a pyramidal neuron subjected to injected currents with different amplitude levels. In our experimental protocol, we defined the critical currentIcas the average current over the one—second interval prior to the onset of spiking.
The distance to the bifurcation in our experimental setup is consequently given byΔI=Ic−I
which corresponds toyin our model systems. We fit the recovery rateλfor each cell and each
trial (n = 9 cells with a total of 22 trials) toΔIbyλ=a
exponents were independent of the choice of fit intervals, we fitλfor a range of data segments
with different minimal valuesΔImin. The results revealed aθclose to 0.5 (Fig. 4 b, black
mark-ers,
θ= 0.50 ± 0.05, mean value ± s.d.). The fitted exponentsτfor variance robustly centered around a value close toτ=−0.5 for sufficiently long segment lengths for which variance was
determined (Fig. 4 c, black markers,τ=−0.58 ± 0.04). The autocorrelation similarly exhibited
a power-law increase for smallerΔI(Fig. 4 d, black markers). The corresponding exponent
κdepended on the lag for which the autocorrelation was measured.
The transition to spiking in pyramidal neurons occurs within a depolarized voltage range in which many different mechanisms could influence the membrane potential trajectory. In addi-tion to voltage-gated sodium channels, transient A-type potassium channels, low-threshold voltage-gated calcium channels as well as current flow between dentrites and the soma could contribute to the observed change in recovery rate and variance near spike threshold. However, blocking voltage-gated sodium channels in a subgroup of cells (n = 5, 13 trials) by bath applica-tion of 1μMtetrodotoxin (TTX) completely abrogated spiking at the critical currentIcalong
Fig 3. Illustration of stochastic scaling laws near the subcritical Hopf bifurcation in a model system.a, Phase space with a single stochastic sample path (black) of a Hopf bifurcation (eq. 12) for the initial condition (V1(0),V2(0),y0) = (0, 0,−2) withσ1, 2= 0.001,ε= 0.001 and small perturbations of sizeσ3(ti)
= 0.005 withti= 60. The bifurcation occurs at (V1c,V2c,yc) = (0, 0, 0) (red dot). b, Sample pathV1plotted as a time series used for further analysis. c, Scaling
of recovery rateλ, variancevand autocorrelation as dynamics approaches the bifurcation point (red vertical line). Recovery rate and variance follow a power-law scaling with exponents±1 illustrated by black dashed lines.
Fig 4. Scaling analysis of indicators related to critical slowing down in pyramidal neurons.a, photomicrograph of a neuron with pyramidal morphology and typical responses to depolarizing and hyperpolarizing currents. b, Recovery rate as a function ofΔI, the distance to the bifurcation point, for all trials combined and fitted exponents averaged over individual trials and for different minimal valuesΔIminfor normal conditions (right, black markers, standard deviation) and after bath application of tetrodotoxin (right, gray markers, standard deviation). c, Variance. d, Autocorrelation. Grey dashed lines on the left side show power-laws with exponent 0.5 for recovery rate, -0.5 for variance and -0.27 for autocorrelation.
with all signatures of critical slowing down (Fig. 4 b–dright side, gray markers). This demon-strated that experimentally observed critical slowing down arises from the basic mechanism that initiates the onset of spiking. Our analysis of critical slowing down in subthreshold statis-tics yielding exponents ±0.5 is therefore in good agreement with a saddle-node bifurcation un-derlying the transition to spiking in pyramidal neurons.
Fast-spiking interneurons
Type 2 behavior is often assumed to be related to a Hopf bifurcation, although it has been stressed that such a direct mapping is not warranted [7]. To investigate the scaling of critical slowing down in type 2 neurons we extended our analysis to fast-spiking (FS) interneurons. Detailed previous analyses of threshold dynamics in FS interneurons have suggested that these neurons exhibit type 2 behavior characterized by a discontinuous f-I curve [10]. FS interneu-rons were identified by a nonpyramidal morphology and round soma (Fig. 5 a), short duration of action potentials and strong after-hyperpolarization. Furthermore, when stimulated by cur-rent injection we sometimes observed slow oscillations in the membrane potential of FS neu-rons but never in pyramidal neuneu-rons.Fig. 5 a(middle) shows typical spiking responses of a FS interneuron subjected to injected currents with different amplitude levels as well as the discon-tinuity in f-I curves where the frequency jumps to a relatively high value at the onset of spiking (right). These electrophysiological differences allowed it to reliably distinguish them from
pyramidal neurons (Fig. 5 b). In all cells investigated (n = 5, 15 trials) we observed a drecrease in recovery rate and increases in variance and autocorrelation as signatures of critical slowing down upon approaching the spiking threshold. Scaling exponents for recovery rate (θ= 0.48 ± 0.10) and variance (τ=−0.51 ± 0.05) closely resembled those of a saddle-node bifurcation but
not a Hopf bifurcation (Fig. 5 c).
Prediction of spiking threshold based on critical slowing down
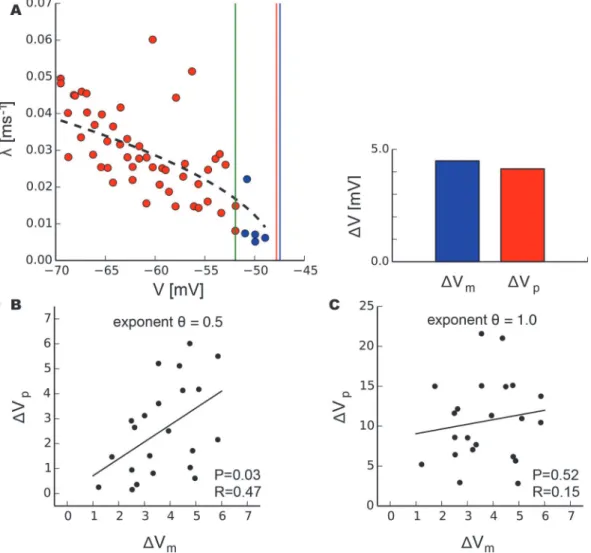
We hypothesized that the knowledge of the bifurcation that underlies a critical transition could offer a refined approach to predict the bifurcation point from a limited window of observation by using the precise scaling laws governing slowing down. This approach is motivated by many real-world systems exhibiting rare but often catastrophic transitions to a different state. Any in-sights to better anticipate and predict those transitions would therefore be highly desirable [2]. In particular, it is likely that the control parameter driving the system towards the tipping point, in our case the injected current, may not be directly accessible, but that instead one might be able to monitor some other observable of the system, such as the membrane potential in our experiment. Accordingly, we attempted to predict the voltageVp
c at which spiking occurs in pyramidal neurons using only measurements of recovery rate as a function of the neuron’s membrane potential. Omitting the five last data points before spiking (Fig. 6 a, blue markers), we fitλto the membrane potential byl¼aðVp
c VÞ
y
for the remainder of measurements (Fig. 6 a, red markers). This fit allowed the determination ofVp
c as a fit parameter ifθis known (Fig. 6 a, red vertical line). We compared this predicted value to the measured critical mem-brane potentialVm
c defined as the average voltage over the one—second interval prior to spik-ing (Fig. 6 a, blue vertical line) analogous to the definition ofIc. The differences between
predictedVp
c and measuredVcmto the last value taken into account for fitting (Fig. 6 a, green vertical line), i.e.ΔVpandΔVm, exhibited a significant correlation when data were fit with the
saddle-node exponentθ= 0.5 (Fig. 6 b). Conversely, there was no significant correlation when prediction was attempted with the exponentθ= 1.0 for a Hopf bifurcation (Fig. 6 c). This dem-onstrates that the knowledge of the underlying bifurcation and its scaling relations for slowing down can be used to estimate the bifurcation point from observation of data.
Discussion
We showed that the subthreshold membrane potential trajectory in cortical pyramidal neurons and fast-spiking interneurons in the acute slice exhibits critical slowing down indicated by dis-tinct changes in recovery rate, variance and autocorrelation prior to the onset of spiking. To our knowledge, this work is the first to measure and quantify these scaling laws in any experi-mental setup. The precise scaling of these metrics is in agreement with predictions from bifur-cation theory for a saddle-node bifurbifur-cation. We demonstrated that incorporation of slowing down scaling laws offers a refined approach to predict the bifurcation point, i.e., spiking thresh-old in our case, from a limited window of observation. Our findings have implications for neu-roscience and, in general, for the understanding of tipping points in complex systems.
Critical slowing down governed by a saddle-node bifurcation
neuron models [7]. Although critical slowing down is expected to occur upon approaching the bifurcation point, its actual existence in real neurons had not been rigorously demonstrated. Specifically, the quantification of its scaling laws had been a missing link to theory.
The distinction between type 1 and 2 excitability has proven useful to describe the coding properties of neurons [43,44] despite the fact that neuronal properties may change on slow time scales for example due to adaptation or bursting [14], cholinergic modulation [13], or changes in the density and distribution of ion channels [45]. A saddle-node bifurcation related to type 1 excitability has been indirectly derived to control spiking in pyramidal neurons from their graded f-I curves [7,8,10,11], their non-monotonic I-V curves, histograms of ISIs, and infinitesimal phase resetting curves [38,46–48]. The scaling of variance and recovery rate ex-perimentally observed here in pyramidal neurons is well in line with the precise scaling laws predicted by theory for a saddle-node bifurcation.
Fig 6. Prediction of the spiking threshold using scaling relations of critical slowing down.a, The critical voltageVcin pyramidal neurons was determined as a fit parameter by fitting recovery ratesλ(red markers) excluding the last five measurements (blue markers) to voltage byλ=a(Vc−V)
θ .ΔVpis the difference between the fitted critical voltage (red line) and the last value included in the fit (green line);ΔVm, respectively, refers to the difference between the measured voltage at the onset of spiking (blue line) and the last value used in the fit (green line). b, PredictedΔVpand measuredΔVmexhibit a significant correlation when fitted with exponentθ= 0.5 but not when fitted with exponentθ= 1.0 (c). P and R values refer to the linear regression analysis (solid black lines).
In FS neurons, whose dynamics at threshold has been described to exhibit type 2 behavior, we also observed scaling with exponents ±0.5. Consequently, these exponents suggest a sad-dle-node bifurcation instead of a Hopf bifurcation dominating critical slowing down when the spiking threshold is approached from resting membrane potential. Although type 2 excitabil-ity is often brought in context with an underyling subcritical Hopf bifurcation, it has been em-phasized that this mapping is certainly not clear-cut [7]. A saddle-node (off a stable limit cycle) bifurcation, for example, can result in both type 1 or type 2 excitability and could there-fore explain the scaling with exponents ±0.5 observed here. An interesting alternative to a sim-ple saddle-node bifurcation is a folded node which could also underlie the transition to spiking in FS neurons since it generates exponents ±0.5 and can also account for subhreshold oscillations [49] similar to the ones observed here and in [10]. Another possibility in line with exponents ±0.5 would be a singular Hopf, i.e., a mix of fold and Hopf bifurcations whose sub-threshold dynamics, however, is governed by the saddle-node [50]. Finally, we should not ex-clude the possibility that our experimental analysis could provide wrong exponents and that the transition in FS neurons is still governed by a Hopf bifurcation. The fact that the afterhy-perpolarization in these neurons is deeper than the fixed point at the previous current level has previously been discussed as one possible indication for a Hopf bifurcation since a similar bistability can be observed in some reduced neuron models, for example [51]. However, given the robust measurement of exponents ±0.5 here and the compatibility of bifurcations exhibit-ing these exponents with other observations such as subthreshold oscillations as well as the missing definite proof for a Hopf bifurcation in these neurons, it appears more likely that it is rather one of the bifurcations discussed above governing critical slowing down in FS interneu-rons. In particular when one considers the various factors that can modify a neuron’s bifurca-tion structure [13,14,45] what type of bifurcation actually governs the transition to spiking in a neuron under investigation can only be determined experimentally. The robust observation of scaling laws for slowing down as demonstrated here, is therefore likely to provide informa-tive insights into the composition of an underlying bifurcation structure and can be a useful additional tool in studying the excitability in neurons besides other markers such as the I-V curve, histograms of ISIs and infinitesimal phase resetting curves, for example. Apart from neurons, the different exponents characterizing saddle-node and Hopf bifurcation open the possibility to infer the underlying bifurcation based on subthreshold scaling laws in other systems, too.
Possible implications for information processing in neurons and
computational models
The decrease in recovery rate as a result of critical slowing down upon approaching the spiking threshold is likely to have implications on information processing in neurons. It can be ex-pected that changes in the width of EPSPs, analogous to changes in the recovery from small current injections in our protocol, will have an effect on the way by which inputs from other neurons are integrated. The systematic widening of postsynaptic potentials close to spike threshold should progressively facilitate the temporal integration of small inputs to a neuron the closer it gets to the spiking threshold. In this regard, the systematic changes in the form of scaling laws observed in biological neurons can be useful to constrain more realistic computa-tional neuron models. For example, most leaky integrate-and-fire neuron models, by omitting the dynamical modeling of action potential generation, do not take the effects of critical slow-ing down into account, unless specifically incorporatslow-ing changes in inward/outward current balance near threshold [52].
One can argue that it might be beneficial for a neuron to balance its excitability in a way that its membrane potential is close to firing threshold allowing for rapid switching between quiescence and spiking at minimal energetic cost. To maintain such a high-conductance state [53], it is conceivable that individual neurons self-organize their excitability [54] and sub-threshold statistics such as variance or the length and decay of a transient response such as an EPSP, for example, could consequently be utilized to maintain a neuron close to the spiking threshold. The identical scaling of these statistics in both type 1 and type 2 neurons suggested by our analysis could therefore indicate a universal mechanism by which this tuning towards the bifurcation occurs.
Our finding that both pyramidal neurons and fast spiking interneurons are guided by the same scaling law close to spike onset might have important implications for the balance of fast excitation/inhibition (E/I) in neuronal networks. A precise E/I-balance has been shown experi-mentally to be maintained in vivo and in vitro as the network undergoes different levels of exci-tation [55,56]. Modeling work has demonstrated the E/I-balance to establish a decorrelated network state [57–59]. The I-F curves between pyramidal neurons and fast-spiking interneu-rons display rather different firing dynamics in response to current pulses. Our work, however, demonstrates that both neuronal populations exhibit similar subthreshold scaling close to spike onset which suggests a symmetrical dynamical regulation of the E/I-balance, which might simplify its maintenance.
Anticipation of tipping points in complex systems
Beyond single neurons, shifts to different dynamical regimes also occur on a larger spatial scale in neuronal systems. Such transitions of cortical network dynamics can be quite subtle and occur, for example, under physiologic conditions in the course of wake and sleep [60], or are exemplified by the rapid transitions to pathologic seizure states in epilepsy [3,4]. A tipping point at the network level has also recently been described as‘coherence potential’in the ongo-ing avalanche dynamics of awake monkeys and in vitro [61]. It will be interesting to explore whether these network transitions exhibit similar scaling laws to those reported here for indi-vidual cells and whether they could consequently lead to a better understanding and perhaps even prediction of their occurences.
transitions highly desirable [1,19]. Although in the specific case of neuron firing one might think of alternative approaches to anticipate the onset of spiking such as simple thresholding or assuming an integrate and fire model with a certain amount of noise, these methods may likely not be applicable to other real-world systems. Recently, a particularly promising ap-proach to predict these kind of critical transitions in a large variety of complex systems has been based on variables related to critical slowing down as these can often be readily monitored independently of a system’s specificities. So far, a large body of research work has attended to qualitative changes in markers of slowing down to anticipate tipping points [20–24]. Our work constitutes, to our knowledge, the first experimental system in which the quantitative scaling laws governing slowing down have been reported. We suggest that the refined prediction based on scaling laws demonstrated here could also be applicable to other complex systems. While a direct measurement of recovery rates may not always be feasible, indirect measures such as var-iance can also be used to infer the underlying transition mechanism. Once an underlying bifur-cation has been identified, in principle, the precise scaling laws can be used to predict the tipping point as demonstrated in the current study. Although prediction performance is natu-rally impeded by stochastic perturbations which can trigger critical transitions even before the bifurcation point is reached [1,62,63], we demonstrate that given sufficient data and moderate noise levels, reasonable quantitative predictions become possible. In this respect, our results can be regarded as a proof of concept that an estimation of the proximity to the tipping point based on quantitative scaling of critical slowing down is possible and provide a step forward in estimating the fragility in complex systems.
Materials and Methods
Ethics statement
Procedures were in accordance with National Institutes of Health guidelines. Animal procedures were approved by the National Institute of Mental Health Animal Care and Use Committee.
Preparation of acute slices from rat cortex and whole-cell patch
recording
The brains of Sprague Dawley rats (P14-P28) were removed and cut into acute coronal slices of medial prefrontal or somatomotor cortex at 350μmthickness (VT1000S, Leica) in ice-cold arti-ficial cerebral spinal fluid (ACSF; 124mM NaCl, 1.2mM CaCl2, 1mM MgSO4, 3.5mM KCl,
26.2mM NaHCO3, 0.3mM NaH2PO4, and 10mM D−Glucose) bubbled with carbogen (95% O2, 5%CO2). All recordings were performed under perfusion flow rate of 3–4ml/minwhile
continuously monitoring and maintaining temperature at 35 ± 0.5°C. The ACSF’s osmolarity was 290 ± 10mOsm. NMDA- and AMPA-mediated synaptic transmission was blocked with bath-application of 50μM AP5 and 10μM DNQX, respectively, and GABAa-mediated trans-mission with 50μM PTX. Patch pipettes were pulled from borosilicate glass using a P-97 micro-pipette puller (Sutter Instrument, CA, USA), and had a resistance of 4–9MO. The
intracellular patch solution contained 132mM K−Gluconate, 6mM KCl, 8mM NaCl, 10mM HEPES, 2mM Mg−ATP, 0.39mM Na−GTP, pH adjusted to 7.2–7.4 with KOH. Putative
Instruments), pre-amplified and low-pass filtered at 10 kHz (Cyberamp 380, Axon Instru-ments), and digitized at 25 kHz for voltage and 2.5 kHz for current traces using a CED 1401 (Cambridge Electronic Design). We applied a step current that increased by 3 pA every 4.01 s to slowly drive neurons towards the tipping point at which they would start spiking. On top of this slowly increasing current we induced small perturbations to the membrane potential by in-jecting current pulses of 50 pA for 5 ms at 1800 ms time and 3805 ms on each step (Fig. 1 a). The recovery after small perturbations allowed to measure recovery rates, the unperturbed seg-ments before current pulses to estimate variance and autocorrelation from subthreshold volt-age. Data were collected continuously with Spike2 (CED) and analyzed off-line.
Data analysis
The recovery rate after each perturbation by 5 ms current injection of 50 pA was determined by fitting the 4800 sample (corresponding to 192 ms at 25000 Hz sampling rate) long segment of subthreshold voltage following the pulse current injection. Prior to fitting, the mean voltage of the segment was subtracted. The recovery of the voltageV(t) after each perturbation was fit by an exponential decay
VðtÞ ¼a∙e ltþb ð13Þ
a;b;l2Rusing the PYTHON(Python Software Foundation, version 2.6) functionSCIPY. OPTI-MIZE.CURVE FIT. For each perturbation, the recovery rateλwas then recorded together with the
mean voltage over the 1 second interval prior the perturbation and the mean injected currentI during the 1 second interval prior the perturbation for further analysis. The distance to the bi-furcation point,ΔI, is then given byΔI=Ic−IwhereIcis defined as the average current injected
during the one—second interval before thefirst spike. Note, thatΔIis directly related toyin our model systems.
Variance was calculated from subthreshold voltage segments prior to each current pulse. For the results in the main part of the manuscript, segments of one—second duration were taken. Similarly, autocorrelation was calculated from subthreshold voltage segments of one— second duration prior to each current pulse. After subtraction of the mean we derived the auto-correlation functionACF(s) of a signalFi(t) with lengthN, meanμand variancevby
ACFðsÞ ¼ PN s
t¼1ðFiðtÞ mÞðFiðtþsÞ mÞ
v ; s¼1;. . .;N=2 ð14Þ
and normalization by thefirst valueACFðsÞ ¼ ACFðsÞ
ACFð1Þ. For the analysis in the experimental part
of the manuscript, we used the value of the autocorrelation function at lag 50 ms.
We determined the power-law exponents governing the scaling for recovery rate, variance and autocorrelation by a linear fit in log-space. Specifically, logarithmic values of recovery rates
λ, variancevand lag-50ms autocorrelation (ACF
50ms) were fit individually for each trial as a
function of the corresponding logarithmic values ofΔIby
logx¼A∙logDIþB ð15Þ
using the PYTHONfunctionSCIPY.OPTIMIZE.CURVE FIT. Here,xare the values of recovery rate,
vari-ance and autocorrelation, respectively, andAcorresponds to the related exponent (i.e.θ,τor
κ) obtained in thefit. For the determination of exponents, we requiredfits to haveR20.1. To
determine a robust estimate of the exponent thefit values were calculated for different minimal valuesΔImin, i.e.ΔIvalues smaller thanΔIminwere discarded in thefit. The exponents given in
Author Contributions
Conceived and designed the experiments: CM. Performed the experiments: CM AK. Analyzed the data: CM CK. Contributed reagents/materials/analysis tools: CM DP. Wrote the paper: CM AK CK DP.
References
1. Scheffer M, Bascompte J, Brock WA, Brovkin V, Carpenter SR, et al. (2009) Early-warning signals for critical transitions. Nature 461: 5359. doi:10.1038/nature08227
2. Scheffer M, Carpenter SR, Lenton TM, Bascompte J, Brock W, et al. (2012) Anticipating critical transi-tions. Science 338: 344–348. doi:10.1126/science.1225244PMID:23087241
3. Kramer MA, Truccolo W, Eden UT, Lepage KQ, Hochberg LR, et al. (2012) Human seizures self-terminate across spatial scales via a critical transition. Proc Natl Acad Sci USA 109: 21116–21121. doi:10.1073/pnas.1210047110PMID:23213262
4. Meisel C, Kuehn C (2012) Scaling effects and spatio-temporal multilevel dynamics in epileptic seizures. PLoS ONE 7: e30371. doi:10.1371/journal.pone.0030371PMID:22363431
5. Schöner G, Kelso JAS (1988) Dynamic pattern generation in behavioral and neural systems. Science 239: 1513–1520. doi:10.1126/science.3281253PMID:3281253
6. Rinzel J (1986) A formal classification of bursting mechanisms in excitable systems. Proc Int Congress Math, Berkeley: 1578–1593.
7. Izhikevich E (2000) Neural excitability, spiking, and bursting. Int J Bif Chaos 10: 1171–1266. doi:10. 1142/S0218127400000840
8. Prescott SA, De Koninck Y, Sejnowski TJ (2008) Biophysical basis for three distinct dynamical mecha-nisms of action potential initiation. PLoS Comput Biol 4: e1000198. doi:10.1371/journal.pcbi.1000198 PMID:18846205
9. Ermentrout G, Terman D (2010) Mathematical Foundations of Neuroscience. Springer.
10. Tateno T, Harsch A, Robinson HP (2004) Threshold firing frequency-current relationships of neurons in rat somatosensory cortex: type 1 and type 2 dynamics. J Neurophysiol 92: 2283–2294. doi:10.1152/ jn.00109.2004PMID:15381746
11. Hodgkin A, Huxley A (1952) A quantitative description of membrane current and its application to con-duction and excitation in nerve. J Physiol 117: 500–544. doi:10.1113/jphysiol.1952.sp004764PMID: 12991237
12. Prescott SA, Ratte S, De Koninck Y, Sejnowski TJ (2006) Nonlinear interaction between shunting and adaptation controls a switch between integration and coincidence detection in pyramidal neurons. J Neurosci 26: 9084–9097. doi:10.1523/JNEUROSCI.1388-06.2006PMID:16957065
13. Stiefel KM, Gutkin BS, Sejnowski TJ (2008) Cholinergic neuromodulation changes phase response curve shape and type in cortical pyramidal neurons. PLoS ONE 3: e3947. doi:10.1371/journal.pone. 0003947PMID:19079601
14. Prescott SA, Ratte S, De Koninck Y, Sejnowski TJ (2008) Pyramidal neurons switch from integrators in vitro to resonators under in vivo-like conditions. J Neurophysiol 100: 3030–3042. doi:10.1152/jn. 90634.2008PMID:18829848
15. Wissel C (1984) A universal law of the characteristic return time near thresholds. Oecologia 65: 101–
107. doi:10.1007/BF00384470
16. Ives AR (1995) Measuring resilience in stochastic systems. Ecol Monogr 65: 217233.
17. Carpenter SR, Brock WA (2006) Rising variance: a leading indicator of ecological transition. Ecol Lett 9: 311318. doi:10.1111/j.1461-0248.2005.00877.x
18. Steyn-Ross DA, Steyn-Ross ML, Wilson MT, Sleigh JW (2006) White-noise susceptibility and critical slowing in neurons near spiking threshold. Phys Rev E 74: 051920. doi:10.1103/PhysRevE.74. 051920
19. Lade SJ, Gross T (2012) Early warning signals for critical transitions: a generalized modeling approach. PLoS Comput Biol 8: e1002360. doi:10.1371/journal.pcbi.1002360PMID:22319432
20. Drake J, Griffen B (2010) Early warning signals of extinction in deteriorating environments. Nature 467: 456–459. doi:10.1038/nature09389PMID:20827269
22. Dai L, Vorselen D, Korolev KS, Gore J (2012) Generic indicators for loss of resilience before a tipping point leading to population collapse. Science 336: 1175–1177. doi:10.1126/science.1219805PMID: 22654061
23. Veraart AJ, Faassen EJ, Dakos V, van Nes EH, Lürling M, et al. (2012) Recovery rates reflect distance to a tipping point in a living system. Nature 481: 357–360.
24. Wang R, Dearing J, Langdon P, Zhang E, Yang X, et al. (2012) Flickering gives early warning signals of a critical transition to a eutrophic lake state. Nature 492: 419–422. doi:10.1038/nature11655PMID: 23160492
25. Hindmarsh J, Rose R (1984) A model of neuronal bursting using three coupled first order differential equations. Proc Roy Soc London B 221: 87–102. doi:10.1098/rspb.1984.0024
26. Gerstner W, Kistler W (2002) Spiking Neuron Models: Single Neurons, Populations, Plasticity. Cam-bridge: Cambridge University Press.
27. Fricker D, Miles R (2000) EPSP amplification and the precision of spike timing in hippocampal neurons. Neuron 28: 559–569. doi:10.1016/S0896-6273(00)00133-1PMID:11144364
28. Ratte S, Hong S, De Schutter E, Prescott SA (2013) Impact of neuronal properties on network coding: roles of spike initiation dynamics and robust synchrony transfer. Neuron 78: 758–772. doi:10.1016/j. neuron.2013.05.030PMID:23764282
29. Jacobson GA, Diba K, Yaron-Jakoubovitch A, Oz Y, Koch C, et al. (2005) Subthreshold voltage noise of rat neocortical pyramidal neurones. J Physiol 564: 145160. doi:10.1113/jphysiol.2004.080903
30. Rinzel J, Ermentrout B (1989) Analysis of neural excitability and oscillations. In: Koch C, Segev I, edi-tors, Methods in Neuronal Modeling:From Ions to Networks, Cambridge, Mass.: MIT Press. p. 251.
31. Kuznetsov Y (2004) Elements of Applied Bifurcation Theory. New York, NY: Springer, 3rd edition.
32. Wiggins S (2003) Introduction to Applied Nonlinear Dynamical Systems and Chaos. New York, NY: Springer, 2nd edition.
33. Kuehn C (2011) A mathematical framework for critical transitions: bifurcations, fast-slow systems and stochastic dynamics. Physica D 240: 1020–1035. doi:10.1016/j.physd.2011.02.012
34. Guckenheimer J, Holmes P (1983) Nonlinear Oscillations, Dynamical Systems, and Bifurcations of Vector Fields. New York, NY: Springer.
35. Alligood K, Sauer T, Yorke J (1996) Chaos: An Introduction to Dynamical Systems. Springer.
36. Kuehn C (2013) A mathematical framework for critical transitions: normal forms, variance and applica-tions. J Nonlinear Sci 23: 457–510. doi:10.1007/s00332-012-9158-x
37. Berglund N, Gentz B (2006) Noise-Induced Phenomena in Slow-Fast Dynamical Systems. Springer.
38. Rinzel J, Ermentrout B (1998) in Methods in Neuronal Modeling: From Ions to Networks, eds. Koch C. and Segev I., Cambridge: MIT Press, chapter Analysis of Neuronal Excitability and Oscillations.
39. Booth V, Rinzel J, Kiehn O (1997) Compartmental model of vertebrate motoneurons for Ca2+-depen-dent spiking and plateau potentials under pharmacological treatment. J Neurophysiol 78: 3371–3385. PMID:9405551
40. Baroni F, Burkitt AN, Grayden DB (2014) Interplay of intrinsic and synaptic conductances in the genera-tion of high-frequency oscillagenera-tions in interneuronal networks with irregular spiking. PLoS Comput Biol 10: e1003574. doi:10.1371/journal.pcbi.1003574PMID:24784237
41. Chialvo DR, Jalife J (1987) Non-linear dynamics of cardiac excitation and impulse propagation. Nature 330: 749–752. doi:10.1038/330749a0PMID:3696239
42. Gal A, Eytan D, Wallach A, Sandler M, Schiller J, et al. (2010) Dynamics of excitability over extended timescales in cultured cortical neurons. J Neurosci 30: 16332–16342. doi:10.1523/JNEUROSCI. 4859-10.2010PMID:21123579
43. Gutkin B, Ermentrout GB, Rudolph M (2003) Spike generating dynamics and the conditions for spike-time precision in cortical neurons. J Comput Neurosci 15: 91–103. doi:10.1023/A:1024426903582 PMID:12843697
44. St-Hilaire M, Longtin A (2004) Comparison of coding capabilities of Type I and Type II neurons. J Com-put Neurosci 16: 299–313. doi:10.1023/B:JCNS.0000025690.02886.93PMID:15114051
45. Arhem P, Klement G, Blomberg C (2006) Channel density regulation of firing patterns in a cortical neu-ron model. Biophys J 90: 4392–4404. doi:10.1529/biophysj.105.077032PMID:16565052
46. Ermentrout B (1996) Type I membranes, phase resetting curves, and synchrony. Neural Comput 8: 979–1001. doi:10.1162/neco.1996.8.5.979PMID:8697231
48. Wang S, Musharoff MM, Canavier CC, Gasparini S (2013) Hippocampal CA1 pyramidal neurons exhibit type 1 phase-response curves and type 1 excitability. J Neurophysiol 109: 2757–2766. doi:10.1152/jn. 00721.2012PMID:23468392
49. Wechselberger M (2005) Existence and Bifurcation of Canards in R3 in the Case of a Folded Node. SIAM Journal on Applied Dynamical Systems 4: 101–139. doi:10.1137/030601995
50. Desroches M, Guckenheimer J, Krauskopf B, Kuehn C, Osinga HM, et al. (2012) Mixed-mode oscilla-tions with multiple time scales. SIAM Review 54: 211–288. doi:10.1137/100791233
51. Canavier CC, Baxter A, Byrne J (2005) Repetitive Action Potential Firing. ENCYCLOPEDIA OF LIFE SCIENCES: 1–1.
52. Burkitt A (2006) A review of the integrate-and-fire neuron model: I. homogeneous synaptic input. Bio-logical Cybernetics 95: 1–19. doi:10.1007/s00422-006-0068-6PMID:16622699
53. Destexhe A, Rudolph M, Pare D (2003) The high-conductance state of neocortical neurons in vivo. Nat Rev Neurosci 4: 739–751. doi:10.1038/nrn1198PMID:12951566
54. Gal A, Marom S (2013) Self-organized criticality in single-neuron excitability. Phys Rev E Stat Nonlin Soft Matter Phys 88: 062717. doi:10.1103/PhysRevE.88.062717PMID:24483496
55. Okun M, Lampl I (2008) Instantaneous correlation of excitation and inhibition during ongoing and sen-sory-evoked activities. Nat Neurosci 11: 535–537. doi:10.1038/nn.2105PMID:18376400
56. Shu Y, Hasenstaub A, McCormick DA (2003) Turning on and off recurrent balanced cortical activity. Nature 423: 288–293. doi:10.1038/nature01616PMID:12748642
57. Brunel N (2000) Dynamics of networks of randomly connected excitatory and inhibitory spiking neu-rons. J Physiol Paris 94: 445–463. doi:10.1016/S0928-4257(00)01084-6PMID:11165912
58. London M, Roth A, Beeren L, Hausser M, Latham PE (2010) Sensitivity to perturbations in vivo implies high noise and suggests rate coding in cortex. Nature 466: 123–127. doi:10.1038/nature09086PMID: 20596024
59. Ostojic S (2014) Two types of asynchronous activity in networks of excitatory and inhibitory spiking neu-rons. Nat Neurosci 17: 594–600. doi:10.1038/nn.3658PMID:24561997
60. Meisel C, Olbrich E, Shriki O, Achermann P (2013) Fading signatures of critical brain dynamics during sustained wakefulness in humans. J Neurosci 33: 17363–17372. doi:10.1523/JNEUROSCI.1516-13. 2013PMID:24174669
61. Thiagarajan TC, Lebedev MA, Nicolelis MA, Plenz D (2010) Coherence potentials: loss-less, allor-none network events in the cortex. PLoS Biol 8: e1000278. doi:10.1371/journal.pbio.1000278PMID: 20084093
62. Lindner B, García-Ojalvo J, Neiman A, Schimansky-Geier L (2004) Effects of noise in excitable sys-tems. Phys Rep 392: 321–424. doi:10.1016/j.physrep.2003.10.015