Control: The Major Epidemic on Re´union Island
Laith Yakob*, Archie C. A. Clements
School of Population Health, University of Queensland, Brisbane, Queensland, Australia
Abstract
Chikungunya is a re-emerging arboviral disease transmitted byAedesspp. mosquitoes. Although principally endemic to Africa and Asia, recent outbreaks have occurred in Europe following introductions by returning travellers. A particularly large outbreak occurred on Re´union Island in 2006, the published data from which forms the basis of the current study. A simple, deterministic mathematical model of the transmission of the virus between humans and mosquitoes was constructed and parameterised with the up-to-date literature on infection biology. The model is fitted to the large Re´union epidemic, resulting in an estimate of 4.1 for the type reproduction number of chikungunya. Although simplistic, the model provided a close approximation of both the peak incidence of the outbreak and the final epidemic size. Sensitivity analysis using Monte Carlo simulation demonstrated the strong influence that both the latent period of infection in humans and the pre-patent period have on these two epidemiological outcomes. We show why separating these variables, which are epidemiologically distinct in chikungunya infections, is not only necessary for accurate model fitting but also important in informing control.
Citation:Yakob L, Clements ACA (2013) A Mathematical Model of Chikungunya Dynamics and Control: The Major Epidemic on Re´union Island. PLoS ONE 8(3): e57448. doi:10.1371/journal.pone.0057448
Editor:Michael George Roberts, Massey University, New Zealand
ReceivedSeptember 24, 2012;AcceptedJanuary 23, 2013;PublishedMarch 6, 2013
Copyright:ß2013 Yakob, Clements. This is an open-access article distributed under the terms of the Creative Commons Attribution License, which permits unrestricted use, distribution, and reproduction in any medium, provided the original author and source are credited.
Funding:The authors have no support or funding to report.
Competing Interests:The authors have declared that no competing interests exist. * E-mail: [email protected]
Introduction
Chikungunya is an alphavirus that infects humans through bites fromAedesspp. mosquitoes. Symptoms are similar to those of dengue fever during the acute phase and include rash and high fever that, in a small proportion of cases, can develop into a life-threatening haemorrhagic fever [1]. Additionally, joint pain that is frequently associated with infection can persist for over a year [2], and is responsible for its name which means ‘‘that which bends’’ in the Makonde language of Southern Tanzania and Northern Mozambique. In 2004, a major epidemic in Lamu, Kenya resulted in 13,500 cases [3]. This epidemic sparked a four-year period in which the virus spread through numerous islands of the Indian Ocean, India and parts of Southeast Asia [4]. Cases were imported to Europe and North America through returning travellers, and subsequent autoch-thonous transmission events occurred due to the wide geograph-ical distribution of the vectors [4].
The French island of Re´union in the Indian Ocean experienced a major outbreak where, during 2005–6, approximately 266,000 of the 785,000 inhabitants were infected, causing or contributing to over 200 deaths [5,6]. Following the international WHO alert in March 2005, an island-wide operational surveillance system for chikungunya infections was set up to characterise cases and to monitor trends. However, by December 2005, the numbers of cases exceeded the capacity of the surveillance system and incidence was extrapolated from a sentinel network of physicians, and later confirmed through a combination of hospital activity data, self-reporting by the population and seroprevalence data [5].
Data from Renault et al. (2007) forms the basis of the current epidemiological study.
We constructed an ordinary differential equation model to simulate the transmission of infection between humans andAedes albopictus – the principle vector on Re´union during the major epidemic [6]. The ranges for the biological components of the model were provided by a review of the literature. The model was then used to calculate the basic reproduction number (and type reproduction number) of chikungunya by fitting it to the Re´union data. Monte Carlo analysis was performed to determine the sensitivity of infection dynamics to the parameters. Accurate estimates of the type reproduction number [7] and model sensitivity to its biological components is critical to informing control and, following the results, we discuss how our study contributes to the limited intervention strategies available for this disease.
Methods
Figure 1 describes the compartmental design of the model. The proportion of susceptible people (S) is exposed to the pathogen (E) when bitten by an infectious mosquito. Following the latent period of infection, people become either symptomatically Infectious (I) or asymptomatically Infectious (Ia) before recovering (R). Similarly,
dS
dt~{b1SZ dE
dt~b1SZ{l1E dI
dt~wl1E{cI dIa
dt~(1{w)l1E{cIa dR
dt ~c(IzIa)
dX
dt ~m{b2X(IzIa){mX dY
dt ~b2X(IzIa){l2Y{mY dZ
dt ~l2Y{mZ
b1 is the rate at which mosquitoes infect humans (Table 1
describes model parameters and variables). In this way,b1is the
equivalent toabmin Macdonald’s model (whereais the bite rate,
bis the parasite transmissibility to humans andmis the ratio of mosquitoes to humans) [8]. Following convention of this model and its modern-day adaptations [9], the rate at which mosquitoes infect humans is dependent on the ratio of mosquitoes to humans but the rate at which humans infect mosquitoes, b2, is
independent of this ratio. w is the proportion of infected people who develop symptoms, in the range 0.83–0.97 [2,5,10].l1is the
inverse of the latent period of infection, which is estimated to be
between 2 and 6 days [10].c is the rate of recovery, which is assumed to take between 1 and 7 days [11]. For chikungunya, the latent period is distinct from the pre-patent period, v21,
which typically lasts between 4 and 7 days [12]. The latent period is the number of days before an individual becomes infectious and the pre-patent period is the number of days before a patient exhibits symptoms. Importantly, because case notifica-tion was based on the reporting of symptoms, it is the symptomaticallyinfected, and not necessarily just the symptomat-icallyinfectious, that is relevant to the fitted data.
SIR-type models describe infection prevalence (not incidence). In order to compare weekly incidence data with our model output, new infections were tracked each day. The symptomatic propor-tion (w) of these new infecpropor-tions from v21 days ago thereby
represents the current day’s incidence of symptomatic infection. This daily symptomatic incidence was summed every 7 days and then compared with (and fitted to) the weekly incidence data collected by Renault et al. (2007).
Parameters describing mosquito biology and infection include l2, the latent period of infection in mosquitoes, which is between 2
and 6 days forA. albopictus[13] and,m, the mortality rate of the mosquitoes which is inverse of the average life expectancy of 20– 30 days [14]. Mosquito births are set to balance deaths. Hence, a stable mosquito population is assumed for this tropical island which experiences temperature and rainfall conditions suitable for year-roundA. albopictusbreeding [15]. If new empirical evidence demonstrated marked seasonal variation in mosquito populations, our simple framework could easily be adapted to include a sinusoidal seasonal forcing function in mosquito dynamics, as with the study of Bacae¨r [16].
Next generation matrix methods were used to calculate the basic reproduction number,R0[17]. The transmission matrix,T, denotes the pathogen passing between all stages of the infection subsystem:
Figure 1. Compartmental construction of the epidemiological model for Chikungunya transmission. Susceptible humans (S) are exposed to infection (E) before becoming infectious (Iaasymptomatically, or I symptomatically) and then recover (R). Susceptible mosquitoes (X) are
exposed to infection (Y) before becoming infectious (Z). Transmission from mosquito-to-human and vice versa is denoted by the broken lines indicating a mosquito bite. Rates of change between compartments are denoted by corresponding Greek letters.
T~
0 0 0 b1
0 0 0 0
0 b2 0 0
0 0 0 0
2
6 6 6 4
3
7 7 7 5
The transition matrix,S, denotes all other transitions to and from the infection subsystem:
S~
{l1 0 0 0
l1 {c 0 0
0 0 {(mzl2) 0
0 0 l2 {m
2
6 6 6 4
3
7 7 7 5
The model was fitted to the incidence data using the least squares method whereby parameters were allowed to vary within the range described by the clinical and entomological literature. Where no values were obtainable from the literature, i.e. for the transmission coefficients, b1 and b2, triangular probability
distributions were generated whereby the modal value was the best-fit parameterisation generated through least squares, the minimum value was set to 50% of the least-squares estimate and the maximum value was set to 150% of the least-squares estimate. 10,000 runs of a Monte Carlo simulation were performed using these best-fit values and distributions, and the means (and standard deviations) for the incidence during the epidemic’s peak and final epidemic size were calculated. Sensitivities of these two model outputs to all model inputs were then estimated by allowing each parameter to vary by610% for 10,000 runs of a Monte Carlo simulation and calculating the Spearman’s rank correlation coefficients [18]. Knowledge of model sensitivity was then used to inform a suite of disease control scenarios.
Results
R0is the spectral radius of –TS21:
R0~
ffiffiffiffiffiffiffiffiffiffiffiffiffiffiffiffiffiffiffiffi
b1b2l2 cm(mzl2)
s
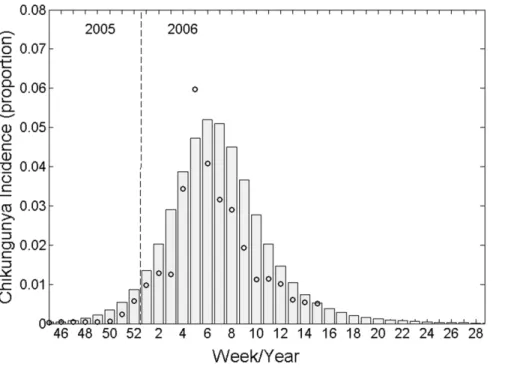
However, we are interested in the total number of secondary infections in humans originating from a human infection, not the average number of infections from human-to-mosquito and mosquito-to-human [7,19]. In the terminology of Roberts and Heesterbeek (2003), this is the ‘type reproduction number’ and, in this case, is simply calculated as the R0 squared (RT=R02). Obviously, both metrics have identical epidemic thresholds of 1. Weekly incidence from our best-fit model is plotted against the original data collected from Re´union Island in 2005–6 in Figure 2. We calculated the resultingRTvalue for the epidemic to be 4.1.
Allowing the best-fit parameterisation to inform the modal b1
andb2values of triangular probability distributions, we ran 10,000
Monte Carlo simulations and calculated the mean peak incidence to be 5.3% of the population of Re´union (standard deviation 1.8%), representing a close estimate of the,6% described in the data. The total infected population simulated by our model was 42.0% (standard deviation 9.0%) which compares well with the 35–38% estimated following the outbreak [5,6]. These modal and best-fit values are as follows: b1= 0.14, b2= 0.40, c= 0.25,
l1= 0.50, l2= 0.50, w= 0.97, v= 0.25, m= 0.05. Allowing all
parameters to vary by610% for 10,000 Monte Carlo simulation runs, sensitivity of both model outputs (peak incidence and final epidemic size) to model input parameters is described by Spearman’s rank correlation coefficients and plotted in Figure 3.
Intuitively, peak incidence is most sensitive (and positively correlated) to the parameters determining the force of infection (b1
andb2). This output was also sensitive to (and positively correlated
with) the rate of symptoms onset (v) and negatively correlated with the rate at which a human becomes infectious (l1) and the rate at
Table 1.The parameters and variables (with units) of the Chikungunya model.
Symbol Definition (units)
S Susceptible hosts (proportion)
E Exposed hosts (proportion)
I Symptomatically infectious hosts (proportion)
Ia Asymptomatically infectious hosts (proportion)
R Recovered hosts (proportion)
X Susceptible mosquitoes (proportion)
Y Exposed mosquitoes (proportion)
Z Infectious mosquitoes (proportion)
b1 Mosquito-to-human transmission (number of mosquito bites per human per day allowing for imperfect pathogen transmission)
b2 Human-to-mosquito transmission (per day bite rate also allowing for imperfect pathogen transmission)
w Hosts that develop symptoms (proportion)
1/l1 Host latent period (from ‘infected’ to ‘infectious’, days)
1/l2 Mosquito latent period (from ‘infected’ to ‘infectious’, days)
c Host recovery rate (per day)
1/v Host pre-patent period (from ‘infected’ to symptoms development, days)
1/m Mosquito life span (days)
which humans recover from infection (c). For the final epidemic size, parameters of greatest influence included the rate of symptoms onset (v), the rate at which a human becomes infectious (l1) and the proportion of infections that are symptomatic (w). All
other parameters were substantially less influential (Figure 3). Traditionally, adulticidal insecticides are employed to prevent, or curtail, vector-borne disease transmission. Following the
chikungunya epidemic on Re´union, an island-wide mass-spraying effort was initiated [5]. Adulticides are modelled by increasing the mosquito mortality rate [9,20–22]. The critical mortality rate (m*) that must be achieved to prevent transmission is calculated as:
m~0 :5
ffiffiffiffiffiffiffiffiffiffiffiffiffiffiffiffiffiffiffiffiffiffiffiffiffiffiffiffiffiffiffiffiffi
l22z 4b1b2l2 c
s
{l2
!
The lack of available treatment or vaccines for chikungunya limits the opportunities for reducing the transmission intensity. However, one potential control tool that has not been assessed for chikungunya (empirically or theoretically) is quarantining the infectious individuals. Sensitivity analysis demonstrated the influence that both the human latent and pre-patent periods have on transmission. For chikungunya, and any other disease whereby hosts are infectious before symptoms develop, there are different functional types of quarantine. ‘Type 1’ quarantine assumes knowledge of infection status without symptoms onset. This would be the case if an accurate, cheap and rapid screen became available to at-risk populations, or if people were isolated following self-reported mosquito bites. (This latter scenario represents quite an extreme level of cautiousness.) Type 1 quarantine threshold for eliminating transmission is calculated as:
Q1~1{
1
RT
‘Type 2’ quarantine makes (the more realistic) assumption that isolation only occurs once symptoms have already developed. Type 2 quarantine threshold accounts for the additional delay between infectiousness and symptoms onset, and is calculated as: Figure 2. Mathematical model output (bars) fitted to weekly Chikungunya incidence data (circles) collected during the 2005–6 epidemic on Re´union island, Indian Ocean.
doi:10.1371/journal.pone.0057448.g002
Figure 3. Spearman’s rank correlation coefficients demonstrat-ing model output sensitivity to input parameters. 10,000 iterations of a Monte Carlo simulation were performed allowing each input parameter to vary by610% around its modal value.
Q2~ 1{
1
RT
exp c 1 v{
1
l1
These threshold conditions for eliminating transmission are shown in isolation and in combination in Figure 4. The figure demonstrates the superiority of vector control when compared with quarantining. It also shows that the additional delay in isolating symptomatic, rather than bitten or screened, individuals (Q2 vsQ1) can make the difference between an epidemic that is preventable and an epidemic that cannot be prevented through quarantining. Finally, it describes the reduced effort required of vector control in curtailing an epidemic as a function of the two different quarantine strategies.
Discussion
Surprisingly, there have been relatively few mathematical models published on chikungunya transmission dynamics, and, to the best of our knowledge, the present study is the first to explore the sensitivity of chikungunya transmission to model input parameters. Bacae¨r [16] produced the first ordinary differential equation model and calculated theRTto be 3.4 after fitting it to the Re´union outbreak data. Dumont and Chiroleu [23] estimate
RT between 1.46 and 1.78 for the same epidemic. However, in both analyses, the authors did not account for the fact that there is a time delay between becoming infectious (their model output) and the onset of clinical symptoms (the data). It also appears as though infection prevalence output from both models were fitted to the infection symptomincidencedata. Massad et al. [24] parameterised their model based on the risk of an outbreak in Singapore and
calculated anRTof 1.22. This very low estimate appears to be the result of an assumed short lifespan of the vector (10 days) combined with a very high extrinsic incubation period of 15 days [24]. More recently, Poletti et al. [25] described a vector-centric model of chikungunya, with parameterisation based on data from the 2007 Italian outbreak. Our calculation for RT falls in the middle of their estimated range of between 1.8 and 6. Using the Bayesian framework for analysing outbreak data developed by Cauchemez et al. (2006), Boelle et al. (2008) derived a value of 3.7 for the RT [26,27]. Dengue, a highly related alphavirus also transmitted by Aedes spp. that has had considerably greater research effort than chikungunya, has comparableRTestimates of 4.3–5.8 [28], 2.7–11.6 [29] and 3.8–5.1 [30]. Note than in each of these previously published studies, the threshold is described as the basic reproduction number, but it is the type reproduction number that is actually presented. As described earlier, squaring the spectral radius of the next generation matrix does not affect the threshold (R0= 1 ; RT= 1). However, making the distinction
becomes important when assessing control because R0will always
underestimate the level of control required for elimination of a vector-borne disease.
Our analysis has taken advantage of the recent surge in chikungunya research resulting from the spate of epidemics following the initial Kenyan outbreak of 2004. Improved modelling parameterisation has been facilitated by rekindled interest in this re-emerging pathogen. Although simple, our model incorporates a biological component of chikungunya infection that appears to have been neglected until now - previous models have not distinguished between infectiousness and the development of symptoms, an important distinction in chikungunya infection [31,32]. Sensitivity analysis shows the criticality of the rate of symptoms onset, thereby supporting its inclusion in future modelling efforts. Our results demonstrate the necessity of distinguishing the rate of symptoms onset (inverse of the pre-patent period) from the rate at which an individual becomes infectious (inverse of the latent period of infection), both of which are independently influential parameters in our model (Figure 3). Generating reliable estimates for the basic (and type) reproduc-tion number and providing a thorough sensitivity analysis of model inputs is particularly important during the initial stages of infectious disease epidemiological research. Both sets of metric are critical to informing control. TheRTvalue is fundamental to assessing the risk of epidemics and discriminates between epidemiological settings with high and low rates of transmission. It also provides a definitive goal for interventions: the reduction of
RTbelow the epidemic threshold. Control can then be strategized according to the sensitivity of epidemiological outcomes to model inputs. Typically, control consists of vector control. However, there are logistical difficulties with eliminating the widespread and abundant Aedes spp. vectors [25,33], and, in the absence of effective treatment [4] there is a desperate need for more strategic tools in controlling chikungunya. Our analysis demonstrates a strong influence of the rate at which hosts become infectious (inverse of the latent period) to both the peak incidence and total infected population. Therefore, we propose that pre-emptive isolation of recently bitten individuals i.e., suspected infections, can be expected to attenuate the course of an epidemic. In situations such as the Re´union outbreak, where over a quarter of a million individuals were infected, quarantining might become logistically impossible. In which case, region-wide efforts to reduce transmis-sion from infected individuals to mosquitoes (such as with the use of mosquito repellents) should be employed. Our study demon-strates the substantial improvement to control that can result from Figure 4. Controlling a chikungunya epidemic.Top, the reduction
in the type reproduction number (RT) as a function of vector control
(increased mosquito mortality rate). Middle, the reduction in the type reproduction number as a function of quarantine (solid line,Q1–
pre-emptive isolation through screening or self-reporting mosquito bites, and, broken line,Q2– isolation following symptoms onset). Bottom, the
combinations of vector control with quarantining (solid line Q1 and
broken lineQ2) required to reduce theRTbelow unity.
pre-emptive action, and our methods should be adaptable to other diseases whereby infectiousness precedes the onset of symptoms.
Acknowledgments
The authors thank the anonymous referees for their very useful comments.
Author Contributions
Conceived and designed the experiments: LY. Performed the experiments: LY AC. Analyzed the data: LY. Contributed reagents/materials/analysis tools: LY. Wrote the paper: LY AC.
References
1. Robillard PY, Boumahni B, Gerardin P, Michault A, Fourmaintraux A, et al. (2006) Vertical maternal fetal transmission of the chikungunya virus. Ten cases among 84 pregnant women. Presse Medicale 35: 785–788.
2. Queyriaux B, Simon F, Grandadam M, Michel R, Tolou H, et al. (2008) Clinical burden of chikungunya virus infection. Lancet Infectious Diseases 8: 2– 3.
3. Sergon K, Njuguna C, Kalani R, Ofula V, Onyango C, et al. (2008) Seroprevalence of Chikungunya Virus (CHIKV) Infection on Lamu Island, Kenya, October 2004. The American Journal of Tropical Medicine and Hygiene 78: 333–337.
4. Staples JE, Breiman RF, Powers AM (2009) Chikungunya Fever: An Epidemiological Review of a Re-Emerging Infectious Disease. Clinical Infectious Diseases 49: 942–948.
5. Renault P, Solet JL, Sissoko D, Balleydier E, Larrieu S, et al. (2007) A Major Epidemic of Chikungunya Virus Infection on Re´union Island, France, 2005– 2006. The American Journal of Tropical Medicine and Hygiene 77: 727–731. 6. Gerardin P, Guernier V, Perrau J, Fianu A, Le Roux K, et al. (2008) Estimating Chikungunya prevalence in La Reunion Island outbreak by serosurveys: Two methods for two critical times of the epidemic. BMC Infectious Diseases 8: 99. 7. Roberts MG, Heesterbeek JAP (2003) A new method for estimating the effort required to control an infectious disease. Proceedings of the Royal Society of London Series B: Biological Sciences 270: 1359–1364.
8. Macdonald G (1957) The epidemiology and control of malaria. Oxford: Oxford University Press.
9. Smith DL, Battle KE, Hay SI, Barker CM, Scott TW, et al. (2012) Ross, Macdonald, and a Theory for the Dynamics and Control of Mosquito-Transmitted Pathogens. PLoS Pathog 8: e1002588.
10. Thiboutot MM, Kannan S, Kawalekar OU, Shedlock DJ, Khan AS, et al. (2010) Chikungunya: A Potentially Emerging Epidemic? PLoS Negl Trop Dis 4: e623.
11. Chabra M, Mittal V, Bhattacharya D, Rana UVS, Lal S (2008) Chikungunya fever: a re-emerging viral infection. Indian Journal of Medical Microbiology 26: 5–12.
12. Ziegler SA, Lu L, da Rosa APAT, Xiao SY, Tesh RB (2008) An Animal Model for Studying the Pathogenesis of Chikungunya Virus Infection. The American Journal of Tropical Medicine and Hygiene 79: 133–139.
13. Dubrulle M, Mousson L, Moutailler S, Vazeille M, Failloux AB (2009) Chikungunya Virus andAedesMosquitoes: Saliva Is Infectious as soon as Two Days after Oral Infection. PLoS ONE 4: e5895.
14. Delatte H, Gimonneau G, Triboire A, Fontenille D (2009) Influence of Temperature on Immature Development, Survival, Longevity, Fecundity, and Gonotrophic Cycles of Aedes albopictus, Vector of Chikungunya and Dengue in the Indian Ocean. Journal of Medical Entomology 46: 33–41.
15. Delatte H, Dehecq JS, Thiria J, Domerg C, Paupy C, et al. (2008) Geographic Distribution and Developmental Sites of Aedes albopictus (Diptera: Culicidae) During a Chikungunya Epidemic Event. Vector-Borne and Zoonotic Diseases 8: 25–34.
16. Bacae¨r N (2007) Approximation of the Basic Reproduction NumberR0for Vector-Borne Diseases with a Periodic Vector Population. Bulletin of Mathematical Biology 69: 1067–1091.
17. Diekmann O, Heesterbeek JAP, Roberts MG (2010) The construction of next-generation matrices for compartmental epidemic models. Journal of The Royal Society Interface 7: 873–885.
18. Saltelli A, Tarantola S, Campolongo F, Ratto M (2004) Sensitivity Analysis in Practice: A Guide to Assessing Scientific Models. Chichester: John Wiley and Sons.
19. Smith DL, McKenzie FE, Snow RW, Hay SI (2007) Revisiting the Basic Reproductive Number for Malaria and Its Implications for Malaria Control. PLoS Biol 5: e42.
20. Yakob L (2011) Epidemiological consequences of a newly discovered cryptic subgroup of Anopheles gambiae. Biology Letters 7: 947–949.
21. Yakob L, Dunning R, Yan G (2011) Indoor residual spray and insecticide-treated bednets for malaria control: theoretical synergisms and antagonisms. Journal of The Royal Society Interface 8: 799–806.
22. Yakob L, Yan G (2009) Modeling the Effects of Integrating Larval Habitat Source Reduction and Insecticide Treated Nets for Malaria Control. PLoS One 4: e6921.
23. Dumont Y, Chiroleu F (2010) Vector control for the Chikungunya disease. Mathematical biosciences and engineering 7: 313–345.
24. Massad E, Ma S, Burattini MN, Tun Y, Coutinho FAB, et al. (2008) The Risk of Chikungunya Fever in a Dengue-Endemic Area. Journal of Travel Medicine 15: 147–155.
25. Poletti P, Messeri G, Ajelli M, Vallorani R, Rizzo C, et al. (2011) Transmission Potential of Chikungunya Virus and Control Measures: The Case of Italy. PLoS ONE 6: e18860.
26. Boelle PY, Thomas G, Vergu E, Renault P, Valleron AJ, et al. (2008) Investigating Transmission in a Two-Wave Epidemic of Chikungunya Fever, Re´union Island. Vector-Borne and Zoonotic Diseases 8: 207–217.
27. Cauchemez S, Boe¨lle PY, Donnelly CA, Ferguson NM, Thomas G, et al. (2006) Real-time estimates in early detection of SARS. Emerging Infectious Diseases 12: 110–113.
28. Ferguson NM, Donnelly CA, Anderson RM (1999) Transmission dynamics and epidemiology of dengue: insights from age-stratified seroprevalence surveys. Philosophical Transactions of the Royal Society of London B Biological Sciences 354: 757–768.
29. Massad E, Coutinho FA, Burattini MN, Lopez LF (2001) The risk of yellow fever in a dengue-infested area. Transactions of the Royal Society of Tropical Medicine and Hygiene 95: 370–374.
30. Favier C, Degallier N, Rosa-Freitas MG, Boulanger JP, Costa Lima JR, et al. (2006) Early determination of the reproductive number for vector-borne diseases: the case of dengue in Brazil. Tropical Medicine and International Health 11: 332–340.
31. Panning M, Grywna K, van Esbroeck M, Emmerich P, Drosten C (2008) Chikungunya fever in travelers returning to Europe from the Indian Ocean region, 2006. Emerging Infectious Diseases 14: 416–422.
32. Parola P, de Lamballerie X, Jourdan J, Rovery C, Vaillant V, et al. (2006) Novel chikungunya virus variant in travelers returning from Indian Ocean islands. Emerging Infectious Diseases 12: 1493–1499.