Therefore, we have used HUCPV progenitor cells to elucidate the function of BRE. HUCPV cells are multipotent fetal progenitor cells which possess the ability to differentiate into a multitude of mesenchymal cell lineages when chemically induced and can be more easily amplified in culture. In this study, we have established that BRE expression was normally expressed in HUCPV cells but become down-regulated when the cells were induced to differentiate. In addition, silencing BREexpression, usingBRE-siRNAs, in HUCPV cells could accelerate induced chondrogenic and osteogenic differentiation. Hence, we postulated that BRE played an important role in maintaining the stemness of HUCPV cells. We used microarray analysis to examine the transcriptome ofBRE-silenced cells.BRE-silencing negatively regulatedOCT4,FGF5andFOXO1A. BRE-silencing also altered the expression of epigenetic genes and components of the TGF-b/BMP and FGF signaling pathways which are crucially involved in maintaining stem cell self-renewal. Comparative proteomic profiling also revealed thatBRE-silencing resulted in decreased expressions of actin-binding proteins. In sum, we propose that BRE acts like an adaptor protein that promotes stemness and at the same time inhibits the differentiation of HUCPV cells.
Citation:Chen E, Tang MK, Yao Y, Yau WWY, Lo LM, et al. (2013) Silencing BRE Expression in Human Umbilical Cord Perivascular (HUCPV) Progenitor Cells Accelerates Osteogenic and Chondrogenic Differentiation. PLoS ONE 8(7): e67896. doi:10.1371/journal.pone.0067896
Editor:Maurizio Pesce, Centro Cardiologico Monzino, Italy
ReceivedDecember 4, 2012;AcceptedMay 23, 2013;PublishedJuly 23, 2013
Copyright:ß2013 Chen et al. This is an open-access article distributed under the terms of the Creative Commons Attribution License, which permits unrestricted use, distribution, and reproduction in any medium, provided the original author and source are credited.
Funding:This research was supported by the Hong Kong Research Grant Council, ‘‘General Research Fund: CUHK469809.’’ (http://www.ugc.edu.hk/eng/rgc/ index.htm.) The funders had no role in study design, data collection and analysis, decision to publish, or preparation of the manuscript.
Competing Interests:The authors have declared that no competing interests exist. * E-mail: [email protected]
Introduction
BRE is also known as TNFRSF1A modulator and BRCC45. This highly conserved gene was initially identified as a stress-responsive gene – whose expression was inhibited following DNA damage and retinoic acid treatment [1]. BRE shares no homology with other known gene products [2]. The protein contains two putative ubiquitin E2 variant domains but lacks critical cysteine which is required for ubiquitination [3]. BRE protein is present in both the cytosol and nucleus. In the cytoplasm, BRE binds to the cytoplasmic region of p55 TNF receptors to suppress TNF-a
induced activation of NF-kB [4]. The protein can also bind to Fas to inhibit the mitochondrial apoptotic pathway [5]. BRE is also found to be a component in BRISC complex that specifically cleaves lysine63-linked ubiquitin [6]. BRE may function as a key adaptor protein which assembles the different components of the BRISC complex [7]. In the nucleus, BRE is a component of the DNA damage responsive BRCA1-RAP80 complex. BRE protein acts as an adapter that links the interaction between NBA1 and the rest of the complex. This adapter modulates the ubiquitin E3 ligase activity of the BRCA1/BARD1 complex by interacting with
MERIT 40 which enhances cellular survival following DNA damage [7,8,9].
umbilical cord blood (1:200 million). The HUCPV cells also showed a higher proliferative potential and expressed higher levels of CD146 (a putative MSC marker) in comparison to MSCs obtained from bone marrow [15]. These cells also express surface antigens CD44, CD73, CD90, CD105 and CD106 but do not express CD34 or CD45 [14,15,16]. HUCPV cells are multipotent and capable of differentiating into all mesenchymal lineagesin vitro [15,16,17]. Notably, these cells contribute to rapid connective tissue healingin vivoby producing bone and fibrous stroma [18]. Besides being multipotent, these cells are immunoprivileged making them less likely to be immune-rejected as allografts [16,19]. Furthermore, these foetal cells express the embryonic cell markers SSEA-4, RUNX1 and OCT4 [20]. HUCPV cells can be obtained non-invasively, making them an ideal source for stem cells therapies.
Materials and Methods
Cell culture
The human umbilical cords were obtained from the Depart-ment of Obstetrics and Gynecology and were approved by Chinese University of Hong Kong Clinical Research Ethics committee (project reference number CRE 2011.116). This is centrally registered with the Hong Kong Health Authority. The physician obtained verbal informed consent from the mother for use of the umbilical cord in research. The cords were then dissected aseptically with the aid of a dissecting microscope as described by Sarugaser et al. [16]. Briefly, the amniotic epithelium was removed from the cord with forceps and scissors (Figure 1A). The two umbilical arteries and umbilical vein were then separated from the cord using forceps. The vessels were then tied in a loop at each ends using sutures as shown in Figure 1B and the placed in 80 U/mL type I collagenase (Gibco) and 0.01 U/mL in a 50 mL Falcon tube. The digestion was carried out in a shaker for four hours at 37uC. The extracted cells were then centrifuged at 500 rpm for 5 min at room temperature. The supernatant was next centrifuged at 1,500 rpm for 3 min at room temperature. The pellet of cells were resuspended in regular growth medium consists of DMEM/F12 supplemented with 15% embryonic stem cell-qualified fetal bovine serum (ESQ-FBS), 100 units/mL penicillin and 100mg/mL streptomycin (all from Gibco) and seeded into culture dish coated with 1% gelatin in ddH2O. The cells are
maintained in a 5% CO2 humidified incubator (Thermo
Scientific). After one week culture, the isolated HUCPV progen-itor cells became confluent for the analysis (Figure 1C).
Flow cytometry
The crude HUCPV progenitor cells were purified by flow cytometry. Briefly, the confluent culture was trypsinized into suspension and incubated with anti-human CD44, CD90, CD105 and CD146 conjugated PE antibodies for positive selections and anti-human CD34 and CD45 conjugated PE antibodies for negative selection. All antibodies were purchased from BD Biosciences. The immune reactions were performed at 4uC for 20 min. The cells were analyzed and sorted using a FACSAria flow cytometer (BD Biosciences) with FACSDiva software (BD Biosciences).
Mouse embryonic stem cell (ESC) culture
Mouse ES cell line (AINV15, obtained from ATTC) was cultured on 13 mm glass coverslips in 1,400 U/ml of LIF (Millipore) and expanded by co-culture with 10mg/ml mitomycin C-inactivated mouse embryonic fibroblasts to inhibit differentia-tion. To induce ESC differentiation, LIF was withdrawn from the culture medium for 24 hours and then the cells were fixed in 10% formalin. Along with undifferentiated ESC cultures, they were processed for immunofluorescent staining with BRE and OCT4 antibodies. Each immunofluorescent staining analysis was per-formed in triplicate.
Immunofluorescence microscopy
HUCPV cells, cultured on glass coverslips, were fixed in 10% formalin and permeabilized with 0.5% Triton X-100 (Sigma) with 0.1% SDS (Sigma) for 30 min. The samples were then washed three times with PBS and blocked with 2% BSA with 5% normal horse serum for 1 hour. Afterward, the samples were incubated with primary antibody overnight. Primary antibodies used in this study include: CD146 (Zymed, Invitrogen), Ki-67 (Santa Cruz), SOX9 (Abcam), type I collagen (Millipore), type II collagen (Millipore). Non-specific antibody binding were then washed with PBS with 0.05% Tween-20 (PBST) three times for 10 min and PBS for 5 min. Then secondary antibody (Jackson ImmunoR-esearch Laboratories) was added and incubated for 1 hour. The unbound antibodies were washed with PBST three times for 10 min and PBS for 5 min. DAPI was added for visualizing the nucleus. The fluorescent signal was detected using a confocal microscope (Olympus, FluoView 1000) under a Fluequipped with 406Zeiss PlanNeofluo objectives.
RT-qPCR and statistical analysis
Total RNA was isolated from cells using TRIzolH reagent (Invitrogen) according to the manufacturer’s instruction. The purity, integrity, and concentrations of RNA were evaluated using the Nanodrop Bioanalyzer (Nanodrop Technologies). First strand cDNA was obtained from 1mg total RNA reverse transcribed using Ready-To-Go You-Prime First-Strand beads and oligo(dT) following the manufacturer’s instruction (GE Healthcare). The resulting cDNAs were amplified using SYBRHPremix Ex Taq mix (Takara Biotechnology) and analyzed by a 7900HT Fast Real-Time PCR System (Applied Biosystems). The shuttle PCR protocol included initial denaturation (95uC for 30 second), annealing (40 cycles of 95uC for 5 second and 60uC for 30 second) and final extension (95uC for 15 second, 60uC for 1 minute, and 95uC for 15 second). Genes of interest were analyzed and normalized against house-keeping gene, GAPDH. The other internal house-keeping gene, glucuronidase-b (gusb) was selected to check the stability of GAPDH. Experiments were performed in triplicates. The expression levels were calculated by 22DDCT
method [21]. For Statistical analysis, the data was presented as Figure 1. Extraction and purification of HUCPV cells. (A)
Representative picture of a human umbilical cord showing the umbilical vein (represented by solid circle) and umbilical arteries (represented by dashed circle). (B) Prior to treatment with collagenase, the umbilical blood vessel was ligated at both ends. (C) The primary HUCPV cells were isolated by collagenase digestion of the perivascular region of the ligated blood vessel.
performed in triplicate.
Microarray analysis
Total RNA was extracted from HUCPV cells using NucleoS-pinH RNA II (Macherey-Nagel) according to manufacturer’s instructions. The RNA integrity was determined by Nimblegen bioanalyzer prior to microarray hybridization (Roche). Then, 10mg of total RNA was reverse transcribed by SuperScriptTM Double-Stranded cDNA Synthesis Kit (Invitrogen). For Cy3 cDNA labelling, 1mg of double-stranded cDNA sample was labelled using the NimbleGen One-Color DNA labelling kit (Roche) following the manufacturer’s manual. Briefly, 1mg cDNA was labelled with Cy3 random nanomers using Klenow fragment. Followed by incubation at 37uC for 2 hours, the labelling reaction was next terminated using EDTA. After isopropanol precipitation, the Cy3 labelled cDNA pellet was rinsed with 80% ethanol and vacuum dried on low heat. Cy3 labelled cDNA was rehydrated in 25ml PCR grade water and quantified using Quan-iT PicoGreen dsDNA assay kit (Invitrogen). The analysis was performed in triplicate.
Array hybridization was performed on NimbleGen human 126 135K v5.1 high-density single channel oligonucleotide arrays (Roche). Briefly, 4mg of Cy3 labelled cDNA was vacuumed dried and resuspended in 3.3ml sample tracking controls and hybridized at 42uC in NumbleGen Hybrization System 4 for 16 hours. Next, the array was washed using the NimbleGen wash buffer kits, the array slide was spin dried and scanned using the NimbelGen MS 200 Microarray Scanner. Scanned images were analyzed using a DEVA software Version 1.0.1 (Roche) and Partek Genomics Suite version 6.12.0103 (Partek). Array data has been deposited in NCBI Gene Expression Omnibus (GEO, http://www.ncbi.nlm.nih.gov/ geo/) number GSE39948.
Comparative Proteomics
Total protein lysates were extracted from HUCPV cells transfected withBRE-siRNA orCtl-siRNAs. Extraction condition, two-dimensional gel electrophoresis (2-DE), MALDI-TOF mass spectrometry and bioinformatics search were performed as we previously reported [22,23,24]. Briefly, first dimensional electro-phosis (1-DE) was performed on an IPGphor IEF system using 11-cm long IPG electrode strip with pH 3–10 gradient (Amersham Biosciences, UK) and an Ettan IPGphor Strip Holder (Amersham Biosciences, UK). 150mg of protein was applied for each IPG strip. The total volume of protein sample with rehydration buffer (8M Urea, 2% CHAPS (w/v), 1% IPG buffer (v/v), 40 mM DTT) loaded onto the strip holder was 210ml. The sufficient volume of IPG Cover Fluid was applied to each strip so as to minimize evaporation and urea crystallization. The rehydration step was
The 2-DE was performed in an ISO-DALT apparatus (Hoefer Scientific Instruments) at room temperature under constant voltage 100 V till the dye front reached the bottom of the gel. The gels were then fixed in 50% methanol, 12% acetic acid and 0.5 ml 37% formaldehyde for 1 hour. After fixation, the gels were washed in MilliQ water (46), 50% ethanol (v/v) for 20 min (26), 0.02% sodium thiosulphate (w/v, Merck, UK) for 10 min and distilled water (36). Subsequently, the gel was stained in silver solution (0.15% silver nitrate in 0.75 ml 37% formaldehyde) at 4uC for 1 hr. After several brief washes, the gels were developed in developer solution (1 ml 37% formaldehyde, 30 g sodium carbonate and 2 mg sodium thiosulphate in one liter buffer) until the desired staining intensity was attained. The gels were then immersed in 5% acetic acid (v/v, BDH Chemicals Ltd., UK) for 5 mins to terminate the staining process. Finally, the silver stained gels were scanned using a GS 800 Densitometer (Bio-Rad Laboratories, USA) and the images captured were used for image analysis. The protein spots on the gel were analysed using a PDQuest 2D Analysis Software version 7.13 PC (The Discovery Series, Bio-Rad Laboratories, USA). Each experiment was performed in triplicate.
Protein identification by mass fingerprinting
All protein spots of interest were isolated from the 2D-gel and processed for silver destaining. The gel pieces were first washed in MilliQ water, immersed in 200ml of destaining solution (15 mM potassium ferricyanide and 50 mM sodium thiosul-phate) and then incubated at room temperature until they turned colourless. Each gel pieces was then washed in 400ml of MilliQ water for 15 min (36). The destained gel pieces were then equilibrated in 200ml of 10 mM ammonium bicarbonate/ 50% acetonitrile for 15 min. The gel was dehydrated in 200ml of acetonitrile for 15 min and dried at 30uC for 5 min. The gels were digested with 15mg/ml of trypsin in 40 mM ammonium bicarbonate/50% acetonitrile (v/v) at 35uC for 16 hrs. Threeml of extraction solution (50% acetonitrile (v/v) and 5% trifluor-oacetic acid (Fluka Chemika, Switzerland) were used to stop the reaction. Threeml of reaction mixture was mixed witha -cyano-4-hydroxycinnamic acid matrix and then spotted onto a sample plate for ESI-MS/MS analysis (Bruker Daltonics, USA). The mass spectrums generated were analysed using a Bruker Daltonics software and by mass fingerprinting, which were submitted to the SwissPort bioinformation stations using MASCOT 2.2.07 engine search.
Immunoprecipitation (IP) Assay
NaCl, 1% NP-40 and 0.5% sodium deoxycholate) inside a microcentrifuge tube. After the samples were centrifuged for 20 mins at 12,000 rpm at 4uC, the supernatant were aspirated and place in a fresh tube. The lysates were pre-cleared with Sepharose beads for 1 hr on ice and spun in centrifuge to discard the bead pellet. The pre-clear lysates were incubated with the appropriate concentration of antibody in the Sepharose beads, overnight. When the incubation was completed, the lysates were washed in lysis buffer 36. Finally, the lysates were added the 26loading buffer and boiled at 95uC for 5 mins. The lysate samples were resolved and the proteins were analysed by routine western blot analysis using the OdysseyH CLx infrared imaging system. The actin, ANAXII and BRE were used for the IP assay. The Assay was performed in triplicate.
Scratch cell migration assay
The scratch assay was performed according to methods described by Liang et al. [56]. The Ctl-siRNAs and BRE-siRNA treated HUCPV cells were seeded onto 4-well culture plates. The cells were then treated with 2mg/ml mitomycin C (Sigma, USA) for 1 hr to prevent further cell proliferation (which could confound our interpretation of the cell migration analysis). After the treatment, a sterile p10 pipet tip was used to scrap off cells from the center of the monolayer to create a gap in the culture. Reference lines were etched onto the bottom of the plastic culture dishes to define the position of the gap/wound. Photos were taken of theCtl-siRNAsand BRE-siRNAtreated cells migrating into the wound area at day 0–day 3 incubation. The photographic images captured were quantitatively analysed by establishing the number of cells that have migrated into the gap. The assay was performed in triplicate.
Results
HUCPV cells are multipotent
HUCPV cells are normally found in the perivascular regions of human umbilical arteries and veins, which we isolated according to procedures described by Sarugaser et al. [16]. Briefly, both ends of the umbilical vessels were first ligated and then the perivascular region containing the HUCPV cells was digested using collagenase (Figures 1A–C). The crude cell extracts produced were then sorted and purified for HUCPV cells using flow cytometery for CD342, CD452, CD44+, CD90+, CD105+and CD146+surface markers
(Figure 2A). Immunofluorescence staining revealed that our HUCPV cells strongly expressed CD146, which is a marker for mesenchymal stem cell (Figure 2B). The cells were negatively stained for CD34, which is a hematopoietic stem cell marker (Figure 2C).
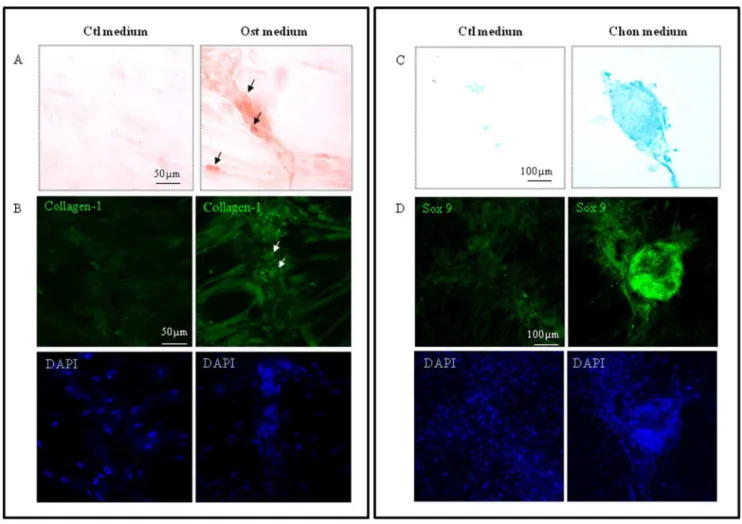
To assess the developmental potential of HUCPV cells, they were treated with osteogenic and chondrogenic inducing media. These cells were able to differentiate into osteoblasts after 3 weeks induction. Alizarin red S staining revealed the presence of calcified bone matrix in the cell culture as the HUCPV cells underwent osteogenesis (Figure 3A). These osteogenic induced HUCPV cells also expressed collagen type I while the control cultures only expressed background levels of collagen (Figure 3B). Similarly, the HUCPV cells were tested for their chondrogenic potential and were treated with chondrogenic induction medium. Alcian blue staining revealed that the induced HUCPV cells deposited sulfated proteoglycans 4 weeks after treatment (Figure 3C). These cells also expressed the key transcription factor SOX9 and formed cell aggregates not found in control cultures (Figure 3D).
BRE expression during HUCPV and embryonic stem cell (ESC) differentiation
It has been reported thatBREexpression was down-regulated when tumor cells were treated with retinoic acid, a differentiating agent [1]. Therefore, we examinedBREexpression in HUCPV cells when they are induced to differentiate. We established that BRE expression was down-regulated when HUCPV cells were induced in osteogenic medium after 3 weeks or chondrogenic medium after 4 weeks as compared with control medium (Figure 4A). Immunofluorescence staining using BRE antibody also confirmed that BRE protein expression was decreased as HUCPV cells differentiated into osteoblasts and chondrocytes (Figure 4B). Therefore, we hypothesize that BRE suppresses HUCPV cell differentiation.
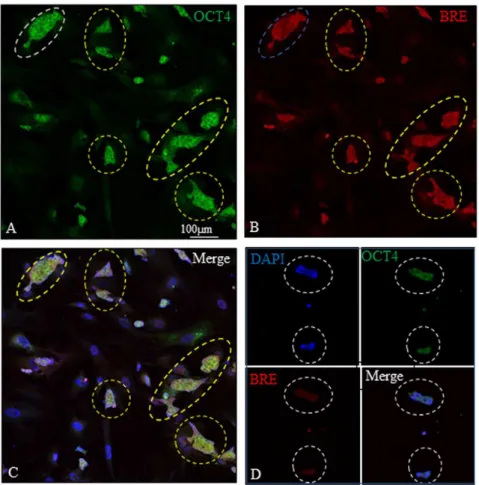
Besides HUCPV cells, we also examined the co-localization of Oct4 (pluripotent marker) and BRE in mouse embryonic stem cells (ESCs). In the presence of LIF, we found that BRE and OCT4 were strongly co-expressed in undifferentiated ESCs (Figure 5 A–C). When LIF was withdrawn from the culture medium to allow the ESCs to differentiate, it resulted in a synchronized reduction of BRE and OCT4 expression (Figure 5D).
Silencing BRE accelerates chondrogenic and osteogenic induction
We have used siRNAs to silence BREexpression to test our hypothesis that BRE inhibits HUCPV cell differentiation. HUCPV cells were transfected twice with either BRE- or ctl -(scrambled control) siRNAs at 24-hour intervals, prior to inducing the cells with differentiation medium. We first confirmed that transfection with ourBRE-siRNA was able to significantly reduce both BRE mRNA and protein expressions in HUCPV cells (Figure 6A). In addition, the growth rate and survival rate ofBRE -silenced HUCPV cells were unaffected when compared with the control. This is evident by the duration required forBRE-silenced and control cells to reach confluency and the total number of DAPI labeled cells present in the cultures (Figure 6B).
In this study, HUCPV cells were transfected withBRE-siRNA orCtl-siRNAsprior to exposure to osteogenic inducing medium for 3 days. QRT-PCR analysis of these cultures revealed that there were significant increase in osteopontin (OPN), osteocalcin (OC), collagen I (COL1) and RUNX2 expression in the inducedBRE -silenced cells compared with induced cells transfected with Ctl-siRNAs (Figure 7A). Correspondingly, Alizarin red S staining revealed that the induced BRE-silenced HUCPV cultures contained calcified bone matrix whereas no staining was found in the control cultures (Figure 7B). Normally, 3 weeks were required to induce HUCPV cells to undergo osteogenesis in osteogenic inducing medium. Our results revealed that silencing BREexpression significantly accelerated this response as evident by the HUCPV cells expressing osteogenic gene markers and calcified matrix within 3 days of osteogenic induction.
Figure 2. Purification of HUCPV cells.(A) HUCPV cells were analyzed with surface markers which included CD34, CD44, CD45, CD90, CD105 and CD146. (B and C) Immunofluorescence staining confirmed that the HUCPV cells expressed CD146 but not CD34. The nuclei were counterstained with DAPI.
doi:10.1371/journal.pone.0067896.g002
Figure 3. HUCPV cells differentiated into osteoblasts and chondrocytes, 3 and 4 weeks after induction, respectively.(A) Alizarin red S staining and immunofluorescence staining with pro-collagen type-I antibody were used to demonstrate osteogenic differentiation by HUCPV cells maintained in osteogenic (Ost) medium and control (Ctl) media for 3 weeks. (B) Alcian blue staining and immunofluorescence staining with SOX9 antibody were used to demonstrate chondrogenic differentiation in HUCPV cells cultured in chondrogenic (Chon) and control (Ctl) media for 4 weeks. The nuclei were counterstained with DAPI. N = 3 independent experiments.
cells transfected with theCtl-siRNAs(Figure 8B). Hence, it appears that silencingBREexpression in HUCPV cells could greatly speed up their response to chondrogenic inducing medium – where normally it would require 4 weeks instead of 10 days.
Microarray analysis ofBRE-silenced HUCPV cells
Since silencing BRE expression could accelerate induced chondrogenic and osteogenic differentiation, we postulated that BRE might play an important role in regulating stemness and differentiation in HUCPV cells. In this context, we performed microarray expression profiling to ascertain the global changes in gene expression following BRE-silencing. HUCPV cell cultures were transfected twice with eitherBRE- orCtl-siRNAs over a 24-hour interval. The transcriptome ofBRE-silenced cells were then compared with cells transfected withCtl-siRNAs. Only genes whose expression differed by at least 1.4-fold with a P value less than 5%
were considered significant and deemed genes that are differen-tially expressed. We determined that there were 1301 genes up-regulated and 1433 genes down-up-regulated inBRE-silenced cells compared with the control cells. Hierarchical clustering performed on differentially expressed genes are shown in Figure 9A. These genes were enriched by gene ontology according to biological processes (Figures 9B). Cell proliferation, growth, and metabolic processes categories were the top three enriched scores. To specifically elucidate how BRE-silencing modulates stem cell function, gene sets that were significantly associated with developmental processes were investigated.
BRE and Stemness factors
We first analyzed a panel of known pluripotent- and differen-tiation-related genes in detail [25,26,27,28,29,30]. In response to BRE-silencing, we observed several pluripotent-related and Figure 4. BRE expressions during HUCPV cell differentiation.(A) RT-qPCR revealed that as HUCPV cells were induced to differentiate in osteogenic (Ost) and chondrogenic (chon) medium, BREexpression was down-regulated.BRE expression was normalized againstGAPDH. The statistical difference of P values were determined by t-test; *p,0.05, **p,0.01 and *p,.05 were considered significantly different. (B) Immunofluorescence microscopy confirmed that BRE expression (red) was suppressed as the HUCPV cells were induced to form osteoblasts and chondroblasts. Control (Ctl) medium. Osteogenic (Ost) and chondrogenic (Chon) inducing medium. The nuclei were counterstained with DAPI. N = 3 independent experiments.
Figure 5. BRE and OCT4 expression in ESCs.(A–C) In the presence of LIF, BRE and OCT4 were strongly co-expressed in undifferentiated ESCs (yellow dotted outlines). (D) LIF was withdrawn from the culture for 24 hours to allow the ESCs to differentiate. This resulted in a reduction of BRE and OCT4 expression in the ESCs (white dotted outlines). N = 3 independent experiments.
doi:10.1371/journal.pone.0067896.g005
Figure 6. BRE expressions inBRE-silenced HUCPV cells.(A) RT-qPCR and (B) immunofluorescence microscopy showingBRE-siRNAs could silence BRE expression in HUCPV cells. Our control Ctl-siRNAs did not affect BRE expression. For RT-qPCR,BREexpression was normalized to housekeeping geneGAPDH. The statistical difference of P values were determined by t-test and **p,0.01 were considered significantly different. The nuclei were counterstained with DAPI. N = 3 independent experiments.
stemness genes were down-regulated when compared with control HUCPV cells. Amongst these genes include OCT4, AHCTF1, CDC2, COBRA1, FGF5, FOXO1A, LIFR, NOG and REST(Figure S1A). RT-qPCR was performed to verify some of the down-regulated genes that we found - especially OCT4, as well as the other three key ‘‘Yamanaka factors’’ genes [31] (Figure S1B).
BRE and Epigenetic regulation
Expressions of polycomb complex genes, which are key epigenetic regulators, were also found to be altered by BRE -silencing. There are two main Polycomb-repressive complexes (PRCs): PRC1 and PRC2 which are both capable of repressing hundreds of genes in mESCs. Components of the PRC1 and PRC2 genes that we found down-regulated by BRE-silencing include PHC3, SCML2, EZH2, SUZ12P and PHF19; whereas, the genes that were up-regulated includeL3MBTLandJARID2 (Figures S2A and B). Other genes involved in chromatin modifications, such as DNA methylation and histone modifica-tions, were also altered in response to BRE-silencing. In our study, the expression of HDAC9 was up-regulated following BRE-silencing. In addition, non-histone chromatin associated genesCHAF1A,CHAF1B, and POLE2 were all down-regulated in response toBRE-silencing.
BRE and TGF-b/BMP signaling
TGF-b/BMP signaling pathway has been extensively reported to play a crucial role in maintaining hESCs and hMSCs in an undifferentiated state and also in suppressing cell differentiation [32,33,34,35,36,37]. Consistent with these reports, we have found that components of this signaling pathway were down-regulated by BRE-silencing. Specifically, SMAD6, SMAD8, and their down-stream target genes ID1, ID2, ID2B, and ID3 were all down-regulated (Figure S3A–C).
BRE and FGF signaling
FGF signaling is essential for preventing hESCs differentiation and in maintaining hMSCs undifferentiated during their prolifer-ative state [36,38,39,40]. We observed thatFGF2,FGF9,FGF10, FGF21, FGFBP1,FGFR2and FGFR3expressions were all down-regulated as a consequence of silencing BREexpression (Figure S4A and B).
BRE and chemokines
The effects of BRE-silencing on chemokines and cytokines expression by HUCPV cells were investigated. The chemokines that were up-regulated includeCCL3,CXCL3, CXCL5,CXCL10, CXCL11, andCXCL12(Figure S5A and B). A number of cytokines and receptors such asTNFSF9,TNFSF15,TNFSF18,TNFRSF19, Figure 7. SilencingBREexpression accelerated osteogenic induction (requiring 3 days instead of 3 weeks).(A) RT-qPCR showing osteopontin (OPN), osteocalcin (OC), collagen I (COL1) andRUNX2gene expression patterns were strongly up-regulated inBRE-silenced HUCPV cells compared with cells treated withCtl-siRNAs. All transfected cells were induced in osteogenic medium (ost) for 3-day. As a negative control, theBRE -siRNA andCtl-siRNAstransfected cells were maintained in control medium (Ctl) 3-day for comparison. Gene expression was normalized against GAPDH. As a control, the stability of GAPDH during osteogenic differentiation was also investigated using GUSB for normalization. The results revealed that GAPDH expression did not alter significantly during differentiation – supporting our use of GAPDH as an internal control. (B) Alizarin red S staining revealed the presence of calcified bone matrix in theBRE-silenced HUCPV cells but not in control cultures. Both transfected cells were induced with osteogenic medium for 3-day. N = 3 independent experiments.
TNFRSF9, GDF5, IL1F9, IL7, IL15, IL1RAP, IL1RAPL2, IL6R, IL15RA,IL21R,IL31R,PDGFDandVEGFwere also up-regulated; whereas other cytokines such as IFNA1, IFNA2, IFNA4, IFNA5, IFNA13, IFNA14, TNFAIP8, IL11, IL16, IL20, HTR2A, IFNA, EGF, andMPLwere down-regulated (Figure S6A–E).
BRE and Homeobox (HOX) transcription factors
HOXencoded proteins are homeodomain-containing transcrip-tion factors that are important regulators of cell proliferatranscrip-tion, self-renewal and differentiation in hematopoietic stem cells [41,42,43]. In response toBRE-silencing, the expression ofHOXB6,HOXB9, and HOXD4 were up-regulated while the expression ofHOXA2, HOXA3,HOXA10,HOXA11,HOXA13, andHOXB1were down-regulated (Figure S7).
BRE-silencing alters the proteome of HUCPV cells
We have also examined the proteome ofBRE-silenced HUCPV cells and compared it with the proteome of HUCPV cells transfected with Ctl-siRNAs. The Protein lysates from both specimens were first resolved by 2-DE. Proteins that were determined to be differentially expressed were then identified by MALDI-TOF mass spectrometry. Seventy differentially expressed protein spots were detected. There were 19 protein spots that were up-regulated while 51 protein spots were down-regulated as a consequence of BRE-silencing. These proteins were categorized into their role in terms of molecular functions which was achieved by using the Database for Annotation, Visualization and Integrated Discovery (DAVID) program (Table S2) [44,45].
Functional annotation clustering pointed to alterations in cytoskeletal protein binding in response to BRE-silencing in HUCPV cells. Furthermore, BRE-silencing response proteins appear to be involved in bindings of DNA, RNA, ATP and unfolded protein. In addition, the differentially expressed proteins have been annotated to regulate enzymatic activities such as isomerase and oxidoreductase activities.
BRE-silencing alters expression of cytoskeletal binding
proteins
In the comparative proteomic study,BRE-silencing resulted in decreased expression of actin and tropomyosin proteins. Expres-sions of several actin modifying proteins, which are regulated by Rho-GTPases, were also found to be depleted in response toBRE -silencing [46]. These actin modifying proteins include annexin A2 (ANXA2), actin-related protein 2/3 (Arp2/3) complex subunit 5-like protein (ARP5L), fructose-bisphosphate aldolase A (ALDOA), calponin-2 (CNN2), cofilin-1 (COF1), and ezrin (EZRI) (Figure 10 and Table S3). In contrast, expressions of calmodulin (CALM) and chromosome 22 open reading frame 28 (RTCB) were up-regulated in response toBRE-silencing.
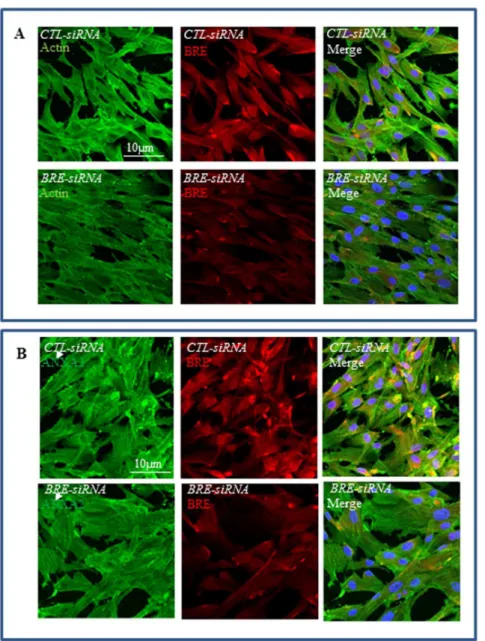
We selected actin and ANXA2 for further investigation. Immunofluorescence staining microscopy confirmed our proteo-mic results that actin and ANXA2 expressions were reduced in BRE-silenced HUCPV cells (Figures 11A and B). Furthermore, in co-immunofluorescence staining of cultured HUCPV cells, we found actin and BRE were was co-localized in the cytoplasm. Likewise, ANXA2 was also co-localized with BRE. In addition, Figure 8. SilencingBREexpression accelerated chondrogenic (requiring 10 days instead of 4 weeks) induction.(A) RT-qPCR showing SOX9, versican (VCAN) and biglycan (BGN) expression patterns were strongly up-regulated inBRE-silenced HUCPV cells compared with control cells. All transfected cells were induced in chondrogenic medium (Chon) for 10-days. The transfected cells were also maintained in control medium (Ctl) for 10-days as a negative control. (B) Immunofluorescence staining confirmed that SOX9 was expressed byBRE-silenced HUCPV cells as compared with control cells. Both transfected cells were induced in chondrogenic medium for 10-days. The nuclei were counterstained with DAPI. (A, C). The statistics of P values were determined by t-test; *p,0.05, **p,0.01 and ***p,0.001 were considered significantly different. N = 3 independent experiments.
phalloidin staining revealed that the highly organized F-actin structures seen in control HUCPV cells were totally disassembled in BRE-silenced HUCPV cells (Figure 12A). We also observed striation patterns when BRE antibody was used in immunofluo-rescence studies. Therefore, we performed immunoprecipitation study to determine whether actin and ANXA2 can directly bind endogenous BRE. We used monoclonal BRE specific antibody to pull down the proteins in cell lysates. We determined that BRE can directly associate with actin and ANXA2 (Figure 12B). Since actin and ANXA2 are also involved in regulating cell motility, we investigated whether cell migration was altered in BRE-silenced HUCPV cells using a Scratch assay. We observed that BRE -silenced cells migrated at a slower rate than cells transfected with Ctl-siRNAs in the Scratch assay. Approximately 4068.6% of the area of the gap was filled up with BRE-silenced cells compared with 96610% for Ctl-siRNAs treated cells (Figure 12C). The experiment was repeated in triplicate. The statistical difference of P values were determined by t-test; p,0.05, was considered significantly different.
BRE-silencing alters expression of stemness-related
proteins
We have closely examined the proteomic results for proteins that maintain stemness and regulate stem cell differentiation. The results revealed that calreticulin (CALR), far upstream element-binding protein 1 (FUBP1) and pyruvate kinase isozymes M1/M2 (PKM2) expression were all down-regulated when BRE was silenced in HUCPV cells (Table S4).
Discussion
In this study, we demonstrated that HUCPV cells transient transfected with BRE-siRNA could accelerate osteogenic and chondrogenic differentiation when they are cultured in the appropriate inducing medium. Normally, osteogenic induction of HUCPV cells requires approximately three weeks to take place while chondrogenic induction requires even longer, four weeks. In contrast, when BRE expression was silenced, HUCPV cell differentiation was greatly speeded up – 3 days instead of 3 weeks Figure 9. Microarray analyses HUCPV cells transfected withBRE-siRNAsandCtl-siRNAs.(A) Illustrating the hierarchical clustering of genes that were differentially expressed. The gene expression profiles revealed that 1301 genes were significantly up-regulated (red) and 1433 genes were significantly down-regulated (blue) inBRE-silenced cells compared with control cells. Gene expression with62 fold change and the statistics of P values were determined by t-test; p,0.05 was considered significantly different. N = 3 independent experiments. (B) A forest plot showing the gene ontology enrichment of microarray results categorized according to biological processes.
were required for osteogenic induction and 10 days instead of 4 weeks for chondrogenic induction. Previous studies have demon-strated that using BMP-2 and dexamethasone, it was possible to rapidly induce rat bone marrow stromal cells to become osteoblasts, requiring only 8 days [47]. Presently, we revealed that silencingBREexpression prior to osteogenic induction could enhance osteogenesis even faster than by adding exogenous BMP-2. This observation is particularly important in the field of regenerative medicine, especially in the context of non-union bone and cartilage fractures when rapid repair is highly desirable to prevent later complications.
To elucidate the function of BRE in HUCPV cells, we employed microarray analysis. We identified a number of BRE targeted genes in HUCPV cells that have important roles in maintaining stemness. We grouped these genes into different categories. In BRE-silenced HUCPV cells, we observed OCT4, FGF5, and FOXO1A expression was down-regulated and these transcriptional genes are essential for maintaining pluripotency in ES cells. Especially OCT4, which is part of the core transcriptional regulatory circuit that maintains stem cell pluripotency by activating self-renewal genes and suppressing genes that promote differentiation [26,27]. This finding is further collaborated by the fact that HMGB2, a co-activator of OCT4 activity, was also correspondingly down-regulated followingBREsilencing [48]. In addition, we also established that pluripotent epiblast marker FGF5and the recently identified essential hESCs pluripotent gene FOXO1A were also inhibited in response to BRE-silencing [49,50,51,52]. Expressions of epigenetic and chromatin modifier genes were also affected - with HDAC9 expressions enhanced followingBRE-silencing. Histone deactylase genes perform diverse stem cell function [53]. In agreement with our observation where BRE-silencing promoted osteogenenic differentiation, it has been shown that HDAC9 played a crucial role in enhancing hMSCs
osteogenesis [54]. These results indicate that BRE-silencing participates in modulating the genes involved in maintaining stemness and chromatin modification.
We also observed expression of genes encoding for components of the TGF-b/BMP, and FGF signaling pathways repressed in response toBRE-silencing. These pathways work to promote self-renewal and suppress differentiation [34,35,36,37]. SMAD6, SMAD8,ID1,ID2, andID3, all of them were negatively regulated by BRE-silencing, have been shown to inhibit osteogenic differentiation in MSCs [55,56]. FGF2 has also been identified as one of the self-renewal factors which can sustain the growth of hESCs and hMSCs on a feeder-independent and serum-free condition [57,58]. Moreover, FGF9 has been implicated in promoting survival of germ cells in fetal testis and it is a highly specific ligand for FGF receptor 2 and 3 which maintain pluripotency in mouse germ cells [59,60,61]. It has been reported that FGF signaling through FGFR2 inhibits mouse osteoblast differentiation [62]. A few studies have indicated that FGF2 could also inhibit multi-lineage MSC differentiations, while other studies have suggested FGF2 was a positive regulator of MSCs differentiation [63,64,65,66]. The contradictory effects may be dependent on the developmental status of the stem cells as it was reported that FGF2 stimulates growth of immature osteoblast progenitors but induces osteogenic differentiation of more mature precursors [67]. Our study suggests that FGF signaling inhibits HUCPV cells differentiation. BRE-silencing negatively regulated genes such asFGF2,FGF9,FGFR2andFGFR3; thereby permitting HUCPV cells to differentiate into osteoblasts more rapidly when induced.
HOX transcription factors are important regulators of cell proliferation, self-renewal and differentiation in hematopoietic stem cells (HSCs) [41,43]. Overexpression studies have reported that HOXB4 could enhance mHSCs expansion and mESCs Figure 10. Comparative proteomics analysis of differentially expressed proteins in BRE silenced HUCPV cells.A representative silver stained 2-DE gel of total protein extracted from HUCPV cells that had been transfected withBRE-siRNA. When compared with control 2-DE gels, the ESI-MS/MS analysis identified proteins that were up- and down-regulated as a result of silencingBRE. Cytoskeletal binding proteins were especially affected. N = 3 independent experiments.
differentiation [68,69]. Furthermore, overexpression of HOXB4 up-regulates the transcriptional expression ofBREin mHSCs [68]. In our microarray study, however, we did not observe a significant change ofHOXB4expression in response to BRE-silencing. This observation implied that HOXB4 regulates the expression ofBRE but not vice versa. Therefore, it will be interesting to establish whether HOXB4 overexpression can up-regulate BRE expression in mesenchymal stem cells or whether the protein regulation is lineage specific.
BRE-silencing resulted in the alteration of a number of chemokines. Amongst the chemokines that were up-regulated includes,TNFSF15,TNFRSF9,GDF5andIL7. These chemokines have been implicated in their ability to promote osteogenesis of various types of progenitor cells [70,71,72,73]. Other cytokines that have been enhanced in response to BRE-silencing were TNFRSF9, IL7, IL15RA and IL21R which are up-regulated as hESCs differentiate into embryoid bodies [74]. Furthermore,
CXCL3, CXCL10 and TNFSF9, which were positively regulated by BRE-silencing, have been classified as inhibitory factors in a study of intercellular network which modulated hematopoietic stem cell fate non-autonomously [75]. Therefore, BRE-silencing modulates the expression of cytokines which provided a favorable environment for differentiation to progress.
We also employed comparative proteomics approach to elucidate all the proteins that are differentially expressed after BRE-silencing in HUCPV cells which provided valuable insight on BRE targeted post-translational proteins to complement the microarray study. Functional annotation clustering analysis revealed that BRE function was associated with the organization of the cytoskeleton.BRE-silencing resulted in decreased presence of actin, ANXA2 and other cytoskeletal binding proteins. We also demonstrated that actin and ANXA2 could be immunoprecipi-tated with BRE. ANXA2 has been shown to bind to F-actin and plays a critical role in Rho/ROCK signaling pathway [76,77]. Figure 11. Immunofluorescence staining of Actin, BRE and ANXA2 expression in BRE-silenced HUCPV cells.(A) Showing actin (green) and BRE (red) expressions were inhibited inBRE-silenced HUCPV cells compared with the control. Arrows indicate where actin and BRE were co-localized. (B) Showing ANXA2 (green) expression was down-regulated followingBRE-silencing. N = 3 independent experiments.
ANXA2 along with other actin-binding proteins are capable of regulating actin dynamics, organization and turnover in migratory cells [76,78,79,80,81,82]. Actins, together with intermediate filaments and microtubules, play an important role in cytoskeletal organization and response to external mechanical stimuli that affect cell differentiation [83,84,85]. During differentiation, the cell morphology is almost always altered in respond to integrins, cadherins and cytoskeletal proteins being differentially expressed [86]. When MSCs undergo osteogenesis, the cells become flatten and spread out; while the cells acquire a spherical shape when they undergo chondrogenesis [87,88]. It has been demonstrated when actin is disrupted by cytochalasin B (an inhibitor of actin polymerization), chondrogenesis is greatly enhanced in ESCs and MSCs. In contrast, chondrogenesis is hindered under conditions that favour actin assembly [89,90,91,92]. In our study, we demonstrated that the structural integrity of F-actin became dissembled inBRE-silenced HUCPV cells while F-actin structures were very distinctive in cells transfected with Ctl-siRNAs. The reduction of actin protein in BRE-silenced cells might provide a favourable environment for differentiation to take place, which agrees with our experimental observation that BRE-silencing accelerated chondrogenic differentiation of HUCPV cells.
Because actin and ANXA2 play a role in cell migration, we investigated the effect of BRE-silencing on cell movement. The HUCPV cells showed reduced ability to migrate after BRE -silencing. The reduction is probably associated with the down-regulation of actin protein which affected the cytoskeleton to change dynamically during movement – since migration requires a synchronized interactions of actin and its interacting partners such as actin-binding proteins and integrins [93]. ANXA2 has also been implicated in the regulation of HSC binding to osteoblasts and homing to the bone marrow niche [94]. Further studies will be required to establish whether BRE has a role in cell homing.
BRE-silencing could also suppress CALR, FUBP1 and PKM2 expression. In mESCs, down-regulation of CALR resulted in reduction of calcium ion level to enhance adipogenic differenti-ation [95]. It has also been reported that CALR may be involved in the regulation of osteogenesis and chondrogenesis in MSCs. CALR expression is reduced in the early stage of osteoblast differentiation in MC-3T3-E1 cells. Overexpression of CALR inhibits both the basal and vitamin D-induced expression of osteocalcin and calcium ion accumulation in the extracellular matrix and mineralization of bone nodules in cultures [96]. These findings may explain our observation of why BRE-silencing Figure 12.BRE-silencing alters expression of cytoskeletal binding proteins and cell migration.(A) Phalloidin staining revealed F-actin were highly aligned and structured in HUCPV cells but became diffusely distributed inBRE-silenced cells. (B) Immunoprecipitation of endogenous BRE was performed on HUCPV cell lysates using BRE monoclonal antibodies. The resultant immunoprecipitates were separated by SDS-PAGE and Western blot analysis performed using antibodies against BRE, actin and ANXA2. The results revealed that BRE can directly bind actin and ANXA2. (C) Scratch cell migration assay demonstrated thatBRE-silencing inhibited HUCPV cell migration. The dotted white lines indicate the extent of the gap created which were completely invaded by HUCPV cells in the control cultures, after 3 days. In contrast, the gap was only partially invaded inBRE-silenced cultures at day-3. N = 3 independent experiments.
resulted in enhanced osteogenic and chondrogenic differentiation in HUCPV cells.BRE-silencing also negatively regulates FUBP1 and PKM2. FUBP1 is present in undifferentiated cells but not in differentiated cells and regulates c-myc expression by binding to a single-stranded far-upstream element upstream of the c-myc promoter [97]. Previous report showed that down-regulation of FUBP1 and subsequent down-regulation of c-myc were needed for lung cell differentiation in mice [98]. This protein may act both as an activator and repressor of transcription. Likewise, PKM2 has been determined to stimulate Oct4-mediated transcriptional activation [99]. Oct4 and c-myc constitute are two of the Yamanaka transcription factors crucial for maintaining pluripo-tency of stem cells [31,100].BRE-silencing resulted in decreased expression of pluripotency factors and may explain our observa-tion of enhanced osteogenic and chondrogenic differentiaobserva-tion in HUCPV cells. Further studies are required to examine the effect of BRE-silencing on other mesenchymal lineage differentiations.
In sum, our findings suggest a multifunctional role for BRE in maintaining stemness and the cytoskeletal architecture of HUCPV cells. In addition, BRE expression can be manipulated to accelerate induced chondrogenic and osteogenic differentiation in HUCPV cells (Figure 13).
Supporting Information
Figure S1 Microarray analyses of differentially ex-pressed stemness-related genes in response to BRE -silencing.(A) Heat map displaying the patterns of differentially expressed stemness genes in response to BRE-silencing. The red boxes indicate that gene signals that are higher than the background signal (grey boxes), whereas blue boxes indicate signals that are lower than background. (B) RT-qPCR was performed to confirm the microarray data, specifically genes associated with stemness. Gene expression was normalized to GAPDH. The statistics of P values were determined by t-test; *p,0.05, **p,0.01, ***p,0.001 were considered significantly different and#contrast with microarray results.
(TIF)
Figure S2 Microarray analyses of differentially ex-pressed epigenetic-related genes in response to
BRE-silencing. (A) Heat map displaying the patterns of differentially expressed epigenetic genes in response to BRE -silencing. (B) RT-qPCR was performed to confirm the microarray data, specifically genes associated with epigenetics. Gene expres-sion was normalized to GAPDH. The statistics of P values were determined by t-test; *p,0.05, **p,0.01, ***p,0.001 were considered significantly different and #contrast with microarray results. N = 3 independent experiments.
(TIF)
Figure S3 Microarray analyses of differentially ex-pressed genes associated with TGF-b signalling in response to BRE-silencing. (A) Heat map displaying the patterns of differentially expressed genes associated with TGF-b
signalling in response to BRE-silencing. (B) RT-qPCR was performed to confirm the microarray data, specifically genes associated with TGF-b signalling. Gene expression was normal-ized to GAPDH. The statistics of P values were determined by t-test; *p,0.05, **p,0.01, ***p,0.001 were considered signifi-cantly different. N = 3 independent experiments. (C) Illustrating the cascade associated with the TGF-b signalling pathway (adapted from the KEGG database). Genes within the green boxes are significantly affected by BRE silencing while genes within the dark boxes are considered insignificantly affected. (TIF)
Figure S4 Microarray analyses of differentially ex-pressed genes associated with FGF signalling in re-sponse toBRE-silencing.(A) Heat map displaying the patterns of differentially expressed genes associated with FGF signalling in response toBRE-silencing. (B) RT-qPCR confirming the micro-array data. Gene expression was normalized to GAPDH. The statistics of P values were determined by t-test; *p,0.05, **p,0.01, ***p,0.001 were considered significantly different. N = 3 independent experiments.
(TIF)
Figure S5 Microarray analyses of differentially expressed chemokine genes in response to BRE-silencing. (A) Heat map displaying the patterns of differentially expressed chemokine genes. (B) RT-qPCR confirming the microarray data. Gene expression was normalized to GAPDH. The statistics of P values were determined by t-test; *p,0.05, **p,0.01, ***p,0.001 were considered significantly different. N = 3 independent experiments. (TIF)
Figure S6 Microarray analyses of differentially ex-pressed TNF family-related genes in response to BRE -silencing.(A) Heat map displaying the patterns of differentially expressed TNF family-related and interleukin genes. (B) RT-qPCR confirming the microarray data. Gene expression was normalized to GAPDH. The statistics of P values were determined by t-test; *p,0.05, **p,0.01, ***p,0.001 were considered significantly different. N = 3 independent experiments.
(TIF)
Figure S7 Microarray analyses of differentially ex-pressed Hox genes in response to BRE-silencing. (A) Heat map displaying the patterns of differentially expressed Hox genes. The red boxes indicate that the gene signal is 36 higher than the background signal (grey boxes); whereas blue boxes indicate the signal is lower than background.
(TIF)
Table S1 The sequences of primers used in the RT-qPCR.
(JPG) Figure 13. Propose model of BRE function in HUPVC cells.BRE is
BRE in multiple isoforms. Biochem Biophys Res Commun 288: 535–545. 3. Wang B, Hurov K, Hofmann K, Elledge SJ (2009) NBA1, a new player in the
Brca1 A complex, is required for DNA damage resistance and checkpoint control. Genes Dev 23: 729–739.
4. Gu C, Castellino A, Chan JY, Chao MV (1998) BRE: a modulator of TNF-alpha action. Faseb J 12: 1101–1108.
5. Li Q, Ching AK, Chan BC, Chow SK, Lim PL, et al. (2004) A death receptor-associated anti-apoptotic protein, BRE, inhibits mitochondrial apoptotic pathway. J Biol Chem 279: 52106–52116.
6. Cooper EM, Cutcliffe C, Kristiansen TZ, Pandey A, Pickart CM, et al. (2009) K63-specific deubiquitination by two JAMM/MPN+ complexes: BRISC-associated Brcc36 and proteasomal Poh1. Embo J 28: 621–631.
7. Patterson-Fortin J, Shao G, Bretscher H, Messick TE, Greenberg RA (2010) Differential regulation of jamm domain deubiquitinating enzyme activity within the rap80 complex. J Biol Chem.
8. Dong Y, Hakimi MA, Chen X, Kumaraswamy E, Cooch NS, et al. (2003) Regulation of BRCC, a holoenzyme complex containing BRCA1 and BRCA2, by a signalosome-like subunit and its role in DNA repair. Mol Cell 12: 1087– 1099.
9. Sobhian B, Shao G, Lilli DR, Culhane AC, Moreau LA, et al. (2007) RAP80 targets BRCA1 to specific ubiquitin structures at DNA damage sites. Science 316: 1198–1202.
10. Chan BC, Li Q, Chow SK, Ching AK, Liew CT, et al. (2005) BRE enhances in vivo growth of tumor cells. Biochem Biophys Res Commun 326: 268–273. 11. Chan BC, Ching AK, To KF, Leung JC, Chen S, et al. (2008) BRE is an
antiapoptotic protein in vivo and overexpressed in human hepatocellular carcinoma. Oncogene 27: 1208–1217.
12. Chui YL, Ching AK, Chen S, Yip FP, Rowlands DK, et al. (2010) BRE over-expression promotes growth of hepatocellular carcinoma. Biochem Biophys Res Commun 391: 1522–1525.
13. Tang MK, Wang CM, Shan SW, Chui YL, Ching AK, et al. (2006) Comparative proteomic analysis reveals a function of the novel death receptor-associated protein BRE in the regulation of prohibitin and p53 expression and proliferation. Proteomics 6: 2376–2385.
14. Sarugaser R, Lickorish D, Baksh D, Hosseini MM, Davies JE (2005) Human umbilical cord perivascular (HUCPV) cells: a source of mesenchymal progenitors. Stem Cells 23: 220–229.
15. Baksh D, Yao R, Tuan RS (2007) Comparison of proliferative and multilineage differentiation potential of human mesenchymal stem cells derived from umbilical cord and bone marrow. Stem Cells 25: 1384–1392.
16. Sarugaser R, Ennis J, Stanford WL, Davies JE (2009) Isolation, propagation, and characterization of human umbilical cord perivascular cells (HUCPVCs). Methods Mol Biol 482: 269–279.
17. Turner NJ, Jones HS, Davies JE, Canfield AE (2008) Cyclic stretch-induced TGFbeta1/Smad signaling inhibits adipogenesis in umbilical cord progenitor cells. Biochem Biophys Res Commun 377: 1147–1151.
18. Sarugaser R, Hanoun L, Keating A, Stanford WL, Davies JE (2009) Human mesenchymal stem cells self-renew and differentiate according to a deterministic hierarchy. PLoS One 4: e6498.
19. Chen X, Armstrong MA, Li G (2006) Mesenchymal stem cells in immunoreg-ulation. Immunol Cell Biol 84: 413–421.
20. Montemurro T, Andriolo G, Montelatici E, Weissmann G, Crisan M, et al. (2011) Differentiation and migration properties of human foetal umbilical cord perivascular cells: potential for lung repair. J Cell Mol Med 15: 796–808. 21. Livak KJ, Schmittgen TD (2001) Analysis of relative gene expression data using
real-time quantitative PCR and the 2(-Delta Delta C(T)) Method. Methods 25: 402–408.
22. Tang MK, Liu G, Hou Z, Chui YL, Chan JY, et al. (2009) Livers overexpressing BRE transgene are under heightened state of stress-response, as revealed by comparative proteomics. Proteomics Clin Appl 3: 1362–1370.
23. Shan SW, Tang MK, Chow PH, Maroto M, Cai DQ, et al. (2007) Induction of growth arrest and polycomb gene expression by reversine allows C2C12 cells to be reprogrammed to various differentiated cell types. Proteomics 7: 4303–4316.
(2007) Characterization of human embryonic stem cell lines by the International Stem Cell Initiative. Nat Biotechnol 25: 803–816.
26. Boyer LA, Lee TI, Cole MF, Johnstone SE, Levine SS, et al. (2005) Core transcriptional regulatory circuitry in human embryonic stem cells. Cell 122: 947–956.
27. Jaenisch R, Young R (2008) Stem cells, the molecular circuitry of pluripotency and nuclear reprogramming. Cell 132: 567–582.
28. Amleh A, Nair SJ, Sun J, Sutherland A, Hasty P, et al. (2009) Mouse cofactor of BRCA1 (Cobra1) is required for early embryogenesis. PLoS One 4: e5034. 29. Wang J, Rao S, Chu J, Shen X, Levasseur DN, et al. (2006) A protein interaction
network for pluripotency of embryonic stem cells. Nature 444: 364–368. 30. Singh SK, Kagalwala MN, Parker-Thornburg J, Adams H, Majumder S (2008)
REST maintains self-renewal and pluripotency of embryonic stem cells. Nature 453: 223–227.
31. Takahashi K, Tanabe K, Ohnuki M, Narita M, Ichisaka T, et al. (2007) Induction of pluripotent stem cells from adult human fibroblasts by defined factors. Cell 131: 861–872.
32. Jian H, Shen X, Liu I, Semenov M, He X, et al. (2006) Smad3-dependent nuclear translocation of beta-catenin is required for TGF-beta1-induced proliferation of bone marrow-derived adult human mesenchymal stem cells. Genes Dev 20: 666–674.
33. Liu Z, Tang Y, Qiu T, Cao X, Clemens TL (2006) A dishevelled-1/Smad1 interaction couples WNT and bone morphogenetic protein signaling pathways in uncommitted bone marrow stromal cells. J Biol Chem 281: 17156–17163.
34. Ying QL, Nichols J, Chambers I, Smith A (2003) BMP induction of Id proteins suppresses differentiation and sustains embryonic stem cell self-renewal in collaboration with STAT3. Cell 115: 281–292.
35. Ying QL, Wray J, Nichols J, Batlle-Morera L, Doble B, et al. (2008) The ground state of embryonic stem cell self-renewal. Nature 453: 519–523.
36. Greber B, Lehrach H, Adjaye J (2007) Fibroblast growth factor 2 modulates transforming growth factor beta signaling in mouse embryonic fibroblasts and human ESCs (hESCs) to support hESC self-renewal. Stem Cells 25: 455–464. 37. Greber B, Wu G, Bernemann C, Joo JY, Han DW, et al. (2010) Conserved and
divergent roles of FGF signaling in mouse epiblast stem cells and human embryonic stem cells. Cell Stem Cell 6: 215–226.
38. Zaragosi LE, Ailhaud G, Dani C (2006) Autocrine fibroblast growth factor 2 signaling is critical for self-renewal of human multipotent adipose-derived stem cells. Stem Cells 24: 2412–2419.
39. Levenstein ME, Ludwig TE, Xu RH, Llanas RA, VanDenHeuvel-Kramer K, et al. (2006) Basic fibroblast growth factor support of human embryonic stem cell self-renewal. Stem Cells 24: 568–574.
40. Martin I, Muraglia A, Campanile G, Cancedda R, Quarto R (1997) Fibroblast growth factor-2 supports ex vivo expansion and maintenance of osteogenic precursors from human bone marrow. Endocrinology 138: 4456–4462. 41. Bjornsson JM, Larsson N, Brun AC, Magnusson M, Andersson E, et al. (2003)
Reduced proliferative capacity of hematopoietic stem cells deficient in Hoxb3 and Hoxb4. Mol Cell Biol 23: 3872–3883.
42. Abramovich C, Humphries RK (2005) Hox regulation of normal and leukemic hematopoietic stem cells. Curr Opin Hematol 12: 210–216.
43. Brun AC, Bjornsson JM, Magnusson M, Larsson N, Leveen P, et al. (2004) Hoxb4-deficient mice undergo normal hematopoietic development but exhibit a mild proliferation defect in hematopoietic stem cells. Blood 103: 4126–4133. 44. Huang da W, Sherman BT, Lempicki RA (2009) Systematic and integrative
analysis of large gene lists using DAVID bioinformatics resources. Nat Protoc 4: 44–57.
45. Huang da W, Sherman BT, Lempicki RA (2009) Bioinformatics enrichment tools: paths toward the comprehensive functional analysis of large gene lists. Nucleic Acids Res 37: 1–13.
47. Rickard DJ, Sullivan TA, Shenker BJ, Leboy PS, Kazhdan I (1994) Induction of rapid osteoblast differentiation in rat bone marrow stromal cell cultures by dexamethasone and BMP-2. Dev Biol 161: 218–228.
48. Butteroni C, De Felici M, Scholer HR, Pesce M (2000) Phage display screening reveals an association between germline-specific transcription factor Oct-4 and multiple cellular proteins. J Mol Biol 304: 529–540.
49. Fehling HJ, Lacaud G, Kubo A, Kennedy M, Robertson S, et al. (2003) Tracking mesoderm induction and its specification to the hemangioblast during embryonic stem cell differentiation. Development 130: 4217–4227.
50. Tesar PJ, Chenoweth JG, Brook FA, Davies TJ, Evans EP, et al. (2007) New cell lines from mouse epiblast share defining features with human embryonic stem cells. Nature 448: 196–199.
51. Mansergh FC, Daly CS, Hurley AL, Wride MA, Hunter SM, et al. (2009) Gene expression profiles during early differentiation of mouse embryonic stem cells. BMC Dev Biol 9: 5.
52. Zhang X, Yalcin S, Lee DF, Yeh TY, Lee SM, et al. (2011) FOXO1 is an essential regulator of pluripotency in human embryonic stem cells. Nat Cell Biol 13: 1092–1099.
53. Gallinari P, Di Marco S, Jones P, Pallaoro M, Steinkuhler C (2007) HDACs, histone deacetylation and gene transcription: from molecular biology to cancer therapeutics. Cell Res 17: 195–211.
54. Chen YH, Yeh FL, Yeh SP, Ma HT, Hung SC, et al. (2011) Myocyte enhancer factor-2 interacting transcriptional repressor (MITR) is a switch that promotes osteogenesis and inhibits adipogenesis of mesenchymal stem cells by inactivating peroxisome proliferator-activated receptor gamma-2. J Biol Chem 286: 10671– 10680.
55. Peng Y, Kang Q, Luo Q, Jiang W, Si W, et al. (2004) Inhibitor of DNA binding/ differentiation helix-loop-helix proteins mediate bone morphogenetic protein-induced osteoblast differentiation of mesenchymal stem cells. J Biol Chem 279: 32941–32949.
56. Maeda S, Hayashi M, Komiya S, Imamura T, Miyazono K (2004) Endogenous TGF-beta signaling suppresses maturation of osteoblastic mesenchymal cells. Embo J 23: 552–563.
57. Ludwig TE, Levenstein ME, Jones JM, Berggren WT, Mitchen ER, et al. (2006) Derivation of human embryonic stem cells in defined conditions. Nat Biotechnol 24: 185–187.
58. Ng F, Boucher S, Koh S, Sastry KS, Chase L, et al. (2008) PDGF, TGF-beta, and FGF signaling is important for differentiation and growth of mesenchymal stem cells (MSCs): transcriptional profiling can identify markers and signaling pathways important in differentiation of MSCs into adipogenic, chondrogenic, and osteogenic lineages. Blood 112: 295–307.
59. Hecht D, Zimmerman N, Bedford M, Avivi A, Yayon A (1995) Identification of fibroblast growth factor 9 (FGF9) as a high affinity, heparin dependent ligand for FGF receptors 3 and 2 but not for FGF receptors 1 and 4. Growth Factors 12: 223–233.
60. DiNapoli L, Batchvarov J, Capel B (2006) FGF9 promotes survival of germ cells in the fetal testis. Development 133: 1519–1527.
61. Bowles J, Feng CW, Spiller C, Davidson TL, Jackson A, et al. (2010) FGF9 suppresses meiosis and promotes male germ cell fate in mice. Dev Cell 19: 440– 449.
62. Mansukhani A, Ambrosetti D, Holmes G, Cornivelli L, Basilico C (2005) Sox2 induction by FGF and FGFR2 activating mutations inhibits Wnt signaling and osteoblast differentiation. J Cell Biol 168: 1065–1076.
63. Tsutsumi S, Shimazu A, Miyazaki K, Pan H, Koike C, et al. (2001) Retention of multilineage differentiation potential of mesenchymal cells during proliferation in response to FGF. Biochem Biophys Res Commun 288: 413–419. 64. Baddoo M, Hill K, Wilkinson R, Gaupp D, Hughes C, et al. (2003)
Characterization of mesenchymal stem cells isolated from murine bone marrow by negative selection. J Cell Biochem 89: 1235–1249.
65. Lai WT, Krishnappa V, Phinney DG (2011) Fibroblast growth factor 2 (Fgf2) inhibits differentiation of mesenchymal stem cells by inducing Twist2 and Spry4, blocking extracellular regulated kinase activation, and altering Fgf receptor expression levels. Stem Cells 29: 1102–1111.
66. Solchaga LA, Penick K, Porter JD, Goldberg VM, Caplan AI, et al. (2005) FGF-2 enhances the mitotic and chondrogenic potentials of human adult bone marrow-derived mesenchymal stem cells. J Cell Physiol 203: 398–409. 67. Debiais F, Hott M, Graulet AM, Marie PJ (1998) The effects of fibroblast growth
factor-2 on human neonatal calvaria osteoblastic cells are differentiation stage specific. J Bone Miner Res 13: 645–654.
68. Schiedlmeier B, Santos AC, Ribeiro A, Moncaut N, Lesinski D, et al. (2007) HOXB4’s road map to stem cell expansion. Proc Natl Acad Sci USA 104: 16952–16957.
69. Jackson M, Axton RA, Taylor AH, Wilson JA, Gordon-Keylock SA, et al. (2012) HOXB4 can enhance the differentiation of embryonic stem cells by modulating the hematopoietic niche. Stem Cells 30: 150–160.
70. Morsczeck C, Schmalz G, Reichert TE, Vollner F, Saugspier M, et al. (2009) Gene expression profiles of dental follicle cells before and after osteogenic differentiation in vitro. Clin Oral Investig 13: 383–391.
71. Trubiani O, Isgro A, Zini N, Antonucci I, Aiuti F, et al. (2008) Functional interleukin-7/interleukin-7Ralpha, and SDF-1alpha/CXCR4 are expressed by human periodontal ligament derived mesenchymal stem cells. J Cell Physiol 214: 706–713.
72. Azzi S, Bruno S, Giron-Michel J, Clay D, Devocelle A, et al. (2011) Differentiation therapy: targeting human renal cancer stem cells with interleukin 15. J Natl Cancer Inst 103: 1884–1898.
73. Shimaoka H, Dohi Y, Ohgushi H, Ikeuchi M, Okamoto M, et al. (2004) Recombinant growth/differentiation factor-5 (GDF-5) stimulates osteogenic differentiation of marrow mesenchymal stem cells in porous hydroxyapatite ceramic. J Biomed Mater Res A 68: 168–176.
74. Yang AX, Mejido J, Luo Y, Zeng X, Schwartz C, et al. (2005) Development of a focused microarray to assess human embryonic stem cell differentiation. Stem Cells Dev 14: 270–284.
75. Kirouac DC, Ito C, Csaszar E, Roch A, Yu M, et al. (2010) Dynamic interaction networks in a hierarchically organized tissue. Mol Syst Biol 6: 417.
76. Hayes MJ, Shao D, Bailly M, Moss SE (2006) Regulation of actin dynamics by annexin 2. Embo J 25: 1816–1826.
77. Rescher U, Ludwig C, Konietzko V, Kharitonenkov A, Gerke V (2008) Tyrosine phosphorylation of annexin A2 regulates Rho-mediated actin rearrangement and cell adhesion. J Cell Sci 121: 2177–2185.
78. Machesky LM, Reeves E, Wientjes F, Mattheyse FJ, Grogan A, et al. (1997) Mammalian actin-related protein 2/3 complex localizes to regions of lamellipodial protrusion and is composed of evolutionarily conserved proteins. Biochem J 328: 105–112.
79. Rottner K, Krause M, Gimona M, Small JV, Wehland J (2001) Zyxin is not colocalized with vasodilator-stimulated phosphoprotein (VASP) at lamellipodial tips and exhibits different dynamics to vinculin, paxillin, and VASP in focal adhesions. Mol Biol Cell 12: 3103–3113.
80. Walsh TP, Clarke FM, Masters CJ (1977) Modification of the kinetic parameters of aldolase on binding to the actin-containing filaments of skeletal muscle. Biochem J 165: 165–167.
81. Yao X, Cheng L, Forte JG (1996) Biochemical characterization of ezrin-actin interaction. J Biol Chem 271: 7224–7229.
82. Edwards KA, Demsky M, Montague RA, Weymouth N, Kiehart DP (1997) GFP-moesin illuminates actin cytoskeleton dynamics in living tissue and demonstrates cell shape changes during morphogenesis in Drosophila. Dev Biol
191: 103–117.
83. Hayakawa K, Sato N, Obinata T (2001) Dynamic reorientation of cultured cells and stress fibers under mechanical stress from periodic stretching. Exp Cell Res 268: 104–114.
84. Spiegelman BM, Farmer SR (1982) Decreases in tubulin and actin gene expression prior to morphological differentiation of 3T3 adipocytes. Cell 29: 53– 60.
85. Spiegelman BM, Ginty CA (1983) Fibronectin modulation of cell shape and lipogenic gene expression in 3T3-adipocytes. Cell 35: 657–666.
86. Gumbiner BM (1996) Cell adhesion: the molecular basis of tissue architecture and morphogenesis. Cell 84: 345–357.
87. Daniels K, Solursh M (1991) Modulation of chondrogenesis by the cytoskeleton and extracellular matrix. J Cell Sci 100: 249–254.
88. Grigoriadis AE, Heersche JN, Aubin JE (1988) Differentiation of muscle, fat, cartilage, and bone from progenitor cells present in a bone-derived clonal cell population: effect of dexamethasone. J Cell Biol 106: 2139–2151.
89. Lim YB, Kang SS, Park TK, Lee YS, Chun JS, et al. (2000) Disruption of actin cytoskeleton induces chondrogenesis of mesenchymal cells by activating protein kinase C-alpha signaling. Biochem Biophys Res Commun 273: 609–613. 90. Solursh M (1989) Cartilage stem cells: regulation of differentiation. Connect
Tissue Res 20: 81–89.
91. Zhang Z, Messana J, Hwang NS, Elisseeff JH (2006) Reorganization of actin filaments enhances chondrogenic differentiation of cells derived from murine embryonic stem cells. Biochem Biophys Res Commun 348: 421–427. 92. Yourek G, Hussain MA, Mao JJ (2007) Cytoskeletal changes of mesenchymal
stem cells during differentiation. ASAIO J 53: 219–228.
93. Webb DJ, Parsons JT, Horwitz AF (2002) Adhesion assembly, disassembly and turnover in migrating cells – over and over and over again. Nat Cell Biol 4: E97– 100.
94. Jung Y, Wang J, Song J, Shiozawa Y, Havens A, et al. (2007) Annexin II expressed by osteoblasts and endothelial cells regulates stem cell adhesion, homing, and engraftment following transplantation. Blood 110: 82–90. 95. Szabo E, Qiu Y, Baksh S, Michalak M, Opas M (2008) Calreticulin inhibits
commitment to adipocyte differentiation. J Cell Biol 182: 103–116.
96. St-Arnaud R, Prud’homme J, Leung-Hagesteijn C, Dedhar S (1995) Constitutive expression of calreticulin in osteoblasts inhibits mineralization. J Cell Biol 131: 1351–1359.
97. Duncan R, Bazar L, Michelotti G, Tomonaga T, Krutzsch H, et al. (1994) A sequence-specific, single-strand binding protein activates the far upstream element of c-myc and defines a new DNA-binding motif. Genes Dev 8: 465–480. 98. Kim MJ, Park BJ, Kang YS, Kim HJ, Park JH, et al. (2003) Downregulation of FUSE-binding protein and c-myc by tRNA synthetase cofactor p38 is required for lung cell differentiation. Nat Genet 34: 330–336.
99. Lee J, Kim HK, Han YM, Kim J (2008) Pyruvate kinase isozyme type M2 (PKM2) interacts and cooperates with Oct-4 in regulating transcription. Int J Biochem Cell Biol 40: 1043–1054.