Selection and Assessment of Reference Genes for
Quantitative PCR Normalization in Migratory Locust
Locusta migratoria
(Orthoptera: Acrididae)
Qingpo Yang1, Zhen Li1, Jinjun Cao1, Songdou Zhang1, Huaijiang Zhang1, Xiaoyun Wu1,2, Qingwen Zhang1, Xiaoxia Liu1*
1Department of Entomology, China Agricultural University, Beijing, China,2Department of Horticulture, Beijing Vocational College of Agriculture, Beijing, China
Abstract
Locusta migratoria is a classic hemimetamorphosis insect and has caused widespread economic damage to crops as a
migratory pest. Researches on the expression pattern of functional genes inL. migratoriahave drawn focus in recent years, especially with the release of genome information. Real-time quantitative PCR is the most reproducible and sensitive approach for detecting transcript expression levels of target genes, but optimal internal standards are key factors for its accuracy and reliability. Therefore, it’s necessary to provide a systematic stability assessment of internal control for well-performed tests of target gene expression profile. In this study, twelve candidate genes (Ach,Act,Cht2,EF1a,RPL32,Hsp70,
Tub, RP49, SDH, GAPDH, 18S, and His) were analyzed with four statistical methods: the delta Ct approach, geNorm,
Bestkeeper and NormFinder. The results from these analyses aimed to choose the best suitable reference gene across different experimental situations for gene profile study in L. migratoria. The result demonstrated that for different developmental stages,EF1a,Hsp70andRPL32exhibited the most stable expression status for all samples;EF1aandRPL32 were selected as the best reference genes for studies involving embryo and larvae stages, whileSDH and RP49 were identified for adult stage. The best-ranked reference genes across different tissues areRPL32,Hsp70andRP49. For abiotic treatments, the most appropriate genes we identified were as follows: Act and SDH for larvae subjected to different insecticides;RPL32andAchfor larvae exposed to different temperature treatments; andActand Achfor larvae suffering from starvation. The present report should facilitate future researches on gene expression inL. migratoriawith accessibly optimal reference genes under different experimental contexts.
Citation:Yang Q, Li Z, Cao J, Zhang S, Zhang H, et al. (2014) Selection and Assessment of Reference Genes for Quantitative PCR Normalization in Migratory Locust
Locusta migratoria(Orthoptera: Acrididae). PLoS ONE 9(6): e98164. doi:10.1371/journal.pone.0098164
Editor:Kenneth So¨derha¨ll, Uppsala University, Sweden
ReceivedJanuary 22, 2014;AcceptedApril 29, 2014;PublishedJune 2, 2014
Copyright:ß2014 Yang et al. This is an open-access article distributed under the terms of the Creative Commons Attribution License, which permits
unrestricted use, distribution, and reproduction in any medium, provided the original author and source are credited.
Funding:This study was supported by grants from the National ‘‘973’’ Project (No. 2012CB114103). The funders had no role in study design, data collection and analysis, decision to publish, or preparation of the manuscript.
Competing Interests:The authors have declared that no competing interests exist. * E-mail: [email protected]
Introduction
In biological research, the fluorescence-based quantitative real-time reverse transcriptase PCR (qPCR) is the most reproducible and sensitive approach for gene expression analysis and has been widely used to measure and compare levels of gene transcription [1–3]. Although the technique of qPCR is usually described as the gold standard, the quality of results is influenced by several variables, including RNA stability, quantity, purity, reverse transcription efficiency and PCR efficiency [4,5]. To avoid bias, a number of strategies have been proposed for normalization in previous studies [6], including sampling similar tissue weight or volume to ensure similar sample size [6], targeting genomic DNA [7] and using an ‘artificial’ RNA molecule [4]. The strategy based on sample size may be straightforward, but it may not be biologically representative because that different samples may not contain the same cellular material [6]. The method based on genomic DNA is rarely used, as the copy number per cell may vary and DNA is usually eliminated during the RNA extraction procedures. The normalization approach using an artificial molecule remains an unvalidated theoretical ideal. Therefore,
the most suitable method for mRNA quantification is to include internal standards, which are mainly housekeeping genes.
The transcription levels of these widely used housekeeping genes, including b-actin, 18S ribosomal RNA (18S rRNA), elongation factor 1-a (EF1a) and glyceraldehyde-3-phosphate dehydrogenase (GAPDH) [8,9] had been assumed to have uniform levels of expression that are unaffected by experimental conditions since these genes are necessary in fundamental cellular processes [10]. These genes have been used as single normalizers for many years. However, the expression of some commonly used reference genes could vary extensively and were unstable under a range of experimental conditions, which has been shown by several studies [11–18]. Furthermore, the mRNA transcript levels can differ from actual expression even up to 20-fold if the normalization gene is regulated by the experimental conditions [19–21]. Therefore, it’s a key point to assure the expression of internal reference genes occur at a constant level. The endogenous control genes should be validated in different organism and for each specific experiment [10,22–27].
The migratory locust Locusta migratoria is the most common locust subspecies that is widely distributed in eastern and southern Asia including China, Cambodia, Indonesia, Japan Thailand [28]. As a phytophagous insect, this pest feeds on gramineous and bulrush plants, and causes widespread economic damage to crops. Additionally, destructive outbreaks of locust is periodic [29]. In recent years, with the development of molecular technology and the release of the whole genome information ofL. migratoria, qPCR has been widely used for study on phase changes [30] and gene expression inL. migratoria[31]. The systemic assessment of suitable internal control genes has been reported in several model insects such as Bombyx mori [32], Apis mellifera [33,34], and Tribolium castaneaum[35]. For locusts, the initial several reference genes were validated for the brains of Schistocerca gregaria [36]. And then reference genes for locust were evaluated forChortoicetes terminifera reared under different density treatments [37] and L. migratoria under hypobaric hypoxia stress [38]. There is no experimental data available on a systematic selection and assessment of reference genes inL. migratoria for gene profile analyses covering the commonly involved biotic and abiotic experimental contexts. In this report, we analyzed the performance of twelve normalization genes (Ach, Act, Hsp70, 18S, EF1a, SDH, RPL32, His,Cht2,GAPDH,Tub, andRP49) forL. migratoriain a set of biotic factors (embryo stage, larvae stage, adult stage and 13 tissues) and under three abiotic stresses (insecticide, temperature and starva-tion). This work will provide benefits for identifying normalization genes in future gene expression studies inL. migratoria, saving time and expense in selecting reference genes.
Materials and Methods
Ethics Statement
For this study, there were no specific permits being required for the insect collected. The eggs of L. migratoria were originally collected from Cangzhou (38u139120N 116u599240E), Hebei Province, China. No endangered or protected species were involved in the field studies. The ‘‘List of Protected Animals in China’’ does not contain the migratory locust Locusta migratoria (Orthoptera: Acrididae) which are common insect.
Insect Rearing
The egg pods ofL. migratoriawere incubated in wet sand in an environmental chamber (Ningbo, China) at 3061uC with a 14 h:10 h (L: D) photoperiod and 55% humidity. Grasshoppers were transferred to the laboratory after hatching and fed with fresh wheat seedlings, crop leaves and bran [30]. Pots filled with slightly moistened sterile sand were prepared for mature females to deposit their eggs. After oviposition, the egg pods were collected every day and incubated in an environmental chamber as described as above.
Biotic factors
Embryo. The eggs were collected from the fourth day after oviposition until the thirteenth day. Embryo was dissected from eggs in PBS solution (10 mmol Na2HPO4, 2 mmol/L KH2PO4,
137 mmol/L NaCl, 2.7 mmol/L KCl, pH 7.4) on ice.
Larvae and adult. Samples used in the study comprised 10 first-instar nymphs, 8 second-instar nymphs, 5 third-instar nymphs, 3 fourth-instar nymphs, 2 fifth-instar nymphs, 1 male and female adults (collected at the first day and the tenth day after emergence) for each replication.
Tissue. Thirteen tissues and organs were obtained from adults using a dissection needle in ice-cold PBS solution [39]. Tissues included brain, antenna, wings, fore legs, middle legs, hind
legs, Malpighian tube, ovary, testis, midgut, epidermis, hemo-lymph and fat body.
All the samples were kept in280uC after snap frozen in liquid nitrogen for subsequent RNA extraction. We prepared three biological replications for every sample.
Abiotic Stresses
Insecticide-induced stress. Four insecticides, chlorpyrifos, cyhalothrin, acetamiprid, and chlorantraniliprole, were used in this study. These are commonly used insecticides in Orthoptera pest management programs. The method for insecticide bioassay was the leaf-dip bioassay. Crop discs (3 cm diameter) were dipped for 10 sec in distilled water solutions of formulated insecticide with 0.1% Triton X-100 and air-dried at 25uC for 3 h according to the leaf-dip bioassay [40] which was usually used for insecticide bioassay. The discs were then placed inside transparent plastic cups (6.5 cm65.0 cm65.5 cm) covered with clean gauze. For
each replication, ten third-instar larvae that had been starved for 6 h were placed in the cup with four discs inside, and three replications were conducted. Five different concentrations were tested for each pesticide. For the controls, the crop discs were dipped in distilled water containing only 0.1% Triton X-100. Other treatments were the same as described above.
The larvae fed on treated crop discs were then reared under normal conditions. After 48 h, we checked for mortality. Mortality data from insecticide bioassays were analyzed for LC15(sublethal
dose) values and the SPSS program 17.0 was used to calculate their 95% confidence intervals based on probit analysis ( Ta-ble S1). Third-instar nymphs were subjected to each insecticide with LC15values derived from the toxicity test above. After 48 h
rearing under routine conditions, five surviving nymphs were used for RNA extraction as one replication.
Temperature-induced stress. Third-instar larvae were transferred directly into thin glass test tubes (2 cm68 cm) covered
by gauze from their rearing conditions (30uC, 14L:12D) for incubation under series of temperatures (0uC, 15uC, 30uC, 36uC, 40uC) for 2 h [41]. For the 0uC incubation, the glass tubes were placed in an ice water mixture. For temperature treatments, five nymphs were used for RNA extraction as one replication.
Starvation treatment. Third-instar locust nymphs were placed in glass test tubes without food for 6 h and 12 h. Five nymphs were assembled for RNA extraction as one replication.
Total RNA Extraction and cDNA Synthesis
The RNeasy Mini Kit (QIAGEN, Germany) was used to extract total RNA from treated samples following the manufacturer’s instructions. DNase I (RNase-Free DNase set, QIAGEN, Germany) was used to eliminate DNA contamination according to the recommended procedures. A spectrophotometer (Nano-Drop-2000, Thermo Scientific) were used to measure the purity and concentration of total RNA for A260/A280 and A260/A230. The integrity of all RNA samples was then verified immediately via agarose gel electrophoresis. If an 18S band was clearly observed, the RNA samples were considered intact. It could not be identified for the band corresponding to 28S RNA because of the ‘hidden break’ present in insects [42]. M-MLV Reverse Tran-scriptase (Promega, USA) were used to synthesize complementary DNA (cDNA) from 2mg of total RNA with Oligo(dT) 18 primer.
Candidate reference genes selection
Twelve housekeeping genes were selected from previous studies inL. migratoriaand the LocustDB (http://locustdb.genomics.org. cn/). These genes have been selected as reference genes for normalization factors in L. migratoria include EF1a (elongation
Selection and Assessment of Reference Genes inLocusta migratoria
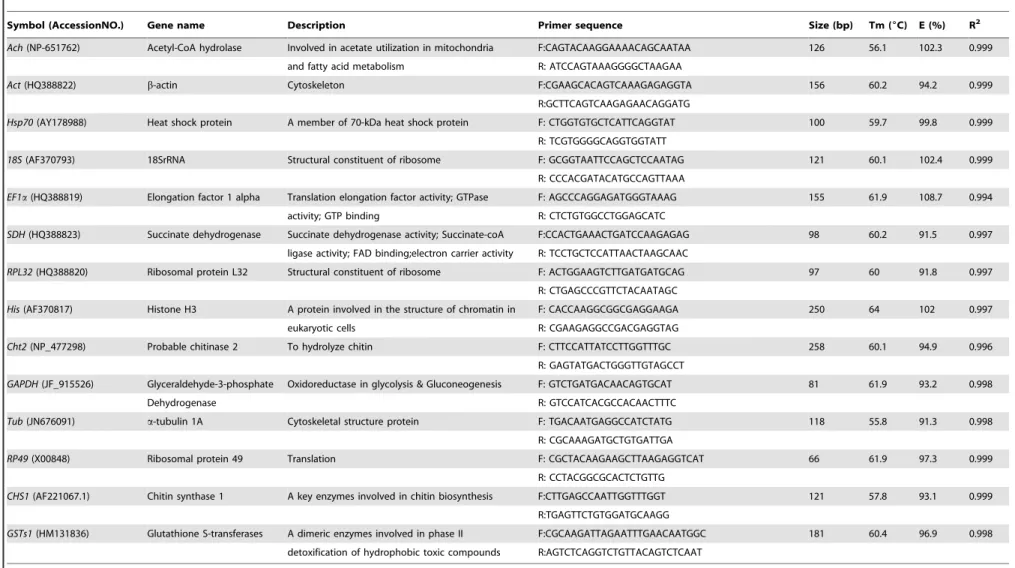
factor 1 alpha), RPL32 (ribosomal protein L32), SDH (succinate dehydrogenase) [37], His (histone H3) [43], Hsp70 (heat shock protein) [44], Cht2 (probable chitinase 2), Ach (acetyl-CoA hydrolase), 18S(18S rRNA) [38], RP49 (ribosomal protein 49), Tub (a-tubulin 1A),Act(b-actin), andGAPDH (glyceraldehyde-3-phosphate dehydrogenase) [36]. The Primer Premier 5 software (http://www.PremierBiosoft.com/primerdesign/primerdesign. html) was used to design the primers. The parameters in Primer 5 were setting as follows: amplicon length 80–250 bp, melting temperature 58–62uC, primer lengths 15–28 bp, and GC content 40–60% (Table 1).
Quantitative Real time PCR analysis
An Applied Biosystems 7500 Real-Time PCR System (Applied Biosystems, USA) were used to perform Quantitative Real time PCR (qPCR) experiments in 96-wells reaction plates using SYBR Premix Ex Taq II (Takara, Japan). Each reaction was run in a 20mL volume reaction [10mL 26SYBR Premix Ex Taq II (Tli
RNaseH Plus), 0.4mL ROX Reference Dye II, 6mL nuclease-free water, 0.8mL each primer and 2mL diluted cDNA]. The reaction program was as follows: 95uC 30 s, followed by 40 cycles (95uC for 5 s, 55uC for 30 s and 72uC for 30 s). At the end of each PCR run, a dissociation protocol (melting curve analysis) was applied to all reactions. Each sample was prepared three technical and biological replicates. To estimate amplification efficiency and correlation coefficient (R2) of each primer pairs, a range of series dilution of cDNA (10n-fold) was used to create the five-point standard curve. The equation (E = [10(1/-slope)-1] 6100%) was used to calculate the qPCR efficiency for each primer [45].
Validation of housekeeping gene selection
To assess the validity of selected internal control genes, the transcription level of the chitin synthase 1 gene (CHS1) was estimated for different development stages. We compared the mRNA transcript level of CHS1 when using only one reference gene [the best (NF1) and the worst gene (NF12)] and two most
stable reference genes (NF1–2) recommended by RefFinder.
Expression levels of a detoxification-related gene (GSTs1) were picked to evaluate the validity of selected reference genes in four tissues (midgut, Malpighian tube, fat body and spermary) and the third-instar larvae subjected to four insecticides. For the tissues, the expression profiles of the geneGSTs1 were estimated using one reference gene [the most (NF1) and the least stable reference gene
(NF12)] and several stable reference genes (NF1–2, NF1–3, NF1–5)
together recommend by RefFinder. For the insecticide treatment, the method to evaluate the expression ofGSTs1was same as the gene CHS1 in different development stages. When normalizing using more than one internal reference gene, the geometric mean calculated from the cycle threshold values of the included housekeeping genes was used as the normalization factors (NF1–n), and the algorithm (22
DDCt
) was used to calculate the transcription level of the interested gene. The effect of house-keeping gene selection and usage on the evaluation of interested gene expressions was assessed between those normalized by the least stable reference gene and the recommended combination of reference genes with the highest stability value. T-test was conducted for statistical analysis with software SPSS (ver. 17.0).
Statistical Analysis
The expression stability of twelve selected internal control genes was evaluated with the delta Ct methods, geNorm v. 3.5 [45], Bestkeeper [46] and NormFinder [47]. At the same time, RefFinder, a comprehensive tool (http://www.leonxie.com/ referencegene.php), was adopted to assess and rank the selected
housekeeping genes. This tool assigned an appropriate weight to an individual gene and calculated the geometric mean of their weights for the overall final ranking according to the results from each program. Raw Ct values were used for Bestkeeper and RefFinder. For the NormFinder and geNorm software programs, Ct values should be transformed to linear scale expression quantities.
Results
The Quality of Total RNA
In this study, the ratio A260/A280 of total RNA obtained from all samples ranged from 1.90 to 2.10 and A260/230 was above 1.90, indicating that all total RNA were adequately free from organic salts and protein contamination. The concentration of total RNA varied from 800 ng/ml to 2000 ng/ml, which was appropriate for synthesizing cDNA template.
PCR Amplification Efficiencies
For each set of the primer pairs, firstly, twelve candidate reference genes and two target genes were checked by normal PCR which produced a single amplicon with expected size. Then the dissociation curve derived from qPCR with single-peak confirmed the unique amplification and no primer dimer formation. Standard curve method was adopted to calculate the amplification efficiency of each primer pairs with cDNA isolated from third-instar nymphs in ten-fold serial dilution. The PCR efficiency of all the primer pairs ranked from 91.3% (Tub) to 108.7% (EF1a). The correlation coefficients R2ranged from 0.994 to 0.999 (Table 1).
Expression Profiles of Selected Reference Genes
The cycle threshold (Ct) values were adopted to compare the transcript abundance of the selected genes in different samples, assuming equal Ct on behalf of identical transcript amount, since an equal quantity of total RNA were performed in all qPCR reactions. The mean Ct values of the twelve reference genes varied from 11.96 to 25.35, with the lowest and highest Ct values obtained from18S(Ct 8.45) andSDH(Ct 33.94) (Figure 1).18S andEF1ashowed the most abundant expression levels followed by Hsp70 (mean Ct 20.11),Act (mean Ct 20.47),RPL32 (mean Ct 20.81), Tub (mean Ct 21.11), RP49 (mean Ct 21.72), GAPDH (mean Ct 22.05) and His (mean Ct 22.97). The moderately abundant transcripts were the two target genes and remaining three reference genes, which had a Ct value of 23 or higher. Figure 1 also showed that the gene 18S displayed the lowest dispersion (6.3 cycles) followed byRPL32(8.7 cycles). The geneHis exhibited highest dispersion over all samples indicated by largest whiskers of the box.
Figure 2revealed the distribution of relative expression level of the selected genes across different samples. For the biotic factors, RPL32showed a more constant expression level among samples of different development stages than other candidate genes. The transcript level ofSDHwas also relatively constant in larvae and adult stages. The transcript levels ofHisandCht2were more stable in different tissues than other reference genes. For abiotic factors, the expression level of Ach was relatively constant in the third-instar larvae under temperature and starvation stress, while the transcript levels of SDH and Tub were more constant after insecticide treatment. These results revealed that there was not one reference gene suitable for all biological samples and experimental treatments.
Selection and Assessment of Reference Genes inLocusta migratoria
Table 1.Details of twelve candidate reference genes used for real-time PCR.
Symbol (AccessionNO.) Gene name Description Primer sequence Size (bp) Tm (6C) E (%) R2
Ach(NP-651762) Acetyl-CoA hydrolase Involved in acetate utilization in mitochondria F:CAGTACAAGGAAAACAGCAATAA 126 56.1 102.3 0.999
and fatty acid metabolism R: ATCCAGTAAAGGGGCTAAGAA
Act(HQ388822) b-actin Cytoskeleton F:CGAAGCACAGTCAAAGAGAGGTA 156 60.2 94.2 0.999
R:GCTTCAGTCAAGAGAACAGGATG
Hsp70(AY178988) Heat shock protein A member of 70-kDa heat shock protein F: CTGGTGTGCTCATTCAGGTAT 100 59.7 99.8 0.999
R: TCGTGGGGCAGGTGGTATT
18S(AF370793) 18SrRNA Structural constituent of ribosome F: GCGGTAATTCCAGCTCCAATAG 121 60.1 102.4 0.999
R: CCCACGATACATGCCAGTTAAA
EF1a(HQ388819) Elongation factor 1 alpha Translation elongation factor activity; GTPase F: AGCCCAGGAGATGGGTAAAG 155 61.9 108.7 0.994
activity; GTP binding R: CTCTGTGGCCTGGAGCATC
SDH(HQ388823) Succinate dehydrogenase Succinate dehydrogenase activity; Succinate-coA F:CCACTGAAACTGATCCAAGAGAG 98 60.2 91.5 0.997
ligase activity; FAD binding;electron carrier activity R: TCCTGCTCCATTAACTAAGCAAC
RPL32(HQ388820) Ribosomal protein L32 Structural constituent of ribosome F: ACTGGAAGTCTTGATGATGCAG 97 60 91.8 0.997
R: CTGAGCCCGTTCTACAATAGC
His(AF370817) Histone H3 A protein involved in the structure of chromatin in F: CACCAAGGCGGCGAGGAAGA 250 64 102 0.997
eukaryotic cells R: CGAAGAGGCCGACGAGGTAG
Cht2(NP_477298) Probable chitinase 2 To hydrolyze chitin F: CTTCCATTATCCTTGGTTTGC 258 60.1 94.9 0.996
R: GAGTATGACTGGGTTGTAGCCT
GAPDH(JF_915526) Glyceraldehyde-3-phosphate Oxidoreductase in glycolysis & Gluconeogenesis F: GTCTGATGACAACAGTGCAT 81 61.9 93.2 0.998
Dehydrogenase R: GTCCATCACGCCACAACTTTC
Tub(JN676091) a-tubulin 1A Cytoskeletal structure protein F: TGACAATGAGGCCATCTATG 118 55.8 91.3 0.998
R: CGCAAAGATGCTGTGATTGA
RP49(X00848) Ribosomal protein 49 Translation F: CGCTACAAGAAGCTTAAGAGGTCAT 66 61.9 97.3 0.999
R: CCTACGGCGCACTCTGTTG
CHS1(AF221067.1) Chitin synthase 1 A key enzymes involved in chitin biosynthesis F:CTTGAGCCAATTGGTTTGGT 121 57.8 93.1 0.999
R:TGAGTTCTGTGGATGCAAGG
GSTs1(HM131836) Glutathione S-transferases A dimeric enzymes involved in phase II F:CGCAAGATTAGAATTTGAACAATGGC 181 60.4 96.9 0.998
detoxification of hydrophobic toxic compounds R:AGTCTCAGGTCTGTTACAGTCTCAAT
Size: size of amplicon length; Tm: melt temperature; E: PCR efficiency; R2: coefficient of determination.
doi:10.1371/journal.pone.0098164.t001
Selection
and
Assessment
of
Reference
Genes
in
Locusta
migratoria
PLOS
ONE
|
www.ploson
e.org
4
June
2014
|
Volume
9
|
Issue
6
|
Expression Stability of Selected Reference Genes
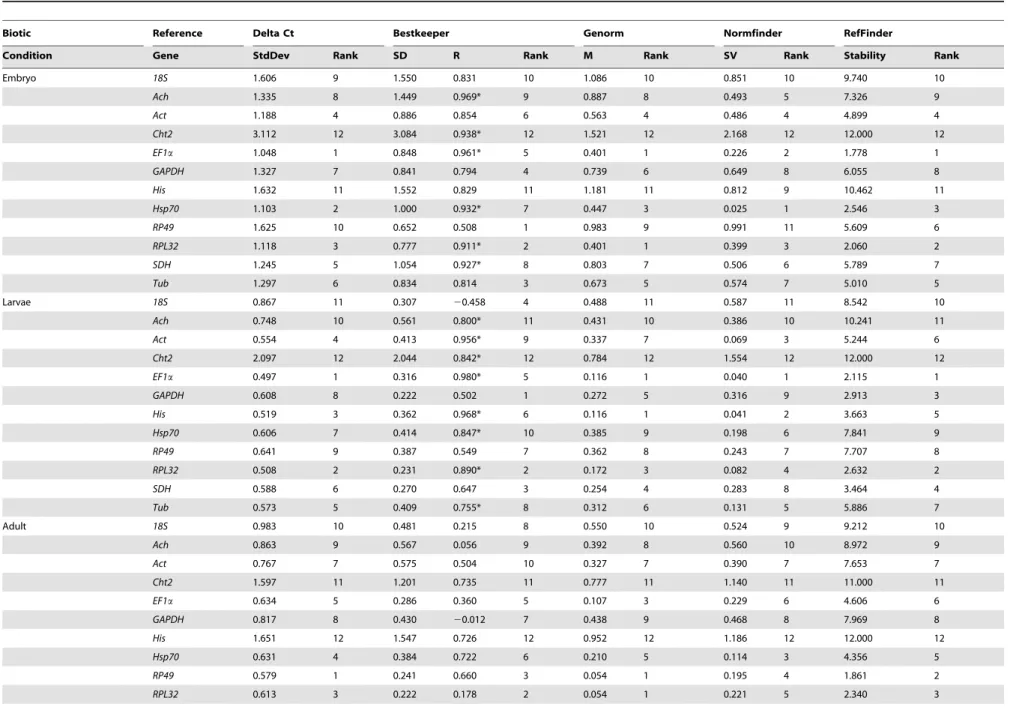
Biotic Factors. For embryo study, the overall ranking order of the best-suited reference genes generated by all the programs, except for Bestkeeper, were coherent, though the stability rankings fluctuated among separated analyses to some extent. Three methods (geNorm, NormFinder, and delta Ct methods) identified the top four ranked genes as RPL32, Hsp70, EF1a and Act for embryo, while Bestkeeper allocated RP49, RPL32, Tub and GAPDH as the four best-suited genes (Figure 3, Table 2). Interestingly, RPL32 was predicated stable by all software packages and EF1a by three programs. Our results displayed Cht2 as the least stable gene for embryo. RefFinder analysis showed the most stable genes were ranked as follows:Cht2,His ,18S,Ach,GAPDH,SDH,Rp49,Tub,Act,Hsp70, RPL32 , EF1a (Table 2). According to the analysis of the pairwise variation, the V2/3-value was below the default value
(0.15) (Figure 4). This indicated that the addition of a third gene didn’t have great effect on normalization process. Therefore, two reference genes were appropriate to normalize gene expression.
For Larvae analysis, the rankings of the best-suited reference genes obtained by the delta Ct approach and geNorm were similar. Additionally, the top two ranked genes identified by geNorm were the same as those generated by NormFinder. The result from Bestkeeper was different from those generated by four other methods. Namely, the delta Ct method and other two programs rankedEF1aas the most stable gene, whileGAPDHwas ranked in the top position according to Bestkeeper (Table 2).Cht2 appeared as the least stable gene for Larvae. RefFinder analysis showed the most stable genes were ranked as follows:Cht2,Ach ,18S,Hsp70,RP49,Tub,Act,His,SDH,GAPDH, RPL32 , EF1a (Table 2). According to the analysis of the pairwise variation, the V value (V2/3) was less than 0.15 (Figure 4).
This indicated that the addition of a third gene didn’t have a great effect on normalization process. Therefore, two reference genes were appropriate to normalize gene expression.
For adult assessment, it was similar for the rankings of the best-suited reference genes got by the Delta Ct approach and Bestkeeper. They placedRP49,SDH, andRPL32on the top three positions, although the rank order was slightly altered (Table 2). The top three genes identified by geNorm and NormFinder were
largely different from the results generated by delta Ct method. Additionally, the most stable genes from geNorm also differed from those selected by NormFinder. NormFinder placed the gene SDH on the top position followed by Tub and Hsp70, while geNorm selectRPL32andRP49as the most appropriate candidate genes with the lowest M value (0.054) (Table 2, Figure 3) and EF1awas placed on the third position with the M value (0.107). At the same time, His appeared as the least stable gene by four methods for adult. RefFinder analysis showed the most stable genes were ranked as follows:His,Cht2,18S,Ach,GAPDH , Act , EF1a , Hsp70 , Tub , RPL32 , RP49 , SDH (Table 2). According to the analysis of the pairwise variation, the V value (V2/3) was below 0.15 (Figure 4). This indicates the best
normalization factors for gene transcript analysis should contain at least two reference genes.
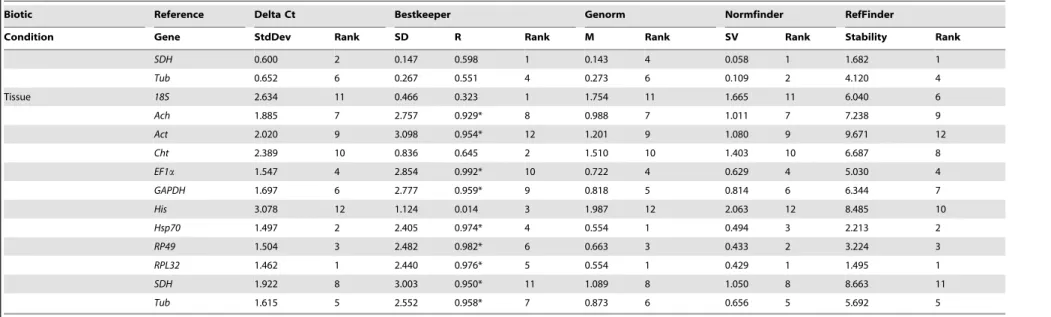
For tissue assay, the top ranked four genes exhibited by delta Ct method for different tissues wereRPL32,Hsp70,RP49andEF1a, which is similar to the results generated by NormFinder and geNorm (Table 2). Additionally, RPL32 was considered as the most appropriate gene by these three algorithms. However, Bestkeeper analysis identified18Sas the best one, followed byCht2 andHis. The geneHsp70was ranked as fourth. Likewise, the delta Ct method, geNorm and Normfinder rankedHisas the least stable gene, but Bestkeeper selected Actas the least stable gene for all tissue samples. RefFinder analysis ranked the best suitable candidate reference genes as follows:Act,SDH,His,Ach, Cht2,GAPDH,18S,Tub,EF1a,Rp49,Hsp70,RPL32 (Table 2). According to the analysis of the pairwise variation, the value of V2/3, V3/4and V4/5 were all above the proposed value
(0.15), but the V5/6value was under the threshold value of 0.15.
This indicates the best normalization factors for gene transcript analysis should contain at least five reference genes.
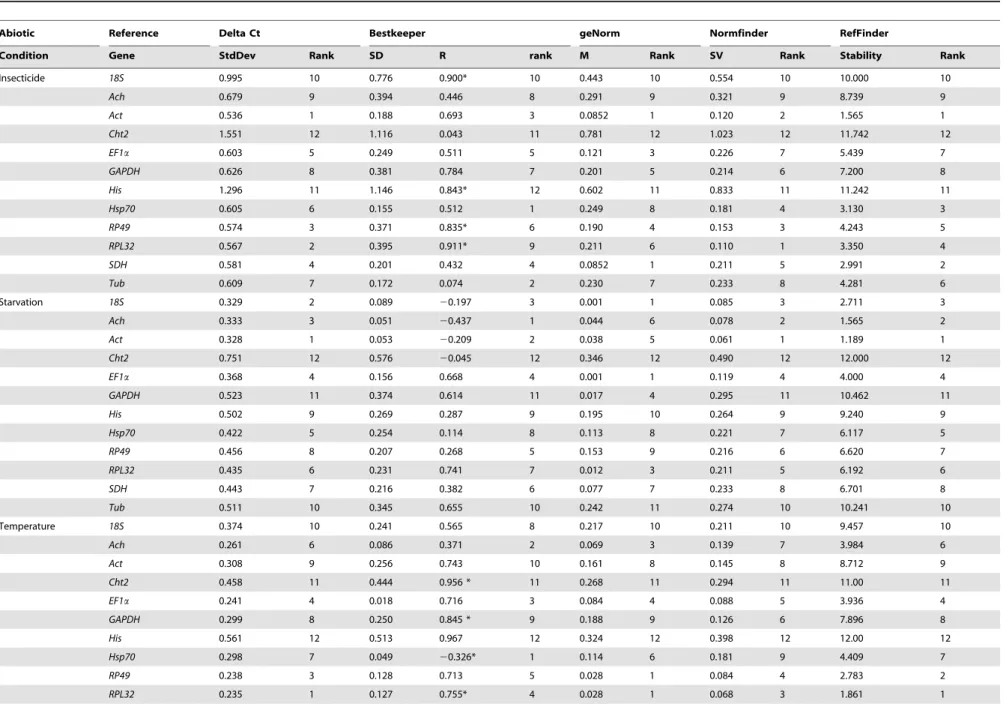
Abiotic stresses. For assay pretreated with different insecti-cide, it was similar for the top ranked three genes exhibited by the delta Ct approach and NormFinder, though the rank order was slightly altered. The delta Ct methods selected Act as the most suitable normalization factor for qPCR normalization followed by RPL32 and RP49 (Table 3). RPL32 was identified as the best endogenous control gene by NormFinder, while Act and RP49 were ranked in the second and third position, respectively. However, geNorm and Bestkeeper analysis generated different results. The top three genes identified by geNorm wereSDH,Act andEF1a(Figure 3), but Hsp70was selected as the most stable gene by Bestkeeper analysis followed byTub andAct. RefFinder analysis showed the most stable genes were ranked as follows:Cht2 ,His,18S,Ach,GAPDH,EF1a,Tub,RP49,RPL32 ,Hsp70,SDH,Act(Table 3). According to the analysis of the pairwise variation, the V value (V2/3) was less than 0.15 (Figure 4).
Thus, two reference genes were sufficient to normalize gene expression.
For survey after starvation, the top ranked four genes exhibited by Normfinder wereAct,Ach,18SandEF1a, which was the same as the results generated by Bestkeeper (Table 3). What’s more, the ranking orders of these four stable genes were also the same. Additionally, the best-suited reference genes generated by delta Ct analysis were also these four genes, though the stability rankings were slightly different. GeNorm analysis selected18SandEF1aas the best suitable reference genes (Figure 3). The geneRPL32was ranked in the third position followed byGAPDH. Interestingly, the candidate geneCht2was considered as the most unstable gene by all the algorithms. RefFinder analysis showed the most stable genes were ranked as follows:Cht2, GAPDH, Tub, His , SDH, RP49, RPL32 ,Hsp70 ,EF1a,18S, Ach,Act (Table 3). The V value (V2/3) was under the proposed value (0.15)
Figure 1. Average cycle threshold (Ct) values of candidate reference genes tested in Locusta migratoria under different conditions. The values are the average qPCR Ct values. The dot represents the outliers of replicated samples, while whiskers represent the standard deviation of the mean.
doi:10.1371/journal.pone.0098164.g001
Selection and Assessment of Reference Genes inLocusta migratoria
(Figure 4). This indicated that the addition of a third gene didn’t have a great effect on normalization process. Therefore, two reference genes were appropriate to normalize gene expression.
For analysis of variant temperature, the most stable reference gene selected by the delta Ct methods wasRPL32, which also the best gene identified by geNorm (Table 3). The delta Ct methods identifiedTubas the second most stable gene followed byRP49, while geNorm identifiedRP49andRPL32both as the best suitable genes followed by Ach (Figure 3). According to the results of Normfinder analysis, the gene RPL32 was ranked in the third position. The geneSDHappeared as the most stable gene followed by Tub. The Bestkeeper analysis generated different results compared to the three other algorithms. Bestkeeper identified Hsp70as the most suitable gene for normalizing gene expression andAchwas set in the second position followed byEF1a. All the statistical algorithms indicatedCht2andHisas the two least stable
genes. RefFinder analysis showed the expression stability of genes was ranked as follows:His , Cht2, 18S , Act , GAPDH, Hsp70,Ach,SDH,EF1a,Tub,RP49,RPL32(Table 3). According to the analysis of the pairwise variation, the V2/3-value
was under the threshold value (0.15) (Figure 4). Therefore, two reference genes were appropriate to normalize gene expression.
For the total investigated samples, the rankings of candidate reference gene stability obtained by three algorithms containing the delta Ct approach, Normfinder and geNorm were largely similar. These three methods indicated the same three most stable candidate genes (EF1a,Hsp70,RPL32), though the ranking order of these three reference genes were different. However, Bestkeeper generated different results:RPL32andRP49appeared as the two best normalization factors followed by 18S. Likewise, all the programs, except for Bestkeeper, selectedCht2as the worst gene. His was selected as the most unstable reference gene by
Figure 2. Distribution of relative expression level of the selected control genes across all samples.Expression level is represented as percentages of the aggregated transcript in different experimental conditions pool for each gene. (A) embryo; (B) nymphs samples; (C) adults; (D) tissue samples; (E) third nymphs subjected to insecticides; (F) third nymphs suffering starvation stress; (G) third nymphs exposed to temperature treatment.
doi:10.1371/journal.pone.0098164.g002
Selection and Assessment of Reference Genes inLocusta migratoria
Bestkeeper. RefFinder analysis showed the most stable genes were ranked as follows:His,Cht2,SDH,GAPDH,18S,Act, Ach,Tub,RP49,EF1a,RPL32,Hsp70(Table S2).
Validation of reference gene selection
To assess the performance of selected reference genes, the transcript level of two target genes (CHS1,GSTs1), were assessed
under various experimental conditions. For different development stages, using the best reference gene or the recommended two most stable references to normalize, CHS1 transcript level were higher in adult compared to larvae stages (Figure 5A). However, when the most unstable gene was used to normalize, no evident difference was detected. We also found that the expression level of CHS1normalized against the combination of two best reference genes was very different from the least stable reference gene
Figure 3. Average expression stability and ranking of twelve candidate reference genes calculated by geNorm.(A) embryos samples (B) nymphs samples (C) adults (D) tissue samples (E) third instar nymphs subjected to insecticides (F) third instar nymphs suffering starvation stress (G) third instar nymphs under temperature stress (H) all of the biological samples.
doi:10.1371/journal.pone.0098164.g003
Selection and Assessment of Reference Genes inLocusta migratoria
(P,0.05) (Figure 5A). For qPCR data analysis in different tissues, if normalized using more than one reference gene (RPL32+Hsp, RPL32+Hsp+RP49,RPL32+Hsp+RP49+EF1a+Tub), the expression profile of GSTs1 in Malpighian tube and fat body was similar (Figure 5B) and higher compared to the other tissues. Using the single best reference gene as a normalization factor, similar results were found in the Malpighian tube and fat body. However, the transcript level ofGSTs1was decreased in Malpighian tube when normalized against the least stable reference gene (His) (P,0.05) (Figure 5B). For insecticide treatment, when normalized against the combination of recommended reference genes (RPL32, Act), the expression ofGSTs1was increased by 1.07-fold for treatment of Cyhalothrin and 1.64 fold for Chlorpyrifos compared with the control insects, but was reduced for the other insecticides. Using the single best reference gene (RPL32) for normalization, imilar expression levels were observed. However, notable differences were found when normalized against the least stable gene (Cht2) (Figure 5C).
Discussion
As an accurate and sensitive method to quantify mRNA transcription levels, qPCR has played a very important role in molecular biology research. Normalization with endogenous reference genes is one very important factor which affects the correct measurement of gene transcript level changes. Researchers are required to prove that the candidate reference gene of choice is appropriate for data normalization of differentially expressed genes under a specific experimental condition. In this report, twelve candidate reference genes inL. migratoriawere assessed for expression stability under the context of different development stages, tissues and special experiment treatments (insecticide, temperature and starvation).
The efficiencies of amplification of reference genes are directly related to the quality of results obtained from qPCR. Therefore, we calculated the efficiencies of each candidate gene prior to quantification. Twelve candidate genes were screened out with amplification efficiency above 91%, while genes with extreme efficiency value were excluded for further analysis.
The expression stability of selected internal control genes was evaluated with four statistical algorithms (the delta Ct approach, geNorm, Bestkeeper, and NormFinder). We assumed that a combination of different mathematical models enabled a better evaluation of the most reliable reference genes. However, there were discrepancies of best reference genes and the stability rankings among the different programs (Table 2, Table 3). This was caused by different mathematical models adopted by each program [47–49]. To solve this problem, RefFinder was adopted to comprehensively evaluate and rank reference genes. To evaluate reliable reference genes using different strategies, we need to be aware of their property. GeNorm software is one commonly used statistical method. The underlying principle of this method is that the transcript ratio of two best reference genes should be same in all test samples. This program ranks the reference gene via calculating M value (the average expression stability) for each gene. At the same time, it also revealed the optimal number of reference gene by analyzing the pairwise variation (V). A V score of less than 0.15 was ideal for valid normalization [46]. However, the disadvantage of geNorm was its sensitivity to co-regulation. It usually select genes with the highest degree of similarity in their transcript level [47].
Compared to geNorm, NormFinder was lack of sensitivity to co-regulation of the reference gene. When using the gene to normalize, NormFinder could supply an expression stability value for each gene that empowers the user to analyze the systematic error.
BestKeeper is another Excel-based tool that evaluates expres-sion stability of reference genes based on two variations (SD and CV values). Genes with an SD value higher than 1 were unacceptable. It then determines the best reference gene according to the probability (p) value and thePearson correlation coefficient (r) calculated frompair-wise correlation analysisof all pairs of selected reference genes [45]. Our results revealed that the rank of most suitable genes obtained from BestKeeper was slightly different from other statistical algorithms. As shown in Table 2,EF1awas ranked at the top position by three programs for embryo stage and ranked fifth by BestKeeper. A similar situation was observed with larvae and tissue samples. This might be caused by the statistical algorithms used by BestKeeper that combines highly correlated reference genes into an index. It usually represents the average of the best suitable reference genes. Therefore, BestKeeper may not be able to sensitively distinguish between stable and unstable reference genes [45,50,51].
The delta Ct approach is similar to that described by the report of Vandesompele for geNorm program, whereby ‘pairs of genes’ are compared [50]. This method uses delta Ct comparisons between genes to bypass the need to accurately quantify input RNA.
Consistent with the reports inDrosophila[51] andSpodoptera litura [52], this study revealed that it’s difficult to identify a universally appropriate reference genes for qPCR analyses, as all the selected reference genes exhibited notable variation of transcript levels under different experimental conditions. Furthermore, the best recommended reference genes were also different. According to RefFinder, which gave the overall final ranking based on the results from each program, EF1a was considered as the best reference gene in embryo and nymph stages,SDHwas selected as the most appropriate gene in adult stage,Actwas selected as the best gene in insecticide and starvation treatments, and RPL32 appeared to be the best normalization factor in different tissues and temperature treatments.
EF1a, one kind of protein that contributed to binding aminoacyl-transfer RNA to ribosomes during protein synthesis
Figure 4. Pairwise variation analysis for an accurate normali-zation. The pairwise variation analysis is performed by geNorm to determine the optimal number of internal control genes. Each pairwise variation value is compared with 0.15, below which the inclusion of an additional reference gene is not required.
doi:10.1371/journal.pone.0098164.g004
Selection and Assessment of Reference Genes inLocusta migratoria
Table 2.Expression stability of the candidate reference genes under biotic conditions.
Biotic Reference Delta Ct Bestkeeper Genorm Normfinder RefFinder
Condition Gene StdDev Rank SD R Rank M Rank SV Rank Stability Rank
Embryo 18S 1.606 9 1.550 0.831 10 1.086 10 0.851 10 9.740 10
Ach 1.335 8 1.449 0.969* 9 0.887 8 0.493 5 7.326 9
Act 1.188 4 0.886 0.854 6 0.563 4 0.486 4 4.899 4
Cht2 3.112 12 3.084 0.938* 12 1.521 12 2.168 12 12.000 12
EF1a 1.048 1 0.848 0.961* 5 0.401 1 0.226 2 1.778 1
GAPDH 1.327 7 0.841 0.794 4 0.739 6 0.649 8 6.055 8
His 1.632 11 1.552 0.829 11 1.181 11 0.812 9 10.462 11
Hsp70 1.103 2 1.000 0.932* 7 0.447 3 0.025 1 2.546 3
RP49 1.625 10 0.652 0.508 1 0.983 9 0.991 11 5.609 6
RPL32 1.118 3 0.777 0.911* 2 0.401 1 0.399 3 2.060 2
SDH 1.245 5 1.054 0.927* 8 0.803 7 0.506 6 5.789 7
Tub 1.297 6 0.834 0.814 3 0.673 5 0.574 7 5.010 5
Larvae 18S 0.867 11 0.307 20.458 4 0.488 11 0.587 11 8.542 10
Ach 0.748 10 0.561 0.800* 11 0.431 10 0.386 10 10.241 11
Act 0.554 4 0.413 0.956* 9 0.337 7 0.069 3 5.244 6
Cht2 2.097 12 2.044 0.842* 12 0.784 12 1.554 12 12.000 12
EF1a 0.497 1 0.316 0.980* 5 0.116 1 0.040 1 2.115 1
GAPDH 0.608 8 0.222 0.502 1 0.272 5 0.316 9 2.913 3
His 0.519 3 0.362 0.968* 6 0.116 1 0.041 2 3.663 5
Hsp70 0.606 7 0.414 0.847* 10 0.385 9 0.198 6 7.841 9
RP49 0.641 9 0.387 0.549 7 0.362 8 0.243 7 7.707 8
RPL32 0.508 2 0.231 0.890* 2 0.172 3 0.082 4 2.632 2
SDH 0.588 6 0.270 0.647 3 0.254 4 0.283 8 3.464 4
Tub 0.573 5 0.409 0.755* 8 0.312 6 0.131 5 5.886 7
Adult 18S 0.983 10 0.481 0.215 8 0.550 10 0.524 9 9.212 10
Ach 0.863 9 0.567 0.056 9 0.392 8 0.560 10 8.972 9
Act 0.767 7 0.575 0.504 10 0.327 7 0.390 7 7.653 7
Cht2 1.597 11 1.201 0.735 11 0.777 11 1.140 11 11.000 11
EF1a 0.634 5 0.286 0.360 5 0.107 3 0.229 6 4.606 6
GAPDH 0.817 8 0.430 20.012 7 0.438 9 0.468 8 7.969 8
His 1.651 12 1.547 0.726 12 0.952 12 1.186 12 12.000 12
Hsp70 0.631 4 0.384 0.722 6 0.210 5 0.114 3 4.356 5
RP49 0.579 1 0.241 0.660 3 0.054 1 0.195 4 1.861 2
RPL32 0.613 3 0.222 0.178 2 0.054 1 0.221 5 2.340 3
Selection
and
Assessment
of
Reference
Genes
in
Locusta
migratoria
PLOS
ONE
|
www.ploson
e.org
9
June
2014
|
Volume
9
|
Issue
6
|
Table 2.Cont.
Biotic Reference Delta Ct Bestkeeper Genorm Normfinder RefFinder
Condition Gene StdDev Rank SD R Rank M Rank SV Rank Stability Rank
SDH 0.600 2 0.147 0.598 1 0.143 4 0.058 1 1.682 1
Tub 0.652 6 0.267 0.551 4 0.273 6 0.109 2 4.120 4
Tissue 18S 2.634 11 0.466 0.323 1 1.754 11 1.665 11 6.040 6
Ach 1.885 7 2.757 0.929* 8 0.988 7 1.011 7 7.238 9
Act 2.020 9 3.098 0.954* 12 1.201 9 1.080 9 9.671 12
Cht 2.389 10 0.836 0.645 2 1.510 10 1.403 10 6.687 8
EF1a 1.547 4 2.854 0.992* 10 0.722 4 0.629 4 5.030 4
GAPDH 1.697 6 2.777 0.959* 9 0.818 5 0.814 6 6.344 7
His 3.078 12 1.124 0.014 3 1.987 12 2.063 12 8.485 10
Hsp70 1.497 2 2.405 0.974* 4 0.554 1 0.494 3 2.213 2
RP49 1.504 3 2.482 0.982* 6 0.663 3 0.433 2 3.224 3
RPL32 1.462 1 2.440 0.976* 5 0.554 1 0.429 1 1.495 1
SDH 1.922 8 3.003 0.950* 11 1.089 8 1.050 8 8.663 11
Tub 1.615 5 2.552 0.958* 7 0.873 6 0.656 5 5.692 5
StdDev, standard deviation; SD, standard deviation; SV, stability value; r, Pearson correlation coefficient; *p#0.001. doi:10.1371/journal.pone.0098164.t002
Selection
and
Assessment
of
Reference
Genes
in
Locusta
migratoria
PLOS
ONE
|
www.ploson
e.org
10
June
2014
|
Volume
9
|
Issue
6
|
Table 3.Expression stability of the candidate reference genes under abiotic conditions.
Abiotic Reference Delta Ct Bestkeeper geNorm Normfinder RefFinder
Condition Gene StdDev Rank SD R rank M Rank SV Rank Stability Rank
Insecticide 18S 0.995 10 0.776 0.900* 10 0.443 10 0.554 10 10.000 10
Ach 0.679 9 0.394 0.446 8 0.291 9 0.321 9 8.739 9
Act 0.536 1 0.188 0.693 3 0.0852 1 0.120 2 1.565 1
Cht2 1.551 12 1.116 0.043 11 0.781 12 1.023 12 11.742 12
EF1a 0.603 5 0.249 0.511 5 0.121 3 0.226 7 5.439 7
GAPDH 0.626 8 0.381 0.784 7 0.201 5 0.214 6 7.200 8
His 1.296 11 1.146 0.843* 12 0.602 11 0.833 11 11.242 11
Hsp70 0.605 6 0.155 0.512 1 0.249 8 0.181 4 3.130 3
RP49 0.574 3 0.371 0.835* 6 0.190 4 0.153 3 4.243 5
RPL32 0.567 2 0.395 0.911* 9 0.211 6 0.110 1 3.350 4
SDH 0.581 4 0.201 0.432 4 0.0852 1 0.211 5 2.991 2
Tub 0.609 7 0.172 0.074 2 0.230 7 0.233 8 4.281 6
Starvation 18S 0.329 2 0.089 20.197 3 0.001 1 0.085 3 2.711 3
Ach 0.333 3 0.051 20.437 1 0.044 6 0.078 2 1.565 2
Act 0.328 1 0.053 20.209 2 0.038 5 0.061 1 1.189 1
Cht2 0.751 12 0.576 20.045 12 0.346 12 0.490 12 12.000 12
EF1a 0.368 4 0.156 0.668 4 0.001 1 0.119 4 4.000 4
GAPDH 0.523 11 0.374 0.614 11 0.017 4 0.295 11 10.462 11
His 0.502 9 0.269 0.287 9 0.195 10 0.264 9 9.240 9
Hsp70 0.422 5 0.254 0.114 8 0.113 8 0.221 7 6.117 5
RP49 0.456 8 0.207 0.268 5 0.153 9 0.216 6 6.620 7
RPL32 0.435 6 0.231 0.741 7 0.012 3 0.211 5 6.192 6
SDH 0.443 7 0.216 0.382 6 0.077 7 0.233 8 6.701 8
Tub 0.511 10 0.345 0.655 10 0.242 11 0.274 10 10.241 10
Temperature 18S 0.374 10 0.241 0.565 8 0.217 10 0.211 10 9.457 10
Ach 0.261 6 0.086 0.371 2 0.069 3 0.139 7 3.984 6
Act 0.308 9 0.256 0.743 10 0.161 8 0.145 8 8.712 9
Cht2 0.458 11 0.444 0.956 * 11 0.268 11 0.294 11 11.00 11
EF1a 0.241 4 0.018 0.716 3 0.084 4 0.088 5 3.936 4
GAPDH 0.299 8 0.250 0.845 * 9 0.188 9 0.126 6 7.896 8
His 0.561 12 0.513 0.967 12 0.324 12 0.398 12 12.00 12
Hsp70 0.298 7 0.049 20.326* 1 0.114 6 0.181 9 4.409 7
RP49 0.238 3 0.128 0.713 5 0.028 1 0.084 4 2.783 2
RPL32 0.235 1 0.127 0.755* 4 0.028 1 0.068 3 1.861 1
Selection
and
Assessment
of
Reference
Genes
in
Locusta
migratoria
PLOS
ONE
|
www.ploson
e.org
11
June
2014
|
Volume
9
|
Issue
6
|
[53], was placed on the top position for the stability ranking in embryo and larvae stage and ranked as the forth stable gene in tissues samples, starvation and temperature treatment. These results showed very similar correlations with the research in Drosophila across abiotic stress.EF1awas assumed to be the best gene in the brain of fifth-instar nymph ofSchistocerca gregariaand Chortoicetes terminifera reared under different density treatments. Surprisingly,EF1awas not a good choice for adult according to the analysis of all programs except geNorm. This also highlighted the necessity for validation of the reference genes for different development stages.
Act plays a key role in cytoskeleton maintenance and cell motility. It is the most abundant protein in eukaryotic cells [54]. AlthoughActhas been usually used as a normalization factor in molecular expression studies [55], several studies have shown that the expression of Act fluctuated with aging, growth [56,57], developmental stage and differentiation [58,59]. Our study also found Act displayed very low stability in different development stages and tissues. However,Act was still found to be the most reliable marker of internal control in the insecticide and starvation treatment.
RPL32 (ribosomal protein L32) is a ribosomal structural constituent. In this study, RPL32 was selected as the most appropriate reference gene in different tissues and temperature treatment. RPL32 also appeared as the second most suitable reference gene in embryo and nymphs stage. Our conclusions were in accordance with the research inChortoicetes terminifera[37] and corpora allata of Diploptera punctate [60]. Additionally, the stability ofRP49was always behindRPL32in our study, though they are both ribosomal proteins. Tub, a type of cytoskeletal structure protein, is another commonly used reference gene. In this study,Tub was identified as a moderately stable gene with stability rank around fifth in most samples except for temperature and starvation treatments. Tub appeared as the third most appropriate reference gene in third-instar nymphs subjected to temperature treatment and a variable gene under starvation stress. To the best of our knowledge,Tubhas been reported unsuitable to normalize gene expression in the brain of desert locust [36] and in virus-infected planthoppers [61].
SDHandGAPDHare two multifunctional enzymes involved in citrate cycle and metabolic pathways, respectively. Our results showed SDH was the best reference gene for adult stage and insecticide treatment. We also found thatSDHandGAPDHwere stable in larvae stage followed by EF1a and RPL32. For other experimental conditions,SDHandGAPDHwere not good choices, especially for the abiotic stress. To our knowledge, the expression level of genes which participated in metabolic processes might fluctuate largely under heat stress [62], and GAPDH should be avoided to normalize gene expression in hypoxia experiments [63].Hsp70, involved in translating one kind of 70 kDa heat shock protein [64], was chosen as the reference gene to assess the expression ofAChEgene (acetylcholinesterase) after injection with dsRNA in L. migratoria manilensis [44]. In this study, Hsp70 was identified as the second most appropriate candidate gene in different tissues and third most stable in embryo stage and larvae treated with different insecticides. However,Hsp70was detected to be unstable in larvae treated at different temperatures as it is sensitive to temperature.His, the housekeeping gene histone H3 which encodes histone protein [65], was rarely used as a normalization gene in insect. According to our study,Hisappeared as the second most suitable gene based on the assessment of NormFinder and geNorm in nymph stage. However, it was the most variable gene in other conditions.
Table 3. Cont. Abiotic Reference Delta Ct Bestkeeper geNorm Normfinder RefFinder Condition Gene StdDev Rank SD R rank M Rank SV Rank Stability Rank SDH 0.241 5 0.140 0 .917* 7 0.129 7 0.038 1 3.956 5 Tub 0.235 2 0.129 0 .853 * 6 0.095 5 0.065 2 3.310 3 StdDev, standard deviation; SD, standard deviation; SV, stability value; r, Pearson correlation coefficient; * p # 0.001. doi:10.1371/journal.pone. 0098164.t003
Selection and Assessment of Reference Genes inLocusta migratoria
The18Sribosomal subunit was highly expressed in all samples with the lowest Ct values. The low Ct values reflect the large quantity of transcripts. mRNA only constitutes 5% of the total RNA, while rRNA corresponds to a large portion of the RNA. Therefore, it might not a good idea to choose18S rRNA as the internal control factor. Interestingly, our study indicated that18S was not stable enough based on the analysis of all the programs except for Bestkeeper. Many previous studies also showed that18S was not a suitable reference gene [66–71]. Therefore, we did not
recommend 18S rRNA to normalize gene expression in our experimental conditions.
Cht2andAchwere used as two novel reference genes identified from the locust microarray data [38].Achis involved in fatty acid metabolism [72] and acetate utilization in mitochondria [73]. In this study,Achwas selected as the best gene in third-instar nymphs suffering starvation. However Cht2, which plays a role in hydrolyzing chitin, was considered as the worst gene in all samples in this study. The stability ofCht2had also been found unreliable
Figure 5. Validation of reference gene selection.(A) Relative Expression levels ofCHS1in six developmental stages (B) Relative Expression levels of target gene,GSTs1, in midgut (MG), Malpighian tubules (MT), fatbodies (FB), Spermary (SP) (C) and different insecticides, cyhalothrin (EC1), acetamiprid (EC2), chlorantraniliprole (EC3), chlorpyrifos (EC4). NF1, using the single one best reference gene for normalization; NF (1–2), using two best reference genes; NF (1–3), using three best reference genes; NF (1–5) using four best reference genes; NF (12), using the least stable reference gene. Asterisks indicate significant difference of the expression of the target gene based on three biological replications. (P,0.05, t-test; n = 3). doi:10.1371/journal.pone.0098164.g005
Table 4.Preferable control genes inL. migratoriaacross different experimental conditions.
Experimental conditions Preferable reference genes
Biotic factors Embryo EF1a RPL32
Larvae EF1a RPL32
Adult SDH RP49
Tissue RPL32 Hsp70 RP49
Abiotic factors Insecticide Act SDH
Starvation Act Ach
Temperature RPL32 RP49
doi:10.1371/journal.pone.0098164.t004
Selection and Assessment of Reference Genes inLocusta migratoria
for gene expression analysis in a previous study in locusts exposed to hypobaric hypoxia [38].
To accurately measure the expression levels of a target gene, normalization by multiple housekeeping genes is necessary. However, it is impractical to quantify more stable reference genes than necessary, especially when the amounts of template are limited. Vandesompele et al. [46] recommended to determine the ideal number of selected housekeeping genes by calculating the normalization factor (NF) with geNorm. If the pairwise variation (Vn/n+1) was below 0.15, it means adding n+1 gene has no
obviously effect on normalization factors. Then, the geometric average of the top n candidate reference genes in the system would be the optimal normalization factor for the future experiment [46]. In our study, the V2/3 values were all below 0.15 for the
development stages and abiotic stress, so two best reference genes are sufficient to analysis the expression of the gene of interest. Figure 5 showed that two most appropriate genes provided a more conservative estimation of target gene transcription com-pared to a single gene. Our results also demonstrated that the application of the least stable reference gene could result in false interpretation (Figure 5A). As for the different tissues, V5/6was
below the proposed 0.15 value, so the best number of selected reference genes should be five. However, it will require a large amount of resources using five control genes as a normalization factor, and our results demonstrated that the expression level and pattern of target gene GSTs1 in tissues were similar when normalized against three best reference genes and five most stable reference genes (Figure 5B). Therefore, we believe that using three best control genes is a valid normalization strategy for tissue samples.
As a proof of principle, our validation results were tested by evaluating the transcript of two target genes in different development stages, tissues and larvae subjected to insecticide treatment. CHS1 plays an important role in chitin synthesis in insect cuticle [74]. The gene CHS1 of L. migratoria is expressed consistently in every life stage and with the highest transcript amount in adults [75–77]. In this report, the expression level of LmCHS1was highest in adult when normalized using the two best reference genes (Figure 5A), but not when using the least stable reference gene for normalization. Glutathione S-transferases (GSTs), a diverse family of dimeric enzymes, can eliminate toxicants from a cell [78–79]. Our results demonstrated that the highest transcript levels ofGSTs1mRNA were detected in fat body and Malpighian tubules when using the recommended set of reference genes for normalization (Figure 5B). This can be explained by the fact that the fat body of insects is the main
metabolic detoxification center [76]. Our results were also in accordance with a previous report [77]. However, when only normalized by the least stable reference gene, the expression pattern ofGSHs1was very different. Similar results were observed when evaluating the expression level ofGSHs1in the third-instar larvae subjected to insecticides (Figure 5C). Therefore, using appropriate reference genes for normalization would be one of the key factors for accurate estimation of target gene expression, while unsuitable normalization factors might lead to deviated results and concealing of true outcome.
Conclusions
In conclusion, our study provides a comprehensive assessment for the suitable reference genes for qPCR inL. migratoriaacross all the development stages, tissues and three abiotic stress:EF1aand RPL32were found to be reliable for embryo and larvae stage;SDH andRP49were optimal for adult stage;RPL32,Hsp70andRP49 should be recommended for study in different tissues;ActandSDH would be appropriate for larvae treated with insecticide treatment; Act and Achshould be used for larvae suffering starvation; and RPL32andRP49were selectable for larvae subjected to different temperature treatment (Table 4). Our data verified the caution that the expression stability of selected reference genes needed to be evaluated in different treated samples. This study will benefit future work on target gene expression inL. migratoria.
Supporting Information
Table S1 The insecticide bioassay to the third-instar nymphs of Locusta migratoria.
(DOC)
Table S2 Expression stability of the candidate reference genes across all the samples.
(DOCX)
Acknowledgments
We thank Yuanyuan Zheng for help with rearing the wheat seedlings for the nymphs.
Author Contributions
Conceived and designed the experiments: QPY QWZ XXL. Performed the experiments: QPY JJC SDZ. Analyzed the data: QPY ZL XXL. Contributed reagents/materials/analysis tools: QPY HJZ XYW. Wrote the paper: QPY XXL QWZ.
References
1. Bustin S (2002) Quantification of mRNA using real-time reverse transcription PCR (RT-PCR): trends and problems. Journal of molecular endocrinology 29: 23–39.
2. Bustin SA (2000) Absolute quantification of mRNA using real-time reverse transcription polymerase chain reaction assays. Journal of molecular endocri-nology 25: 169–193.
3. Derveaux S, Vandesompele J, Hellemans J (2010) How to do successful gene expression analysis using real-time PCR. Methods 50: 227–230.
4. Bustin SA, Nolan T (2004) Pitfalls of quantitative real-time reverse-transcription polymerase chain reaction. Journal of biomolecular techniques: JBT 15: 155– 166.
5. Mahoney DJ, Carey K, Fu MH, Snow R, Cameron-Smith D, et al. (2004) Real-time RT-PCR analysis of housekeeping genes in human skeletal muscle following acute exercise. Physiological genomics 18: 226–231.
6. Huggett J, Dheda K, Bustin S, Zumla A (2005) Real-time RT-PCR normalisation; strategies and considerations. Genes and immunity 6: 279–284. 7. Talaat AM, Howard ST, Hale IV W, Lyons R, Garner H, et al. (2002) Genomic DNA standards for gene expression profiling inMycobacterium tuberculosis. Nucleic acids research 30: e104–e104.
8. Nicot N, Hausman JF, Hoffmann L, Evers D (2005) Housekeeping gene selection for real-time RT-PCR normalization in potato during biotic and abiotic stress. Journal of experimental botany 56: 2907–2914.
9. Radonic´ A, Thulke S, Mackay IM, Landt O, Siegert W, et al. (2004) Guideline to reference gene selection for quantitative real-time PCR. Biochemical and biophysical research communications 313: 856–862.
10. Thellin O, Zorzi W, Lakaye B, De Borman B, Coumans B, et al. (1999) Housekeeping genes as internal standards: use and limits. Journal of biotechnology 75: 291–295.
11. Bas A, Forsberg G, Hammarstro¨m S, Hammarstro¨m ML (2004) Utility of the Housekeeping Genes 18S rRNA, b-Actin and Glyceraldehyde-3-Phosphate-Dehydrogenase for Normalization in Real-Time Quantitative Reverse Tran-scriptase-Polymerase Chain Reaction Analysis of Gene Expression in Human T Lymphocytes. Scandinavian journal of immunology 59: 566–573.
12. Be´meur C, Ste-Marie L, Desjardins P, Hazell AS, Vachon L, et al. (2004) Decreasedb-actin mRNA expression in hyperglycemic focal cerebral ischemia in the rat. Neuroscience letters 357: 211–214.
13. Dheda K, Huggett JF, Bustin SA, Johnson MA, Rook G, et al. (2004) Validation of housekeeping genes for normalizing RNA expression in real-time PCR. Biotechniques 37: 112–119.
Selection and Assessment of Reference Genes inLocusta migratoria
14. Koch I, Weil R, Wolbold R, Brockmo¨ller J, Hustert E, et al. (2002) Interindividual variability and tissue-specificity in the expression of cytochrome P450 3A mRNA. Drug Metabolism and Disposition 30: 1108–1114. 15. Schmid H, Cohen CD, Henger A, Irrgang S, Schlo¨ndorff D, et al. (2003)
Validation of endogenous controls for gene expression analysis in microdissected human renal biopsies. Kidney international 64: 356–360.
16. Schulz WA, Eickelmann P, Hallbrucker C, Sies H, Ha¨ussinger D (1991) Increase of beta-actin mRNA upon hypotonic perfusion of perfused rat liver. FEBS letters 292: 264–266.
17. Tricarico C, Pinzani P, Bianchi S, Paglierani M, Distante V, et al. (2002) Quantitative real-time reverse transcription polymerase chain reaction: normal-ization to rRNA or single housekeeping genes is inappropriate for human tissue biopsies. Analytical biochemistry 309: 293–300.
18. Ullmannova V, Haskovec C (2003) The use of housekeeping genes (HKG) as an internal control for the detection of gene expression by quantitative real-time RT-PCR. Folia Biologica (Praha) 49: 211–216.
19. Kidd M, Nadler B, Mane S, Eick G, Malfertheiner M, et al. (2007) GeneChip, geNorm, and gastrointestinal tumors: novel reference genes for real-time PCR. Physiological genomics 30: 363–370.
20. Kosir R, Acimovic J, Golicnik M, Perse M, Majdic G, et al. (2010) Determination of reference genes for circadian studies in different tissues and mouse strains. BMC molecular biology 11: 60.
21. Warrington JA, Nair A, Mahadevappa M, Tsyganskaya M (2000) Comparison of human adult and fetal expression and identification of 535 housekeeping/ maintenance genes. Physiological genomics 2: 143–147.
22. Cicinnati VR, Shen Q, Sotiropoulos GC, Radtke A, Gerken G, et al. (2008) Validation of putative reference genes for gene expression studies in human hepatocellular carcinoma using real-time quantitative RT-PCR. BMC cancer 8: 350.
23. Czechowski T, Stitt M, Altmann T, Udvardi MK, Scheible WR (2005) Genome-wide identification and testing of superior reference genes for transcript normalization in Arabidopsis. Plant physiology 139: 5–17.
24. Piana C, Wirth M, Gerbes S, Viernstein H, Gabor F, et al. (2008) Validation of reference genes for qPCR studies on Caco-2 cell differentiation. European Journal of Pharmaceutics and Biopharmaceutics 69: 1187–1192.
25. Remans T, Smeets K, Opdenakker K, Mathijsen D, Vangronsveld J, et al. (2008) Normalisation of real-time RT-PCR gene expression measurements in
Arabidopsis thalianaexposed to increased metal concentrations. Planta 227: 1343– 1349.
26. Udvardi MK, Czechowski T, Scheible WR (2008) Eleven golden rules of quantitative RT-PCR. The Plant Cell Online 20: 1736–1737.
27. Watson S, Mercier S, Bye C, Wilkinson J, Cunningham AL, et al. (2007) Determination of suitable housekeeping genes for normalisation of quantitative real time PCR analysis of cells infected with human immunodeficiency virus and herpes viruses. Virology journal 4: 1–5.
28. Chen Y (2000) Main achievement of research and management of migratory locust in China. Entomol Knowledge 37: 50–55.
29. Zhu E (1999) Occurrence and Management of the Oriental Migratory Locust in China. Beijing: China Agriculture Press.
30. Kang L, Chen X, Zhou Y, Liu B, Zheng W, et al. (2004) The analysis of large-scale gene expression correlated to the phase changes of the migratory locust. Proceedings of the National Academy of Sciences of the United States of America 101: 17611–17615.
31. Guo W, Wang X, Zhao D, Yang P, Kang L (2010) Molecular cloning and temporal–spatial expression of I element in gregarious and solitary locusts. Journal of Insect Physiology 56: 943–948.
32. Wang GH, Xia QY, Cheng DJ, Duan J, Zhao P, et al. (2008) Reference genes identified in the silkworm Bombyx mori during metamorphism based on oligonucleotide microarray and confirmed by qRT-PCR. Insect Science 15: 405–413.
33. Lourenc¸o AP, Mackert A, Cristino AD, Simo˜es ZLP (2008) Validation of reference genes for gene expression studies in the honey bee,Apis mellifera, by quantitative real-time RT-PCR. Apidologie 39: 372–385.
34. Scharlaken B, de Graaf DC, Goossens K, Brunain M, Peelman LJ, et al. (2008) Reference gene selection for insect expression studies using quantitative real-time PCR: The head of the honeybee,Apis mellifera, after a bacterial challenge. Journal of insect Science 8: 33.
35. Lord JC, Hartzer K, Toutges M, Oppert B (2010) Evaluation of quantitative PCR reference genes for gene expression studies inTribolium castaneumafter fungal challenge. Journal of microbiological methods 80: 219–221.
36. Van Hiel MB, Van Wielendaele P, Temmerman L, Van Soest S, Vuerinckx K, et al. (2009) Identification and validation of housekeeping genes in brains of the desert locustSchistocerca gregariaunder different developmental conditions. BMC molecular biology 10: 56.
37. Chapuis MP, Tohidi-Esfahani D, Dodgson T, Blondin L, Ponton F, et al. (2011) Assessment and validation of a suite of reverse transcription-quantitative PCR reference genes for analyses of density-dependent behavioural plasticity in the Australian plague locust. BMC molecular biology 12: 7.
38. Zhao DJ, Guo K, Kang L (2012) Identification of condition-specific reference genes from microarray data for locusts exposed to hypobaric hypoxia. FEBS open bio 2: 235–240.
39. Bear A, Simons A, Westerman E, Monteiro A (2010) The genetic, morphological, and physiological characterization of a dark larval cuticle mutation in the butterfly,Bicyclus anynana. PloS ONE 5: e11563.
40. Shelton AM, Robertson J, Tang J, Perez C, Eigenbrode S, et al. (1993) Resistance of diamondback moth (Lepidoptera: Plutellidae) toBacillus thuringiensis
subspecies in the field. Journal of Economic Entomology 86: 697–705. 41. Wang XH, Kang L (2003) Rapid cold hardening in young hoppers of the
migratory locustLocusta migratoriaL.(Orthoptera: Acridiidae). CryoLetters 24: 331–340.
42. Winnebeck EC, Millar CD, Warman GR (2010) Why does insect RNA look degraded? Journal of insect science (Online) 10: 159.
43. Zhang C, Xia Y (2009) Identification of genes differentially expressed in vivo by
Metarhizium anisopliaein the hemolymph ofLocusta migratoriausing suppression-subtractive hybridization. Current genetics 55: 399–407.
44. Zhou X, Xia Y (2009) Cloning of an acetylcholinesterase gene in Locusta migratoria manilensisrelated to organophosphate insecticide resistance. Pesticide Biochemistry and Physiology 93: 77–84.
45. Pfaffl MW, Tichopad A, Prgomet C, Neuvians TP (2004) Determination of stable housekeeping genes, differentially regulated target genes and sample integrity: BestKeeper–Excel-based tool using pair-wise correlations. Biotechnol-ogy letters 26: 509–515.
46. Vandesompele J, De Preter K, Pattyn F, Poppe B, Van Roy N, et al. (2002) Accurate normalization of real-time quantitative RT-PCR data by geometric averaging of multiple internal control genes. Genome biology 3: research0034. 47. Andersen CL, Jensen JL, Ørntoft TF (2004) Normalization of real-time quantitative reverse transcription-PCR data: a model-based variance estimation approach to identify genes suited for normalization, applied to bladder and colon cancer data sets. Cancer research 64: 5245–5250.
48. Mafra V, Kubo KS, Alves-Ferreira M, Ribeiro-Alves M, Stuart RM, et al. (2012) Reference genes for accurate transcript normalization in citrus genotypes under different experimental conditions. PloS ONE 7: e31263.
49. Mallona I, Lischewski S, Weiss J, Hause B, Egea-Cortines M (2010) Validation of reference genes for quantitative real-time PCR during leaf and flower development inPetunia hybrida. BMC Plant Biology 10: 4.
50. Docimo T, Schmidt GW, Luck K, Delaney SK, D’Auria JC (2013) Selection and validation of reference genes for quantitative gene expression studies in
Erythroxylum coca. F1000Research 2.
51. Lin Y, Lai Z (2010) Reference gene selection for qPCR analysis during somatic embryogenesis in longan tree. Plant Science 178: 359–365.
52. Silver N, Best S, Jiang J, Thein SL (2006) Selection of housekeeping genes for gene expression studies in human reticulocytes using real-time PCR. BMC molecular biology 7: 33.
53. Ponton F, Chapuis MP, Pernice M, Sword GA, Simpson SJ (2011) Evaluation of potential reference genes for reverse transcription-qPCR studies of physiological responses inDrosophila melanogaster. Journal of Insect Physiology 57: 840–850. 54. Lu Y, Yuan M, Gao X, Kang T, Zhan S, et al. (2013) Identification and
validation of reference genes for gene expression analysis using quantitative PCR inSpodoptera litura(Lepidoptera: Noctuidae). PloS ONE 8: e68059.
55. Stu¨rzenbaum SR, Kille P (2001) Control genes in quantitative molecular biological techniques: the variability of invariance. Comparative Biochemistry and Physiology Part B: Biochemistry and Molecular Biology 130: 281–289. 56. Hunter T, Garrels JI (1977) Characterization of the mRNAs for alpha-,
beta-and gamma-actin. Cell 12: 767–781.
57. Ruan W, Lai M (2007) Actin, a reliable marker of internal control? Clinica Chimica Acta 385: 1–5.
58. Deindl E, Boengler K, van Royen N, Schaper W (2002) Differential expression of GAPDH and beta3-actin in growing collateral arteries. Molecular and cellular biochemistry 236: 139–146.
59. Moshier JA, Cornell T, Majumdar APN (1993) Expression of protease genes in the gastric mucosa during aging. Experimental Gerontology 28: 249–258. 60. Sellars MJ, Vuocolo T, Leeton LA, Coman GJ, Degnan BM, et al. (2007)
Real-time RT-PCR quantification of Kuruma shrimp transcripts: a comparison of relative and absolute quantification procedures. Journal of biotechnology 129: 391–399.
61. Serazin-Leroy V, Denis-Henriot D, Morot M, De Mazancourt P, Giudicelli Y (1998) Semi-quantitative RT-PCR for comparison of mRNAs in cells with different amounts of housekeeping gene transcripts. Molecular and cellular probes 12: 283–291.
62. Marchal E, Hult EF, Huang J, Tobe SS (2013) Sequencing and validation of housekeeping genes for quantitative real-time PCR during the gonadotrophic cycle ofDiploptera punctata. BMC Research Notes 6: 237.
63. Maroniche GA, Sagadı´n M, Mongelli VC, Truol GA, del Vas M (2011) Reference gene selection for gene expression studies using RT-qPCR in virus-infected planthoppers. Virology Journal 8: 308.
64. Kristensen TN, Sørensen P, Pedersen KS, Kruhøffer M, Loeschcke V (2006) Inbreeding by environmental interactions affect gene expression inDrosophila melanogaster. Genetics 173: 1329–1336.
65. Zhong H, Simons JW (1999) Direct comparison of GAPDH, beta-actin, cyclophilin, and 28S rRNA as internal standards for quantifying RNA levels under hypoxia. Biochemical and biophysical research communications 259: 523–526.
66. Qin W, Tyshenko MG, Wu BS, Walker VK, Robertson RM (2003) Cloning and characterization of a member of the Hsp70 gene family fromLocusta migratoria, a highly thermotolerant insect. Cell stress & chaperones 8: 144–152.
67. Steenkamp E, Wingfield B, Coutinho T, Wingfield M, Marasas W (1999) Differentiation ofFusarium subglutinansf. sp.piniby Histone Gene Sequence Data. Applied and Environmental Microbiology 65: 3401–3406.
Selection and Assessment of Reference Genes inLocusta migratoria
68. Fernandes JM, Mommens M, Hagen Ø, Babiak I, Solberg C (2008) Selection of suitable reference genes for real-time PCR studies of Atlantic halibut development. Comparative Biochemistry and Physiology Part B: Biochemistry and Molecular Biology 150: 23–32.
69. Infante C, Matsuoka M, Asensio E, Can˜avate J, Reith M, et al. (2008) Selection of housekeeping genes for gene expression studies in larvae from flatfish using real-time PCR. BMC Molecular Biology 9: 28.
70. Jiang HB, Liu YH, Tang PA, Zhou AW, Wang JJ (2010) Validation of endogenous reference genes for insecticide-induced and developmental expres-sion profiling ofLiposcelis bostsrychophila(Psocoptera: Liposcelididae). Molecular biology reports 37: 1019–1029.
71. Olsvik P, Lie K, Jordal AE, Nilsen T, Hordvik I (2005) Evaluation of potential reference genes in real-time RT-PCR studies of Atlantic salmon. BMC Molecular Biology 6: 21.
72. Pe´rez R, Tupac-Yupanqui I, Dunner S (2008) Evaluation of suitable reference genes for gene expression studies in bovine muscular tissue. BMC molecular biology 9: 79.
73. Shen GM, Jiang HB, Wang XN, Wang JJ (2010) Evaluation of endogenous references for gene expression profiling in different tissues of the oriental fruit fly
Bactrocera dorsalis(Diptera: Tephritidae). BMC molecular biology 11: 76.
74. Suematsu N, Okamoto K, Isohashi F (2002) Mouse cytosolic acetyl-CoA hydrolase, a novel candidate for a key enzyme involved in fat metabolism: cDNA cloning, sequencing and functional expression. Acta Biochim Pol 49: 937–945. 75. Lee FJ, Lin LW, Smith JA (1996) Acetyl-CoA hydrolase involved in acetate utilization inSaccharomyces cerevisiae. Biochimica et biophysica acta 1297: 105– 109.
76. Zimoch L, Merzendorfer H (2002) Immunolocalization of chitin synthase in the tobacco hornworm. Cell and tissue research 308: 287–297.
77. Zhang J, Liu X, Zhang J, Li D, Sun Y, et al. (2010) Silencing of two alternative splicing-derived mRNA variants of chitin synthase 1 gene by RNAi is lethal to the oriental migratory locust, Locusta migratoria manilensis (Meyen). Insect biochemistry and molecular biology 40: 824–833.
78. Keeley L (1985) Physiology and biochemistry of the fat body. Comprehensive insect physiology, biochemistry, and pharmacology 3: 211–248.
79. Qin G, Jia M, Liu T, Xuan T, Yan Zhu K, et al. (2011) Identification and characterisation of ten glutathione S-transferase genes from oriental migratory locust,Locusta migratoria manilensis(Meyen). Pest management science 67: 697– 704.
Selection and Assessment of Reference Genes inLocusta migratoria