Submitted23 September 2015 Accepted 26 January 2016 Published11 February 2016
Corresponding author
Haiyan Lan, [email protected]
Academic editor Bernd Mueller-Roeber
Additional Information and Declarations can be found on page 17
DOI10.7717/peerj.1697
Copyright 2016 Cao et al.
Distributed under
Creative Commons CC-BY 4.0
OPEN ACCESS
Validation of reference genes for
quantitative RT-PCR normalization in
Suaeda aralocaspica, an annual halophyte
with heteromorphism and C4 pathway
without Kranz anatomy
Jing Cao, Lu Wang and Haiyan Lan
Xinjiang Key Laboratory of Biological Resources and Genetic Engineering, College of Life Science and Technology, Xinjiang University, Urumqi, China
ABSTRACT
Reverse transcription quantitative real-time polymerase chain reaction (qRT-PCR) is a powerful analytical technique for the measurement of gene expression, which depends on the stability of the reference gene used for data normalization.Suaeda aralocaspica, an annual halophyte with heteromorphic seeds and possessing C4 photosynthesis pathway without Kranz anatomy, is an ideal plant species to identify stress tolerance-related genes and compare relative expression at transcriptional level. So far, no molecular information is available for this species. In the present study, six traditionally used reference genes were selected and their expression stability in two types of seeds of
S. aralocaspicaunder different experimental conditions was evaluated. Three analytical programs, geNorm, NormFinder and BestKeeper, were used to assess and rank the stability of reference gene expression. Results revealed that although some reference genes may display different transcriptional profiles between the two types of seeds,
β-TUB andGAPDH appeared to be the most suitable references under different developmental stages and tissues.GAPDH was the appropriate reference gene under different germination time points and salt stress conditions, andACTIN was suitable for various abiotic stress treatments for the two types of seeds. For all the sample pools,
β-TUB served as the most stable reference gene, whereas18S rRNA and28S rRNA
performed poorly and presented as the least stable genes in our study.UBQseemed to be unsuitable as internal control under different salt treatments. In addition, the expression of a photosynthesis-related gene (PPDK) of C4 pathway and a salt tolerance-related gene (SAT) of S. aralocaspicawere used to validate the best performance reference genes. This is the first systematic comparison of reference gene selection for qRT-PCR work inS. aralocaspicaand these data will facilitate further studies on gene expression in this species and other euhalophytes.
SubjectsMolecular Biology, Plant Science
Keywords Reference gene, Quantitative RT-PCR,Suaeda aralocaspica, Abiotic stress, Normaliza-tion, Heteromorphism
INTRODUCTION
Suaeda aralocaspica, the only species ofBorszczowiasection ofSuaedagenus in the
soils in the southern margin of Junggar Basin in China (Li, 1979;Mao, 1994). It not only produces heteromorphic seeds with different forms and germination characteristics on a single plant (Wang et al., 2008), but also possesses unique C4 photosynthesis pathway without Kranz anatomy (Voznesenskaya et al., 2001), which allows the photosynthesis to perform within a single elongated chlorenchyma cell (Voznesenskaya, Franceschi & Edwards, 2004). More interestingly, the seedling ofS. aralocaspicashowed delayed developmental phenomenon to get through the harsh natural conditions (e.g., high salinity, remarkable daily temperature variation, strong light, etc.) in early spring (J Cao et al., 2016, unpublished data). All of these characteristics endowS. aralocaspicawith remarkably abiotic tolerance and high efficiency of photosynthesis; however, how can this species adapt to such a harsh environment, e.g., the molecular mechanism of the stress tolerance, is still poorly-understood.
To provide insight into these complex stress-responsive regulatory networks and identify stress-responded genes, high throughput gene expression analysis should be considered (Delporte et al., 2015). Reverse transcription quantitative real-time PCR (qRT-PCR) is one of the most widely used technologies to validate small sets of gene expression or the whole-genome microarray data, due to its high sensitivity and accuracy, good reproducibility, as well as the broad dynamic range for a limited number of target genes (Higuchi et al., 1993;Heid et al., 1996;Huggett et al., 2005). However, the accuracy of qRT-PCR remains influenced by many experimental variations (Bustin, 2002;Ginzinger, 2002;Udvardi, Czechowski & Scheible, 2008;Bustin et al., 2009); among them, selection of a constant expression reference gene for normalization is crucial for the acquisition of biological meaningful data (Thellin et al., 1999;Schmittgen & Zakrajsek, 2000). So far, the traditional reference genes involved in basic cellular maintenance such as 18S ribosomal RNA (18S rRNA), 28S ribosomal RNA (28S rRNA), cytoskeletal structural proteinβ-actin (ACTIN),β-tubulin (β-TUB), glyceraldehyde-3-phosphate dehydrogenase (GAPDH) and ubiquitin protein (UBQ) were largely used for quantification of mRNA expression in model plants, animals and human beings (Remans et al., 2008;Shen et al., 2010;Ponton et al., 2011;Du et al., 2013). However, several reports demonstrate that the copy of transcript of these genes does not always maintain stable under different experimental conditions (Bas et al., 2004;Czechowski et al., 2005;Exposito-Rodriguez et al., 2008;Tong et al., 2009;
Die et al., 2010;Zhu et al., 2013). If the chosen reference gene exhibits large expression fluctuation, the normalization will lead to inaccurate gene expression profile of target genes and inappropriate interpretation of biological data (Czechowski et al., 2005;Tong et al., 2009;Bustin et al., 2009;Artico et al., 2010). Therefore, it is essential to choose suitable reference genes for each species and ensure their stability under the specifically experimental conditions (Li et al., 2015).
stable reference genes in model plants (Remans et al., 2008;Schmidt & Delaney, 2010;
Lilly et al., 2011), important crop species (Kim et al., 2003;Jain et al., 2006;Jian et al., 2008;Hu et al., 2009;Paolacci et al., 2009;Janská et al., 2013;Lin et al., 2014), vegetables (Nicot et al., 2005;Die et al., 2010;Gantasala et al., 2013;Tian et al., 2015) and fruits (Reid et al., 2006;Tong et al., 2009;Chen et al., 2011;Clancy et al., 2013;Chen et al., 2015). However, only few studies have been conducted to identify the suitable reference genes in desert species (Li et al., 2012;Shi et al., 2012;Zhu et al., 2013;Yan et al., 2014;Li et al., 2015). To our knowledge, no work has been reported to evaluate reference genes for an euhalophyte in desert. In the present study, we cloned and evaluated the stability of six commonly used reference genes (18S rRNA,28S rRNA,ACTIN,TUB,GAPDH,UBQ) based on their expression abundance in two types of plants derived from heteromorphic seeds ofS. aralocaspica. Samples were collected from different tissues, developmental stages and various stress treatments. The best reference genes from the candidates were tested by normalizing expression of a C4 photosynthesis-related gene-pyruvate orthophosphate dikinase (PPDK) and a salinity tolerance-related gene-salt induced AAA-Type ATPase (SAT). qRT-PCR data were analyzed using three widely applied algorithms-geNorm, NormFinder and BestKeeper to determine sets of reference genes suitable forS. aralocaspicain different experimental conditions. Our work should facilitate future study on gene expression analysis inS. aralocaspicaand other euhalophytes, which will then improve our understanding of the molecular mechanisms of desert plant adaptation to salt stress.
MATERIAL AND METHODS
Plant materials and treatments
Mature seeds ofSuaeda aralocaspicawere collected from Gurbantunggut Desert of Xinjiang Uyghur Autonomous Region of China (Wujiaqu 103 regiment, 44◦29′821′′N,
87◦31′181′′E) in October, 2014. Seeds were naturally air-dried indoor, then cleaned and
sieved to remove the impurities, and stored at 4 ◦C in brown paper bag until use.
Seed germination
Four replicates with 45 seeds of each of the two morphs ofS. aralocaspicawere sown on two layers of moist filter paper in a 9-cm Petri dish and exposed to different stress conditions to evaluate the stability of the tested reference genes. 40 germinated (brown) or non-germinated (black) seeds of each sample were collected on day 1 and 7 after sowing, dry seed at day 0 was used as control. The stress treatments included salinity, drought, low temperature (conditions experienced byS. aralocaspicain its natural habitat), ABA and H2O2(factors used in alteration of gene expression in plants). Filter paper was
saturated with 6 mL of distilled water or the following aqueous solutions: 300 mM NaCl, 20% (w/v) polyethylene glycol (PEG) 6000, 1µM ABA and 0.01% H2O2, respectively.
All Petri dishes were kept in an illumination incubator (RXZ-5000C, Ningbo Jiangnan Instrument Factory, China) at constant 25 ◦C (or 10 ◦C in low temperature stress) and a
Seedling growth
S. aralocaspicaseeds were sown in pots containing perlite: vermiculite (1:3) under a 16 h light/8 h dark photoperiod at a temperature regime of 24–30 ◦C, 10–20% relative
humidity and a light source of 500–700µmol/m2/s. Before sowing, the black seeds were
stratified for 10 d according toWang et al. (2008)to synchronize seed germination. Subsequently, the brown and black seeds were sown at the same time. Seedlings were cultivated with half-strength Hoagland solution (Arnon & Hoagland, 1940) containing 100, 300, 500 mM NaCl, half-strength Hoagland solution only was used as control. For salt treatment, only two cotyledons of the seedling were collected as sample in the presence of various salt concentrations on day 15 after seedling emergence. For different tissues, samples were collected from cotyledons, stem and root of seedling in the absence of salt on day 15 after emergence. For different developmental stages, samples were collected from the whole seedling grown in the absence of salt on day 3, 15, 30 and 60 after emergence. All samples were immediately frozen in liquid nitrogen on harvesting and stored at−80 ◦C prior to RNA extraction.
RNA extraction and cDNA synthesis
Total RNA was extracted by using RNAprep Pure Plant Kit (Tiangen, Beijing, China) according to the manufacture’s instructions. The ratios of absorbance at 260 nm to that of 280 nm (260/280) or 230 nm (260/230) were used to assess the purity of RNA using a Nanodrop ND-1000 UV Spectrophotometer (Thermo Fisher Scientific, Waltham, MA, USA), only RNA samples with a 260/280 ratio between 1.9 and 2.1 and 260/230 ratio higher than 2.0 were used for subsequent analysis. RNA integrity was visualized via 1% (w/v) agarose gel electrophoresis with two clear bands of 28S/18S ribosomal RNA. Each reverse transcription reaction was performed with 1µg of total RNA in a final volume
of 20µL by using M-MLV RTase cDNA Synthesis Kit (D6130, TaKaRa, Shiga, Japan)
with 2.5µM oligo(dT) and 5µM random hexamer primer following the manufacturer’s
instructions. cDNA was stored at−20 ◦C before proceeding to the next step.
Cloning the partial sequences of the candidate reference genes
Based on previously reported qRT-PCR reference gene in Arabidopsis, we selected six commonly used reference genes spanning a range of biological functions as candidates inS. aralocaspica: 18S ribosomal RNA (18S), 28S ribosomal RNA (28S), cytoskeletal structural proteinβ-actin (ACTIN),β-tubulin (β-TUB), glyceraldehyde-3-phosphate dehydrogenase (GAPDH) and ubiquitin protein (UBQ). According to the published sequences in Amaranthaceae or Caryophyllales, the partial sequences of the six candidate genes were obtained from homology-based cloning. The EST fragments of pyruvate orthophosphate dikinase gene (PPDK) and salt-induced AAA-Type ATPase gene (SAT), which were screened from our previously transcriptomic data ofS. aralocaspica(J Cao et al., 2016, unpublished data), were used as the target genes for reference gene validation.
PCR reaction was performed using TaKaRa TaqTM (TaKaRa, Shiga, Japan) at the conditions as follows: 35 cycles with denaturation at 94 ◦C for 30 s, annealing at 55–
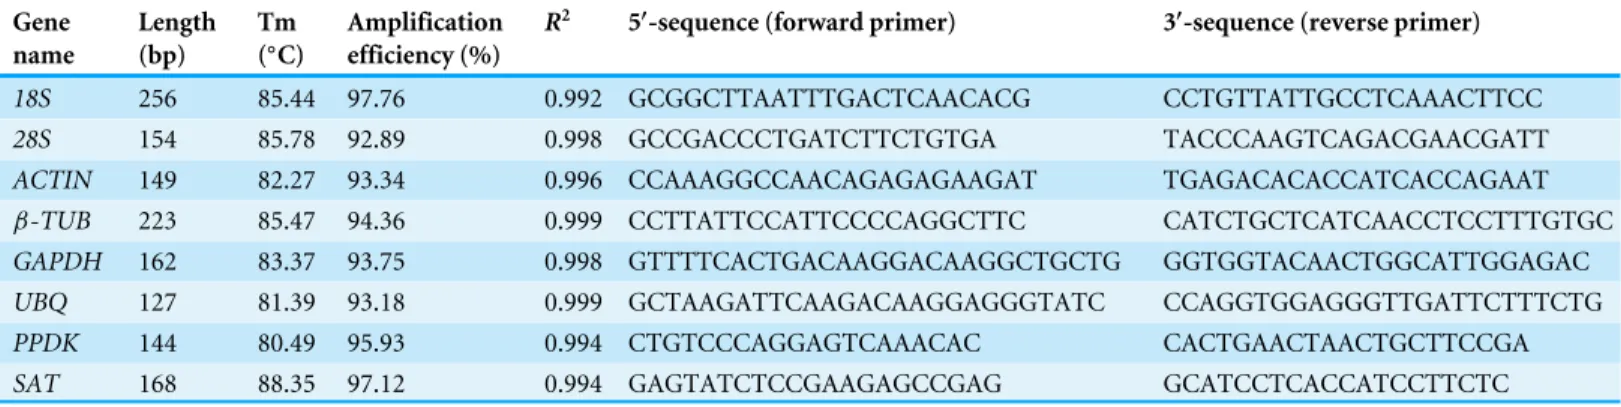
Table 1 Gene-specific primers and amplicon characteristics of candidate reference genes and target genes used in qRT-PCR analysis.
Gene name
Length (bp)
Tm (◦C)
Amplification efficiency (%)
R2 5′-sequence (forward primer) 3′-sequence (reverse primer)
18S 256 85.44 97.76 0.992 GCGGCTTAATTTGACTCAACACG CCTGTTATTGCCTCAAACTTCC
28S 154 85.78 92.89 0.998 GCCGACCCTGATCTTCTGTGA TACCCAAGTCAGACGAACGATT
ACTIN 149 82.27 93.34 0.996 CCAAAGGCCAACAGAGAGAAGAT TGAGACACACCATCACCAGAAT
β-TUB 223 85.47 94.36 0.999 CCTTATTCCATTCCCCAGGCTTC CATCTGCTCATCAACCTCCTTTGTGC
GAPDH 162 83.37 93.75 0.998 GTTTTCACTGACAAGGACAAGGCTGCTG GGTGGTACAACTGGCATTGGAGAC
UBQ 127 81.39 93.18 0.999 GCTAAGATTCAAGACAAGGAGGGTATC CCAGGTGGAGGGTTGATTCTTTCTG
PPDK 144 80.49 95.93 0.994 CTGTCCCAGGAGTCAAACAC CACTGAACTAACTGCTTCCGA
SAT 168 88.35 97.12 0.994 GAGTATCTCCGAAGAGCCGAG GCATCCTCACCATCCTTCTC
30 s, and extension at 72 ◦C for 30 s; an initial denaturation step of 5 min at 94 ◦C and
a final elongation step at 72 ◦C for 10 min were performed. Amplicons were purified
using the TIANgen Midi Gel Purification Kit (Tiangen, China) and cloned into pMDTM
18-T vector (TaKaRa, Shiga, Japan) according to manufacturer’s instructions. Positive colonies containing recombinant plasmids were then sent to Beijing Genomics Institute (Beijing, China) for DNA sequencing. The resulting DNA sequence was used to query the appropriate databases using the BLAST algorithm of NCBI (Table S1).
Specific primer design and quantitative real-time PCR
Based on the gene sequence obtained from homology-based cloning, all gene-specific primer sets for qRT-PCR were designed using DNAMAN 5.0 according to the following requirements: the amplicon size is from 100 to 300 bp and the Tm value is about 60 ±5 ◦C (Table 1). Amplification efficiency was evaluated using a standard curve generated
by qRT-PCR using a ten-fold dilution series over at least four dilution gradients with three replicates of each. Primer specificity was confirmed by gel electrophoresis and melting-curve analysis based on qRT-PCR performance.
qRT-PCR reaction was performed using GoTaqR qPCR Master Mix (Promega,
Madi-son, WI, USA) in the GeneAmpR 7500 Real-Time PCR System (ABI, Vernon, CA, USA).
The reaction mixture consisted of 1µL cDNA samples, 0.5µL of each of the forward
and reverse primers (10 µM), 10µL GoTaqR qPCR master mix and 8 µL nuclease-free
water in a final volume of 20µL. Four biological replicates with two technical replicates of
each for all samples were applied. The qRT-PCR was performed as follows: 2 min initial denaturation at 95 ◦C, 40 cycles of 95 ◦C for 15 s and 60 ◦C for 1 min. The crossing cycle
number (CT) of each reaction was automatically determined by the GeneAmpR 7500
software with default parameters.
Statistical analysis of gene expression stability
For geNorm, the raw CT value was imported into Microsoft Excel first, and trans-formed into relative expression level using the formulaQ=2(min CT−sample CT)(the
maximum expression level of each gene was used as control and was assigned a value of 1) and then introduced into geNorm (version 3.5). The expression stability value (M) for each gene and the pairwise variation value (V) of the target gene with other genes were further calculated using geNorm algorithm. All of the tested genes were ranked according to theirMvalues (the cutoff ofM value was set as 1.5, the lower value suggests the more stable gene expression) and then the optimal number of reference genes for normalization was determined. NormFinder employed the same input file format as geNorm, while the BestKeeper analysis was based on the untransformed CT values.
Normalization of the target genes
To assess the validity of the programs used in ranking the reference genes above,PPDK
andSAT gene ofS. aralocaspica, which were characterized in ‘Cloning the partial sequences of the candidate reference genes’ section, were used as the target genes. The expression level of these genes was quantified using the most stable reference genes determined by geNorm, NormFinder and BestKeeper. Samples were collected from seedlings or seeds in germination treated by 300 mM NaCl for 0, 1 and 7 d. The relative expression level of target gene can be quantified according to the mathematical model
R=2−11CT(Shi & Chiang, 2005), where11CT=1CT
target sample−1CTcontrol sample,
1CTsample=CTtest gene−CTreference gene. The final value of relative quantification was
described as fold change of gene expression in the test sample compared to control. Data were expressed as mean±SE of eight replicates for each sample.
RESULTS
Verification of amplicon and primer specificity and amplification efficiency
To identify the stability of reference genes for gene expression analysis ofS. aralocaspica,
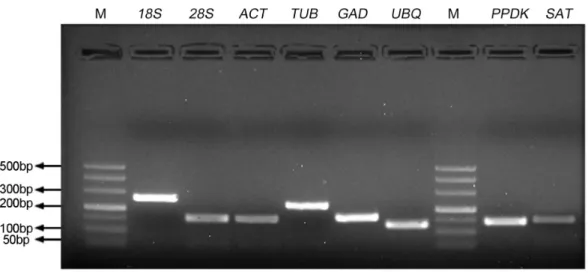
the qRT-PCR assay was performed with the proper fragment of six candidate reference genes (18S rRNA, 28S rRNA, ACTIN,β-TUB, GAPDHandUBQ). Only a single band of each amplicon was generated from cDNA samples with the size from 127 bp to 256 bp (Fig. 1). They shared 84%–100% identity with the corresponding gene sequences from other plant species (Tabl S1). A single peak melting curve in qRT-PCR confirmed the specific amplification (Fig. S1). The efficiency of qPCR reaction varied from 92.89 for
28S rRNAto 97.76 for18S rRNA, and correlation coefficient ranged from 0.992 (for18S rRNA) to 0.999 (forβ-TUBandUBQ), respectively (Table 1).
Expression profiles of candidate reference genes
Figure 1 Specificity of primer pairs for qRT-PCR amplification.The mixture of equal amount of cD-NAs from all tested samples was used as the template. 3.0% agarose gel electrophoresis visualized the spe-cific amplification for each reference gene with the expected size. M stands for DNA size marker.
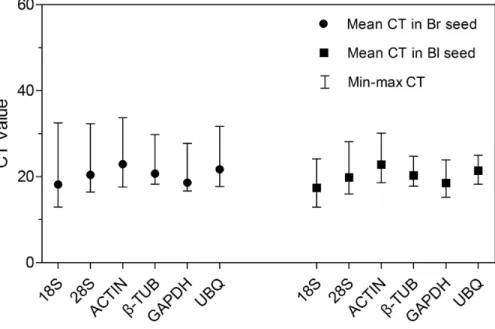
(Fig. 2;Table S2). The cycle threshold (CT,Bustin et al., 2009) value for the six genes ranged from 12.95 to 33.73, while the majority of these values were between 17 and 23 in all tested samples.ACTIN showed the highest mean CT value (22.92 and 22.84 in brown and black seeds, respectively), which represented a relatively lower expression level. By contrast,18S rRNAdisplayed high expression level compared to other reference genes in brown seed (CT=18.20) and black seed (CT=17.42). Among them,β-TUBand
UBQshowed smaller gene expression variation (below 7 cycles) among studied reference genes in black seed, whereas18S rRNA,28S rRNAandACTIN displayed much higher expression variation (more than 15 cycles;Table S2) among all studied genes in brown seed. The wide range variation in expression of the six tested reference genes suggests that each reference gene will not keep a constant expression level in different samples of
S. aralocaspica, and selection of the reliable reference gene to normalize gene expression under certain condition is needed.
Expression stability of candidate reference genes
Since the six candidate reference genes showed wide variation in expression level in different sample sets, it is necessary to use statistical method to rank the stability of these genes and determine the least reference gene number in normalization for accurate gene expression profiling under given conditions. In the present study, three most widely used algorithms, geNorm, NormFinder and BestKeeper were employed in the analysis.
GeNorm analysis
The expression stability value (M) for each reference gene is calculated based on the average pairwise variation value with other genes by geNorm algorithm. Stepwise exclusion of the least stable gene allows the genes to be ranked according to theirM
Figure 2 CT values of qRT-PCR for the six candidate reference genes.Expression level of each reference gene displayed as CT values in all treatments in brown and black seeds, respectively. The medium, maxi-mum and minimaxi-mum CT values of each sample were calculated. Four biological replicates with two techni-cal replicates of each for all samples were applied. Bl, black; Br, brown.
expression stability is. The results achieved with geNorm algorithm are showed inFig. 3. For all the tested samples,β-TUBandGAPDH (for brown seed) orACTIN andβ-TUB
(for black seed) were the two most stable genes, whereas28S rRNAwas the least stable in both types of seeds (Fig. 3A). Theβ-TUBandGAPDH were proved to be the best candidates for normalization in two types of seeds at different developmental stages (Fig. 3B), salt treatments (Fig. 3C) and different tissues (Fig. 3D). However,ACTIN (for brown seed) and28S rRNA(for black seed) were shown to be the least stable genes at different developmental stages and tissues (Figs. 3Band3D), whileUBQwas the least stable gene under salt treatment (Fig. 3C). For different germination time points,ACTIN
andGAPDH (for brown seed) orβ-TUBandGAPDH (for black seed) were the most stable genes, while28S rRNAwas the least stable (Fig. 3E). For stress treatment samples,
ACTIN andGAPDH (for brown seed) orACTIN andβ-TUB(for black seed) were the two most stable genes, while28S rRNAwas the least stable (Fig. 3F). Combining above analysis,GAPDH (for brown seed) andβ-TUB(for black seed) were the most stable reference genes in six different sample sets.
The optimal number of reference gene required for accurate normalization was
Figure 3 Gene expression stability and ranking of six reference genes based on geNorm algorithm.The cutoffMvalue is proposed to be 1.5, a lowerMvalue indicates more stable expression. The least stable genes are on the left, and the most stable ones are on the right. (A) All tested sam-ples; (B) different developmental stages; (C) different salt concentrations; (D) different seedling tissues (root, stem, and leaf); (E) different germina-tion time points; (F) different abiotic stresses. Bl, black; Br, brown.
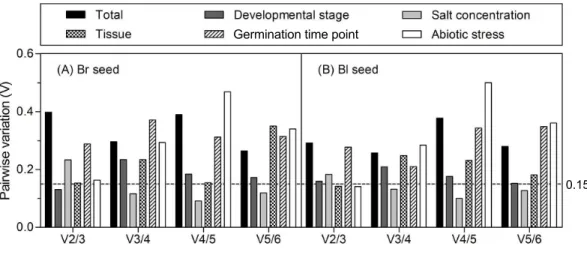
taken into account, all of the pairwise variations were higher than 0.15, suggesting that none of the combination was good enough for data normalization, much better reference genes should be included. For samples from the different developmental stages, theV2/3 was 0.131 in brown and 0.159 in black seed, respectively, which indicates that the third reference had no significant effect in both types of seeds and was not necessary to include. For different tissues, theV2/3 was 0.153 and 0.142 in brown and black seeds, respectively. Similar results were found for the different abiotic stresses with theV2/3 value slightly higher than 0.15 in brown seed (0.163) and lower in black seed (0.141), suggesting that two references were sufficient for normalizing data with different tissues and under abiotic stress conditions. For theV3/4 value below 0.15, three references were sufficient for normalizing gene expression in two types of seeds under salt stress condition.
NormFinder analysis
Figure 4 Pairwise variation (V) analyses of the candidate reference genes.The pairwise variation (Vn/n+1) was analyzed for the normalization factors NFnand NFn+1 by the geNorm program to determine the optimal number of reference genes for accurate normalization. The cutoff value was proposed to be 0.15, below which the inclusion of an additional reference gene is not necessary. Bl, black; Br, brown.
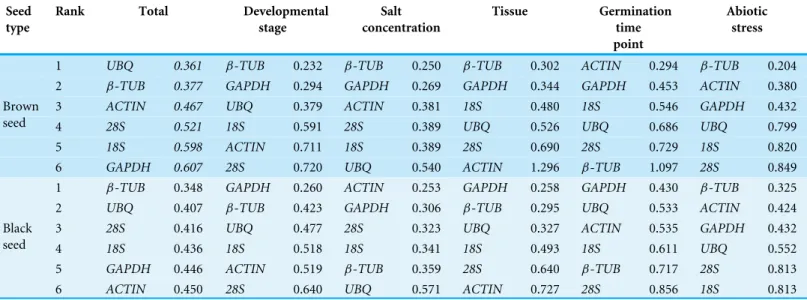
reference genes according to the stability of their expression patterns: a lower value means a good expression stability. The results of the Normfinder analysis of our data sets were summarized inTable 2. For all the samples pooled together, NormFinder identifiedUBQ
(ranked 2nd and 3rd in brown and black seeds, respectively by geNorm) andβ-TUB
(ranked 1st in both types of seeds by geNorm) were the most stable genes, whileGAPDH
(ranked 1st and 2nd in brown and black seeds, respectively by geNorm) was the least stable gene in both types of seeds. For samples from different developmental stages and tissues,β-TUBandGAPDH were suggested to be the most stable genes in both types of seeds (similar to geNorm), whileACTIN and28S rRNAbecame the least stable genes with slight change in the ranking order compared to geNorm. For different salt concentration, NormFinder algorithm revealed thatβ-TUBandGAPDH (for brown seed) orACTIN
andGAPDH (for black seed) were the most stable genes, whileUBQwas the least stable gene. These results were consistent with those obtained by geNorm, except forβ-TUBin black seed (the rank changed from 1st in geNorm to 5th in NormFinder). For different germination time points, NormFinder analysis indicated thatACTIN andGAPDH (for brown seed) orGAPDH andUBQ(for black seed) were the most stable genes, while
28S rRNAandβ-TUB(ranked 1st and 3rd in black and brown seeds, respectively by geNorm) were the least stable genes in both types of seeds. For abiotic stress,β-TUBand
ACTIN were the most stable genes in both types of seeds, while with a slight difference in ranking order compared to geNorm, such asβ-TUBranking from 2nd in geNorm to 1st in NormFinder in brown seed. Notably, both geNorm and NormFinder revealed that
Table 2 Candidate genes ranked according to their expression stability value estimated by NormFinder.
Seed type
Rank Total Developmental stage
Salt concentration
Tissue Germination time point
Abiotic stress
1 UBQ 0.361 β-TUB 0.232 β-TUB 0.250 β-TUB 0.302 ACTIN 0.294 β-TUB 0.204
2 β-TUB 0.377 GAPDH 0.294 GAPDH 0.269 GAPDH 0.344 GAPDH 0.453 ACTIN 0.380
3 ACTIN 0.467 UBQ 0.379 ACTIN 0.381 18S 0.480 18S 0.546 GAPDH 0.432
4 28S 0.521 18S 0.591 28S 0.389 UBQ 0.526 UBQ 0.686 UBQ 0.799
5 18S 0.598 ACTIN 0.711 18S 0.389 28S 0.690 28S 0.729 18S 0.820
Brown seed
6 GAPDH 0.607 28S 0.720 UBQ 0.540 ACTIN 1.296 β-TUB 1.097 28S 0.849
1 β-TUB 0.348 GAPDH 0.260 ACTIN 0.253 GAPDH 0.258 GAPDH 0.430 β-TUB 0.325
2 UBQ 0.407 β-TUB 0.423 GAPDH 0.306 β-TUB 0.295 UBQ 0.533 ACTIN 0.424
3 28S 0.416 UBQ 0.477 28S 0.323 UBQ 0.327 ACTIN 0.535 GAPDH 0.432
4 18S 0.436 18S 0.518 18S 0.341 18S 0.493 18S 0.611 UBQ 0.552
5 GAPDH 0.446 ACTIN 0.519 β-TUB 0.359 28S 0.640 β-TUB 0.717 28S 0.813
Black seed
6 ACTIN 0.450 28S 0.640 UBQ 0.571 ACTIN 0.727 28S 0.856 18S 0.813
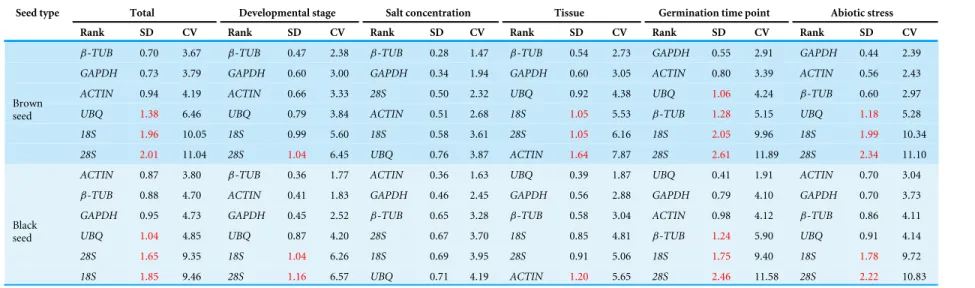
BestKeeper analysis
The BestKeeper index is based on the average CT value of each duplicated reaction. The variation in gene expression is calculated based on the standard deviation (SD) and coefficient of variance (CV). Genes with the lowest SD and the lowest CV values are the most stable. Any proposed reference gene with an SD > 1 is considered to be inconsistent and should be excluded. In the present study, the ranking of the candidate genes are shown inTable 3. For samples from the total and different developmental stages,β-TUB
andGAPDH (for brown seed) orACTIN andβ-TUB(for black seed) were the most stable genes; for salt treatment,β-TUBandGAPDH (for brown seed) orACTIN and
GAPDH (for black seed) were the most stable genes; for different tissues,β-TUBand
GAPDH (for brown seed) orUBQandGAPDH (for black seed) were the most stable genes; for different germination time points,GAPDH andACTIN (for brown seed) or
UBQandGAPDH (for black seed) showed the most stable expression; for stress treatment samples,GAPDH andACTIN (for brown seed) orACTIN andGAPDH (for black seed) were the most stable genes. These results were largely consistent with those obtained from geNorm and NormFinder. However, due to the different statistical algorithms of three methods, there were some differences in the reference ranking order. It is notable that28S rRNAwas the least stable gene in all three algorithms, except for the salt treatment sample (summarized inTable S3).
Validation of the best performance reference genes
Table 3 Candidate genes ranking according to the expression stability value calculated by BestKeeper.
Seed type Total Developmental stage Salt concentration Tissue Germination time point Abiotic stress
Rank SD CV Rank SD CV Rank SD CV Rank SD CV Rank SD CV Rank SD CV
β-TUB 0.70 3.67 β-TUB 0.47 2.38 β-TUB 0.28 1.47 β-TUB 0.54 2.73 GAPDH 0.55 2.91 GAPDH 0.44 2.39
GAPDH 0.73 3.79 GAPDH 0.60 3.00 GAPDH 0.34 1.94 GAPDH 0.60 3.05 ACTIN 0.80 3.39 ACTIN 0.56 2.43
ACTIN 0.94 4.19 ACTIN 0.66 3.33 28S 0.50 2.32 UBQ 0.92 4.38 UBQ 1.06 4.24 β-TUB 0.60 2.97
UBQ 1.38 6.46 UBQ 0.79 3.84 ACTIN 0.51 2.68 18S 1.05 5.53 β-TUB 1.28 5.15 UBQ 1.18 5.28
18S 1.96 10.05 18S 0.99 5.60 18S 0.58 3.61 28S 1.05 6.16 18S 2.05 9.96 18S 1.99 10.34
Brown seed
28S 2.01 11.04 28S 1.04 6.45 UBQ 0.76 3.87 ACTIN 1.64 7.87 28S 2.61 11.89 28S 2.34 11.10
ACTIN 0.87 3.80 β-TUB 0.36 1.77 ACTIN 0.36 1.63 UBQ 0.39 1.87 UBQ 0.41 1.91 ACTIN 0.70 3.04
β-TUB 0.88 4.70 ACTIN 0.41 1.83 GAPDH 0.46 2.45 GAPDH 0.56 2.88 GAPDH 0.79 4.10 GAPDH 0.70 3.73
GAPDH 0.95 4.73 GAPDH 0.45 2.52 β-TUB 0.65 3.28 β-TUB 0.58 3.04 ACTIN 0.98 4.12 β-TUB 0.86 4.11
UBQ 1.04 4.85 UBQ 0.87 4.20 28S 0.67 3.70 18S 0.85 4.81 β-TUB 1.24 5.90 UBQ 0.91 4.14
28S 1.65 9.35 18S 1.04 6.26 18S 0.69 3.95 28S 0.91 5.06 18S 1.75 9.40 18S 1.78 9.72
Black seed
18S 1.85 9.46 28S 1.16 6.57 UBQ 0.71 4.19 ACTIN 1.20 5.65 28S 2.46 11.58 28S 2.22 10.83
Cao
e
t
al.
(2016),
P
eerJ
,
DOI
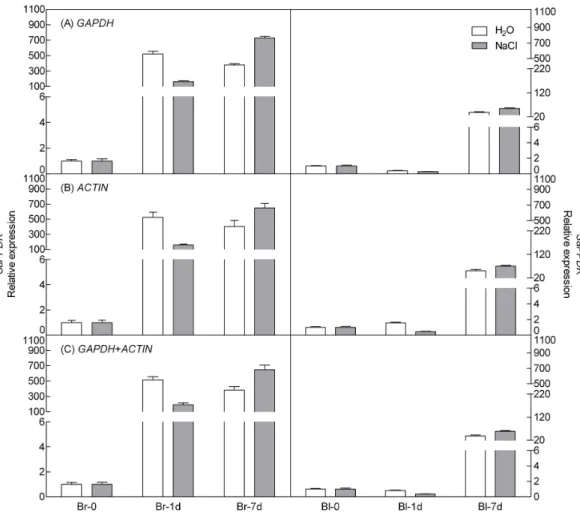
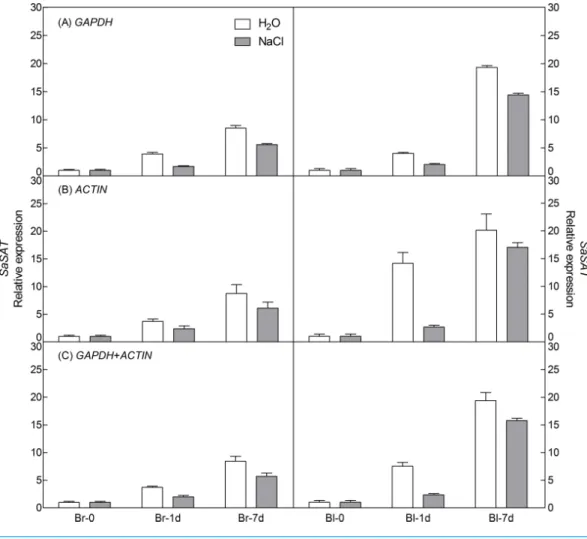
points),ACTIN (under abiotic stress) and their combination (GAPDH +ACTIN) for normalization (Figs. 5and6). The stability of these two reference genes were further confirmed by three algorithms when combined germination time point with abiotic stress together (Table S4). The analysis revealed that the transcript abundance of these two target genes increased significantly during germination in both types of seeds. The relative expression profile of each gene was much similar across the experimental sets when normalized usingGAPDHorACTIN, orGAPDH +ACTIN, although they showed a slight difference. However, asFigs. 5and6showed, the relative transcript abundance for each target gene was dependent on the reference gene(s) used for normalization. When the expression of these two genes was normalized using a combination ofGAPDH and
ACTIN, which was identified as the most stable references by geNorm, the fold change was between those obtained by using eitherGAPDH orACTIN as the single reference gene. This result clearly indicated that the utilization of more than one reference gene in normalization provided a more accurate representation of target gene expression when tested across variable experimental conditions and reinforced the importance of reference gene validation prior to experimental application.
DISCUSSION
Suaeda aralocaspicahas evolved different mechanisms to cope with the harsh environ-ments, e.g., single-cellular C4 photosynthesis pathway, seed heteromorphism, require-ment of salinity for optimal growth, etc. (Voznesenskaya et al., 2001;Wang et al., 2008;Cao et al., 2015). However, the molecular mechanisms underpinning salt tolerance are not well understood. Transcriptional analysis with qRT-PCR is meaningful to reveal the function of stress tolerance-related genes, and which can highly improve the quantification of gene expression profiles (Fan et al., 2013;Yan et al., 2014). Previous studies have demonstrated that appropriate internal reference genes are the prerequisite to ensure accurate qRT-PCR analysis (Li et al., 2015), and different references should be employed for different species or in different experimental treatments (Løvdal & Lillo, 2009;Chen et al., 2011;Zhu et al., 2013). However, the direct transfer of traditional and proposed novel candidate reference genes to non-model plants are hampered by the limited availability of genomic sequences, e.g., the desert plant species in Amaranthaceae family. Therefore, in the present study, we analyzed a set of commonly used housekeeping genes in C4 halophyteS. aralocaspicafor the normalization of gene expression analysis using qRT-PCR for the first time. Results indicate thatβ-TUB,GAPDH andACTIN appeared to be the top three reference genes in most of the tested sample sets, while18Sand28S rRNAwere always ranked poorly and seemed to be unsuitable for using as internal control inS. aralocaspica.
Figure 5 Relative quantification ofPPDKexpression using the selected reference gene(s).Relative ex-pression ofPPDKwas normalized using the single most stable reference geneGAPDH(A),ACTIN(B) and their combinationGAPDH+ACTIN(C) in sample sets under 300 mM NaCl treatment. Bl, black seed; Br, brown seed.
Figure 6 Relative quantification ofSATexpression using the selected reference gene(s). Relative ex-pression ofSATwas normalized using the single most stable reference geneGAPDH(A),ACTIN(B) and their combinationGAPDH+ACTIN(C) in sample sets under 300 mM NaCl treatment. Bl, black seed; Br, brown seed.
stress conditions, andACTIN was suitable for various stress treatments. Previous studies showed thatGAPDH was unstable in different tissues or experimental conditions (Jain et al., 2006;Marino et al., 2008;Løvdal & Lillo, 2009), while other study in Arabidopsis revealed thatGAPDH was ranked among the 100 most stably expressed genes, whereas
TUB6 andACT2has never represented in the top 100 (Czechowski et al., 2005). These results suggest that there is no universal reference gene for all plant species. However, no matter how the rank of gene stability changed,18S rRNAand28S rRNAin the present study were always the least reliable genes based on three algorithms. It was found that the most unstable genes would almost remain the same in all sample sets (Exposito-Rodriguez et al., 2008;Artico et al., 2010;Lin & Lai, 2010;Wan et al., 2010).
the optimal control gene number in different experiment series (cut-off value around 0.15), which indicated that only salt-stressed samples need a third gene to normalize gene expression, i.e., adding18S rRNA(for brown seed) orACTIN (for black seed) in combination withβ-TUBandGAPDH to calculate a normalization factor. However, it has also been suggested that this cut-off value is too strict (Vandesompele et al., 2002). So, in our work, although the values ofVn/n+1 were slightly more than 0.15 in different developmental stages (V2/3=0.159 for black seed), tissues (V2/3=0.153 for brown seed) and abiotic stresses (V2/3=0.163 for brown seed), they were still staying within an acceptable range for heterogeneous sample sets (Hellemans et al., 2007;Chen et al., 2015). In addition, the inclusion of a third gene is not in correspondence with a decrease of the
V value (Fig. 4). Thus, two best-scored genes should be sufficient for the normalization of gene expression in this case.
behavior ofS. aralocaspica, in which as salt concentration increasing from 0 to 600 mM NaCl, the germination rate of heteromorphic seeds decreased significantly (Wang et al., 2008). Nevertheless, when the least stable reference gene18Sor28SRNA was used for normalization (Fig. S3), the transcript level ofSaPPDK andSaSAT (at 7th day of germination) in both types of seeds was 50-fold or 30-fold higher, respectively than that of using the most stable reference genes, which may lead to misinterpretation of target gene expression level. Taken all together, our results confirmed that the most stable reference genes (GAPDH andACTIN) identified in current study could be used for the normalization of gene expression under salt stress at different germination time points for both types of seeds ofS. aralocaspica.
Seed heteromorphism is thought to be a bet-hedging strategy for plants to adapt to environmental stress (Venable, 1985;Weber, 2009).S. aralocaspicaproduces dimorphic seeds with disparate forms and different germination characteristics: after imbibition for 8 h (our observation), the brown seed can reach approximately 100% germination percentage (Song et al., 2012); while the black seed germinates after 24–72 h of imbibition (our observation) and only to a very low percentage (Wang et al., 2008). In our previous study, the difference of transcriptional profiles between dimorphic seeds in germination process was revealed (J Cao et al., 2016, unpublished data). The results indicated that the expression of a large proportion of genes changed significantly at 3 h in brown seed whereas 8 h in black seed after imbibition, which means that a series of physiological and biochemical events in germination may take place earlier in brown seed than that in black seed, and the transcriptional change was much greater in brown seed than that of black seed. Among the differential expressed transcript-derived fragments (TDF) identified with known sequences in the database, two commonly used reference genes,
GAPDH and translation initiation factor (eIF-4α) were also detected in both types of seeds ofS. aralocaspica(J Cao et al., 2016, unpublished data), which suggests that not only the germination-related genes but also the housekeeping genes may display different transcriptional profiles between the brown and black seeds. Consistently, in current study, the three most suitable reference genes showed different performance in two types of seeds under various conditions (Table S3). However, the different characteristics shown in germination between dimorphic seeds ofS. aralocaspicawill not be transferred to the descendants, and which will soon disappear in later seedling stage and present no significant difference in growth and physiological responses in the descendants with or without salinity (Cao et al., 2015).
ADDITIONAL INFORMATION AND DECLARATIONS
Funding
study design, data collection and analysis, decision to publish, or preparation of the manuscript.
Grant Disclosures
The following grant information was disclosed by the authors:
National Natural Science Foundation of China: 31060027, 31260037, 31460043.
Project for Training Young Talents of Xinjiang Uygur Autonomous Region: 2013721013. Open Funding of the Xinjiang Key Laboratory of Biological Resources and Genetic Engineering: XJDX0201-2011-03.
Competing Interests
The authors declare there are no competing interests.
Author Contributions
• Jing Cao conceived and designed the experiments, performed the experiments, analyzed the data, contributed reagents/materials/analysis tools, wrote the paper, prepared figures and/or tables, reviewed drafts of the paper.
• Lu Wang conceived and designed the experiments, performed the experiments, analyzed the data, reviewed drafts of the paper.
• Haiyan Lan conceived and designed the experiments, contributed reagents/materials/-analysis tools, wrote the paper, reviewed drafts of the paper.
Data Availability
The following information was supplied regarding data availability: We have uploaded the raw data asData S1andS2.
Supplemental Information
Supplemental information for this article can be found online athttp://dx.doi.org/10. 7717/peerj.1697#supplemental-information.
REFERENCES
Andersen CL, Jensen JL, Orntoft TF. 2004.Normalization of real time quantitative
reverse transcription-PCR data: a model-based variance estimation approach to identify genes suited for normalization, applied to bladder and colon cancer data sets.Cancer Research64:5245–5250DOI 10.1158/0008-5472.CAN-04-0496.
Arnon DI, Hoagland DR. 1940.Crop production in artificial culture solutions and in
soils with special reference to factors influencing yields and absorption of inorganic nutrients.Soil Science50:463–485.
Artico S, Nardeli SM, Brilhante O, Grossi-de-Sa MF, Alves-Ferreira M. 2010.
Identi-fication and evaluation of new reference genes inGossypium hirsutumfor accurate normalization of real-time quantitative RT-PCR data.BMC Plant Biology10:49–61
Bas A, Forsberg G, Hammarstrom S, Hammarstrom ML. 2004.Utility of the housekeeping genes 18S rRNA, beta-actin and glycerol dehyde-3-phosphate-dehydrogenase for normalization in real-time quantitative reverse transcriptase-polymerase chain reaction analysis of gene expression in human T lymphocytes.
Scandinavian Journal of Immunology59:566–573
DOI 10.1111/j.0300-9475.2004.01440.x.
Bustin SA. 2002.Quantification of mRNA using real-time reverse transcription PCR
(RT-PCR): trends and problems.Journal of Molecular Endocrinology29:23–39
DOI 10.1677/jme.0.0290023.
Bustin SA, Benes V, Garson JA, Hellemans J, Huggett J, Kubista M, Mueller R, Nolan T,
Pfaffl MW, Shipley GL, Vandesompele J, Wittwer CT. 2009.The MIQE guidelines:
minimum information for publication of quantitative real-time PCR experiments.
Clinical Chemistry55:611–622DOI 10.1373/clinchem.2008.112797.
Cao J, Lv XY, Chen L, Xing JJ, Lan HY. 2015.Effects of salinity on the growth, physiology
and gene expression of an annual halophyte grown from heteromorphic seeds.AoB Plants7:plv112DOI 10.1093/aobpla/plv112.
Chen J, Li X, Wang D, Li L, Zhou H, Liu Z, Wu J, Wang P, Jiang X, Fabrice MR,
Zhang S, Wu J. 2015.Identification and testing of reference genes for gene
expres-sion analysis in pollen ofPyrus bretschneideri.Scientia Horticulturae190:43–56
DOI 10.1016/j.scienta.2015.04.010.
Chen L, Zhong HY, Kuang JF, Li JG, Lu WJ, Chen JY. 2011.Validation of reference
genes for RT-qPCR studies of gene expression in banana fruit under different experimental conditions.Planta234:377–390DOI 10.1007/s00425-011-1410-3.
Clancy MA, Rosli HG, Chamala S, Barbazuk WB, Civello PM, Folta KM. 2013.
Vali-dation of reference transcripts in strawberry (Fragaria spp.).Molecular Genetics and Genomics288:671–681DOI 10.1007/s00438-013-0780-6.
Czechowski T, Stitt M, Altmann T, Udvardi MK, Scheible WR. 2005.Genome-wide
identification and testing of superior reference genes for transcript normalization inArabidopsis.Plant Physiology139:5–17DOI 10.1104/pp.105.063743.
Delporte M, Legrand G, Hilbert JL, Gagneul D. 2015.Selection and validation of
refer-ence genes for quantitative real-time PCR analysis of gene expression inCichorium intybus.Frontiers in Plant Science 6:651DOI 10.3389/fpls.2015.00651.
Die JV, Roman B, Nadal S, Gonzalez-Verdejo C. 2010.Evaluation of candidate reference
genes for expression studies inPisum sativumunder different experimental condi-tions.Planta232:145–153DOI 10.1007/s00425-010-1158-1.
Du Y, Zhang L, Xu F, Huang B, Zhang G, Li L. 2013.Validation of housekeeping genes
as internal controls for studying gene expression during Pacific oyster (Crassostrea gigas) development by quantitative real-time PCR.Fish & Shellfish Immunology
34:939–945DOI 10.1016/j.fsi.2012.12.007.
Edwards GE, Nakamoto H, Burnell JN, Hatch MD. 1985.Pyruvate, Pi dikinase and
NADP-malate dehydrogenase in C4 photosynthesis: properties and mechanism of light/dark regulation.Annual Review of Plant Physiology36:255–286
Exposito-Rodriguez M, Borges AA, Borges-Perez A, Perez JA. 2008.Selection of internal control genes for quantitative real-time RT-PCR studies during tomato development process.BMC Plant Biology8:131–142DOI 10.1186/1471-2229-8-131.
Fan C, Ma J, Guo Q, Li X, Wang H, Lu M. 2013.Selection of reference genes for
quantitative real-time PCR in bamboo (Phyllostachys edulis).PLoS ONE8:e56573
DOI 10.1371/journal.pone.0056573.
Gantasala NP, Papolu PK, Thakur PK, Kamaraju D, Sreevathsa R, Rao U. 2013.
Selec-tion and validaSelec-tion of reference genes for quantitative gene expression studies by real-time PCR in eggplant (Solanum melongenaL).BMC Research Notes6:312–322
DOI 10.1186/1756-0500-6-312.
Ginzinger DG. 2002.Gene quantification using real-time quantitative PCR: an emerging
technology hits the mainstream.Experimental Hematology 30:503–512
DOI 10.1016/S0301-472X(02)00806-8.
Gutierrez L, Mauriat M, Guénin S, Pelloux J, Lefebvre JF, Louvet R, Rusterucci
C, Moritz T, Guerineau F, Bellini C, Van Wuytswinkel O. 2008.The lack of a
systematic validation of reference genes: a serious pitfall undervalued in reverse tran-scription polymerase chain reaction (RT-PCR) analysis in plants.Plant Biotechnology
6:609–618DOI 10.1111/j.1467-7652.2008.00346.x.
Hanson PI, Whiteheart SW. 2005.AAA+proteins: have engine, will work.Nature
Reviews Molecular Cell Biology6:519–529DOI 10.1038/nrm1684.
Heid CA, Stevens J, Livak KJ, Williams PM. 1996.Real time quantitative PCR.Genome
Research6:986–994 DOI 10.1101/gr.6.10.986.
Hellemans J, Mortier G, De Paepe A, Speleman F, Vandesompele J. 2007.qBase
relative quantification framework and software for management and automated analysis of real-time quantitative PCR data.Genome Biology8:R19
DOI 10.1186/gb-2007-8-2-r19.
Higuchi R, Fockler C, Dollinger G, Watson R. 1993.Kinetic PCR analysis: realtime
monitoring of DNA amplification reactions.Biotechnology11:1026–1030
DOI 10.1038/nbt0993-1026.
Ho LW, Yang TT, Shieh SS, Edwards GE, Yen HE. 2010.Reduced expression of a vesicle
trafficking-related ATPaseSKD1decreases salt tolerance inArabidopsis.Functional Plant Biology 37:962–973DOI 10.1071/FP10049.
Hu R, Fan C, Li H, Zhang Q, Fu YF. 2009.Evaluation of putative reference genes for
gene expression normalization in soybean by quantitative real-time RT-PCR.BMC Molecular Biology 10:93–104DOI 10.1186/1471-2199-10-93.
Huggett J, Dheda K, Bustin S, Zumla A. 2005.Real-time RT-PCR normalisation;
strategies and considerations.Genes and Immunity6:279–284
DOI 10.1038/sj.gene.6364190.
Hurkman WJ. 1992.Effect of salt stress on plant gene expression: a review.Plant and Soil
146:145–151DOI 10.1007/BF00012007.
Hýsková VD, Miedzińska L, Dobrá J, Vankova R, Ryšlavá H. 2014.
involved in the acclimation ofNicotiana tabacumL. to drought stress.Journal of Plant Physiology171:19–25DOI 10.1016/j.jplph.2013.10.017.
Jain M, Nijhawan A, Tyagi AK, Khurana JP. 2006.Validation of housekeeping genes
as internal control for studying gene expression in rice by quantitative real-time PCR.Biochemical and Biophysical Research Communications345:646–651
DOI 10.1016/j.bbrc.2006.04.140.
Janská A, Hodek J, Svoboda P, Zámečník J, Prášil IT, Vlasáková E, Milella L, Ovesná
J. 2013.The choice of reference gene set for assessing gene expression in barley
(Hordeum vulgareL.) under low temperature and drought stress.Molecular Genetics and Genomics288:639–649DOI 10.1007/s00438-013-0774-4.
Jian B, Liu B, Bi Y, Hou W, Wu C, Han T. 2008.Validation of internal control for gene
expression study in soybean by quantitative real-time PCR.BMC Molecular Biology
9:59–72DOI 10.1186/1471-2199-9-59.
Jou Y, Chou P, He M, Hung Y, Yen HE. 2004.Tissue-specific expression and functional
complementation of a yeast potassium-uptake mutant by a salt-induced ice plant genemcSKD1.Plant Molecular Biology 54:881–893DOI 10.1007/s11103-004-0335-7.
Kim BR, Nam HY, Kim SU, Kim SI, Chang YJ. 2003.Normalization of reverse
tran-scription quantitative-PCR with housekeeping genes in rice.Biotechnology Letters
25:1869–1872DOI 10.1023/A:1026298032009.
Kosová K, Vítámvás P, Prášil IT, Renaut J. 2011.Plant proteome changes under abiotic
stress-contribution of proteomics studies to understanding plant stress response.
Journal of Proteomics74:1301–1322DOI 10.1016/j.jprot.2011.02.006.
Li AR. 1979.Flora of China. Vol.25. Beijing: Science and Technology Press, 157–186 (in
Chinese).
Li XS, Yang HL, Zhang DY, Zhang YM, Wood AJ. 2012.Reference gene selection in the
desert plantEremosparton songoricum.International Journal of Molecular Sciences
13:6944–6963DOI 10.3390/ijms13066944.
Li XS, Zhang DY, Li HY, Gao B, Yang HL, Zhang YM, Wood AJ. 2015.Characterization
of reference genes for RT-qPCR in the desert mossSyntrichia caninervisin response to abiotic stress and desiccation/rehydration.Frontiers in Plant Science6:38
DOI 10.3389/fpls.2015.00038.
Lilly ST, Drummond RS, Pearson MN, Macdiarmid RM. 2011.Identification and
validation of reference genes for normalization of transcripts from virus-infected
Arabidopsis thaliana.Molecular Plant-Microbe Interactions24:294–304
DOI 10.1094/MPMI-10-10-0236.
Lin YL, Lai ZX. 2010.Reference gene selection for qPCR analysis during somatic
embryogenesis in longan tree.Plant Science178:359–365
DOI 10.1016/j.plantsci.2010.02.005.
Lin Y, Zhang C, Lan H, Gao S, Liu H, Liu J, Cao M, Pan G, Rong T, Zhang S.
2014.Validation of potential reference genes for qPCR in maize across abiotic
stresses, hormone treatments, and tissue types.PLoS ONE9:e95445
Løvdal T, Lillo C. 2009.Reference gene selection for quantitative real-time PCR normal-ization in tomato subjected to nitrogen, cold, and light stress.Analytical Biochemistry
387:238–242DOI 10.1016/j.ab.2009.01.024.
Mao ZM. 1994.Flora of Xinjiang. Vol.2. Urumqi: Xinjiang Science and Technology
Press, 84–106 (in Chinese).
Marino ER, Borges AA, Perez AB, Perez JA. 2008.Selection of internal control genes for
quantitative real-time RT-PCR studies during tomato development process.BMC Plant Biology 8:131–142DOI 10.1186/1471-2229-8-131.
Michalowski CB, Olson SW, Piepenbrock M, Schmitt JM, Bohnert HJ. 1989.Time
course of mRNA induction elicited by salt stress in the common ice plant Mesem-bryanthemum crystallinum.Plant Physiology89:811–816DOI 10.1104/pp.89.3.811.
Nicot N, Hausman JF, Hoffmann L, Evers D. 2005.Housekeeping gene selection for
real-time RT-PCR normalization in potato during biotic and abiotic stress.Journal of Experimental Botany 56:2907–2914DOI 10.1093/jxb/eri285.
Omoto E, Taniguchi M, Miyake H. 2012.Adaptation responses in C4
photo-synthesis of maize under salinity.Journal of Plant Physiology169:469–477
DOI 10.1016/j.jplph.2011.11.009.
Paolacci A, Tanzarella O, Porceddu E, Ciaffi M. 2009.Identification and validation of
reference genes for quantitative RT-PCR normalization in wheat.BMC Molecular Biology10:11–37DOI 10.1186/1471-2199-10-11.
Pfaffl MWTA, Prgomet C, Neuvians TP. 2004.Determination of stable housekeeping
genes, differentially regulated target genes and sample integrity: BestKeeper-Excel-based tool using pairwise correlations.Biotechnology Letters26:509–515
DOI 10.1023/B:BILE.0000019559.84305.47.
Ponton F, Chapuis MP, Pernice M, Sword GA, Simpson SJ. 2011.Evaluation of
potential reference genes for reverse transcription-qPCR studies of physiological responses inDrosophila melanogaster.Journal of Insect Physiology 57:840–850
DOI 10.1016/j.jinsphys.2011.03.014.
Reid KE, Olsson N, Schlosser J, Peng F, Lund ST. 2006.An optimized grapevine
RNA isolation procedure and statistical determination of reference genes for real-time RT-PCR during berry development.BMC Plant Biology6:27–37
DOI 10.1186/1471-2229-6-27.
Remans T, Smeets K, Opdenakker K, Mathijsen D, Vangronsveld J, Cuypers A. 2008.
Normalisation of real-time RT-PCR gene expression measurements in Arabidop-sis thalianaexposed to increased metal concentrations.Planta227:1343–1349
DOI 10.1007/s00425-008-0706-4.
Schmidt GW, Delaney SK. 2010.Stable internal reference genes for normalization
of real-time RT-PCR in tobacco (Nicotiana tabacum) during development and abiotic stress.Molecular Genetics and Genomics283:233–241
DOI 10.1007/s00438-010-0511-1.
Schmittgen TD, Zakrajsek BA. 2000.Effect of experimental treatment on housekeeping
Shen Y, Li Y, Ye F, Wang F, Lu W, Xie X. 2010.Identification of suitable reference genes for measurement of gene expression in human cervical tissues.Analytical Biochemistry405:224–229DOI 10.1016/j.ab.2010.06.029.
Shi R, Chiang VL. 2005.Facile means for quantifying microRNA expression by real-time
PCR.Biotechniques39:519–525DOI 10.2144/000112010.
Shi J, Liu M, Shi J, Zheng G, Wang Y, Wang J, Chen Y, Lu C, Yin W. 2012.Reference
gene selection for qPCR inAmmopiptanthus mongolicusunder abiotic stresses and expression analysis of seven ROS-scavenging enzyme genes.Plant Cell Reports
31:1245–1254DOI 10.1007/s00299-012-1245-9.
Song YG, Li L, Zhang XM, Pan XL, Zeng XH. 2012.Differences of seed coat structure
and ions content between dimorphic seeds ofBorszczowia aralocaspica.Bulletin of Botanical Research32:290–295 (in Chinese).
Thellin O, Zorzi W, Lakaye B, DeBorman B, Coumans B, Hennen G, Grisar T, Igout A,
Heinen E. 1999.Housekeeping genes as internal standards: use and limits.Journal of
Biotechnology75:291–295DOI 10.1016/S0168-1656(99)00163-7.
Tian C, Jiang Q, Wang F, Wang GL, Xu ZS, Xiong AS. 2015.Selection of suitable
reference genes for qPCR normalization under abiotic stresses and hormone stimuli in carrot leaves.PLoS ONE 10:e0117569DOI 10.1371/journal.pone.0117569.
Tong Z, Gao Z, Wang F, Zhou J, Zhang Z. 2009.Selection of reliable reference genes
for gene expression studies in peach using real-time PCR.BMC Molecular Biology
10:71–83DOI 10.1186/1471-2199-10-71.
Udvardi MK, Czechowski T, Scheible WR. 2008.Eleven golden rules of quantitative
RT-PCR.The Plant Cell Online20:1736–1737DOI 10.1105/tpc.108.061143.
Vandesompele J, De Preter K, Pattyn F, Poppe B, Van Roy N, De Paepe A,
Spele-man F. 2002.Accurate normalisation of real-time quantitative RT-PCR data by
geometric averaging of multiple internal control genes.Genome Biology3:1–12
DOI 10.1186/gb-2002-3-7-research0034.
Venable DL. 1985.The evolutionary ecology of seed heteromorphism.The American
Naturalist 126:557–595.
Voznesenskaya EV, Franceschi VR, Edwards GE. 2004.Light-dependent development
of single Cell C4 photosynthesis in cotyledons ofBorszczowia aralocaspica (Chenopo-diaceae) during transformation from a storage to a photosynthetic organ.Annals of Botany93:177–187 DOI 10.1093/aob/mch026.
Voznesenskaya EV, Franceschi VR, Kiirats O, Freitag H, Edwards GE. 2001.Kranz
anatomy is not essential for terrestrial C4 plant photosynthesis.Nature414:543–546
DOI 10.1038/35107073.
Wan HJ, Zhao ZG, Qian CT, Sui YH, Malik AA, Chen JF. 2010.Selection of appropriate
reference genes for gene expression studies by quantitative real-time poly-merase chain reaction in cucumber.Analytical Biochemistry399:257–261
DOI 10.1016/j.ab.2009.12.008.
Wang L, Huang ZY, Baskin CC, Baskin JM, Dong M. 2008.Germination of
di-morphic seeds of the desert annual halophyteSuaeda aralocaspica (Chenopo-diaceae), a C4 plant without Kranz anatomy.Annals of Botany102:757–769
Weber DJ. 2009. Adaptive mechanisms of halophytes in desert regions. In: Ashraf M, Öztürk MA, Athar HR, eds.Salinity and water stress: improving crop efficiency. New York: Springer Verlag, 179–185.
Wei L, Miao H, Zhao R, Han X, Zhang T, Zhang H. 2013.Identification and testing of
reference genes for Sesame gene expression analysis by quantitative real-time PCR.
Planta237:873–889DOI 10.1007/s00425-012-1805-9.
Xie FL, Xiao P, Chen DL, Xu L, Zhang BH. 2012.miRDeepFinder: a miRNA analysis
tool for deep sequencing of plant small RNAs.Plant Molecular Biology 80:75–84
DOI 10.1007/s11103-012-9885-2.
Yan X, Dong X, Zhang W, Yin HX, Xiao HL, Chen P, Ma XF. 2014.Reference gene
selection for quantitative real-time PCR normalization inReaumuria soongorica.
PLoS ONE9:e104124DOI 10.1371/journal.pone.0104124.
Zhu JF, Zhang LF, Li WF, Han SY, Yang WH, Qi LW. 2013.Reference gene selection for