Quantitative PCR in CD4
+
Lymphocytes from Asthmatics
with or without Depression
Ting Wang1, Zong-An Liang1, Andrew J. Sandford2, Xing-Yu Xiong1, Yin-Yin Yang1, Yu-Lin Ji1*, Jian-Qing He1*
1Department of Respiratory Medicine, West China Hospital of Sichuan University, Chengdu, Sichuan Province, People’s Republic of China,2The UBC James Hogg Research Centre, Institute for Heart+Lung Health, St. Paul’s Hospital, University of British Columbia, Vancouver, British Columbia, Canada
Abstract
Objective:No optimal housekeeping genes (HKGs) have been identified for CD4+T cells from non-depressive asthmatic and depressive asthmatic adults for normalizing quantitative real-time PCR (qPCR) assays. The aim of present study was to select appropriate HKGs for gene expression analysis in purified CD4+T cells from these asthmatics.
Methods:Three groups of subjects (Non-depressive asthmatic, NDA, n = 10, Depressive asthmatic, DA, n = 11, and Healthy control, HC, n = 10 respectively) were studied. qPCR for 9 potential HKGs, namely RNA, 28S ribosomal 1 (RN28S1), ribosomal protein, large, P0 (RPLP0), actin, beta (ACTB), cyclophilin A (PPIA), glyceraldehyde-3-phosphate dehydrogenase (GAPDH), phosphoglycerate kinase 1 (PGK1), beta-2-microglobulin (B2M), glucuronidase, beta (GUSB) and ribosomal protein L13a (RPL13A), was performed. Then the data were analyzed with three different applications namely BestKeeper, geNorm, and NormFinder.
Results:The analysis of gene expression data identifiedB2MandRPLP0as the most stable reference genes and showed that the level ofPPIA was significantly different among subjects of three groups when the two best HKGs identified were applied. Post-hoc analysis by Student-Newman-Keuls correction shows that depressive asthmatics and non-depressive asthmatics exhibited lower expression level ofPPIAthan healthy controls (p,0.05).
Conclusions:B2MandRPLP0were identified as the most optimal HKGs in gene expression studies involving human blood CD4+T cells derived from normal, depressive asthmatics and non-depressive asthmatics. The suitability of using thePPIA gene as the HKG for such studies was questioned due to its low expression in asthmatics.
Citation:Wang T, Liang Z-A, Sandford AJ, Xiong X-Y, Yang Y-Y, et al. (2012) Selection of Suitable Housekeeping Genes for Real-Time Quantitative PCR in CD4+ Lymphocytes from Asthmatics with or without Depression. PLoS ONE 7(10): e48367. doi:10.1371/journal.pone.0048367
Editor:Kazuhiro Ito, National Heart and Lung institute, United Kingdom
ReceivedJune 8, 2012;AcceptedSeptember 24, 2012;PublishedOctober 24, 2012
Copyright:ß2012 Wang et al. This is an open-access article distributed under the terms of the Creative Commons Attribution License, which permits unrestricted use, distribution, and reproduction in any medium, provided the original author and source are credited.
Funding:This study was supported by grants No. 31071008, 81171320 from National Natural Science Foundation of China. The funders had no role in study design, data collection and analysis, decision to publish, or preparation of the manuscript.
Competing Interests:The authors have declared that no competing interests exist. * E-mail: [email protected] (J-QH); jiyulin@ 63. (Y-LJ)
Introduction
It has been proposed that a spectrum of psychological conditions such as depressive disorders occurs at high frequencies in asthmatics [1], and are associated with poor control and worse asthma-related quality of life [2], but the underlying pathophys-iological mechanisms that account for this relationship have yet to be elucidated [3]. Since the initial studies of the roles of T cells in the pathogenesis of asthma [4,5], our understanding of the CD4+
T lymphocyte in the immunopathology of this disease has greatly advanced over the past decades, involving not only the classic Th1 and Th2 cells, but also new proinflammatory and suppressive T-cell subsets [6]. Meanwhile, accumulating evidence suggests that CD4+T cells may influence susceptibility to depression as well as
its treatment outcomes [7]. Thus, the CD4+ T lymphocyte is
emerging as a potentially attractive cell in which to seek novel
insights into the pathogenesis of asthma with or without depression and to identify new therapeutic targets.
The comparison of gene expression profiling of CD4+T cells in
rigorous validation of the most stable HKGs in different tissues or cells and/or disease status before commencement of any qPCR study. Before comparison of gene expression profiling of CD4+
T cells in pure asthmatics or depressive asthmatics, this requirement must be met. However, there have been no studies that have systematically compared the stability of common HKGs in such conditions.
In the present study, we carried out a careful evaluation of 9 HKGs in uncultured human CD4+
T cells derived from healthy individuals, non-depressive asthmatics and depressive asthmatics. After analysis and comparison using three different statistical methods,B2Mand RPLP0were identified as the most suitable HKGs for gene expression studies in uncultured CD4+
T cells of asthmatics with or without depression.
Materials and Methods
Patients
Three groups of subjects were studied: asthmatics with depression (Depressive asthmatics, DA), asthmatics without depression, (Non-depressive asthmatics, NDA) and Healthy controls (HC). Patients of DA group (n = 11) and NDA group (n = 10) were enrolled from the outpatient clinic of the West China Hospital of Sichuan University from September 2011 to January 2012 as a cross-sectional study. All patients had symptoms consistent with diagnosis of asthma and demonstrated evidence of bronchodilator reversibility of .12% and 200 mL in forced expiratory volume in 1 s (FEV1) following 400mg of inhaled
salbutamol or provocative dose of methacholine causing a 20% drop in FEV1 (PD20FEV1) ,2.5 mg. A bronchial challenge test
was performed for all of the patients, except one from the NDA group and four from the DA group who had an FEV1predicted
less than 70%. Atopic status was determined by a positive skin prick test result using 14 common aeroallergens, including Dermatophagoides, animal hair, cockroach, pollens,Platane, Saccharo-myces, Penicillium, cigarette, cotton fibre and feather. All patients answered a detailed respiratory health and general history questionnaire. The depression status was evaluated by the same psychiatrist using the Hamilton Rating Scale for Depression
(HRSD) [9], which is observer-rated and a score$8 was used as a cut-off point for comorbid depressive symptoms. The clinical control of asthma was assessed with Asthma Control Test (ACT) [10] and health-related quality of life was appraised with the Standardized Version of the Asthma Quality of Life Questionnaire (AQLQs) [11]. HC subjects (n = 10) with no significant medical conditions were recruited by advertisement.
Subjects were excluded if they had been taking oral glucocorti-costeroids within 4 weeks of the blood draw. Other exclusion criteria included uncontrolled asthma or change in maintenance therapy, acute respiratory tract infection within 4 weeks, and current smoking. The present study received approval from the West China Hospital Institutional Review Board and all partic-ipants gave written informed consent.
Purification of CD4+T lymphocytes from Adult Blood We obtained up to 10 mL whole blood from each subject and specimens were shipped from the clinic to a processing laboratory within 1 hour of collection and handled in exactly the same manner by the same technician. Lymphocyte suspensions were separated by Lymphoprep (Axis-Shield PoC AS, Oslo, Norway) from a distinct band at the sample interface. CD4+
T Lympho-cytes were purified by immunomagnetic depletion with the human CD4+T Cell Isolation Kit II (Miltenyi Biotec, Rostock, Germany).
The mean6SD number of total lymphocytes was 22.8765.68 million. After separation, each sample yielded,2.4 million CD4+
T cells and 1 million cells were used for RNA extraction from each sample. Furthermore, our pilot studies have confirmed that the CD4+
T cell population isolated by this method has a purity of over 94%, which was shown by flow cytometry (Figure 1).
Selection of Reference Gene Candidates
Eleven HKGs from the endogenous control panel genes recommended by Applied Biosystems (http://www. appliedbiosystems.com/) were initially selected. 18 S ribosomal RNA (RNR1) was replaced by RNA, 28 S ribosomal 1 (RN28S1) due to their stable expression ratio in integrated RNA samples and the availability of RN28S1 assay in our laboratory. Ribosomal protein L13a (RPL13A) was added because it was a stable
Figure 1. Flow cytometry analysis on CD4+ T cells in lymphocyte suspension and in purified CD4+cells by immunomagnetic
depletion with the human CD4+T Cell Isolation Kit II.
Cells were directly stained with conjugated fluorescently labeled antibodies for CD4 (BD Biosciences) in lymphocyte suspension and in purified CD4+samples.
expression gene in CD4+
cells from a previous study [12]. Among of the 12 genes selected, hypoxanthine ribosyltransferase (HPRT1), TATA-binding protein (TBP) and transferrin receptor (TFRC) have low expression levels in the CD4+
cells and whole blood therefore they were omitted from the final list (http://www. genecards.org/).
Nine housekeeping genes were examined, including RN28S1, ribosomal protein, large, P0 (RPLP0), actin, beta (ACTB), cyclophilin A (PPIA), glyceraldehyde-3-phosphate dehydrogenase (GAPDH), phosphoglycerate kinase 1 (PGK1), beta-2-microglobulin (B2M), glucuronidase, beta (GUSB), andRPL13A. The full name, function and accession number of the candidate HKGs evaluated in the present study are listed in Table 3. Special attention was paid to selecting candidate genes that show a diversity of function, which significantly reduces the chance that genes might be co-regulated.
RNA Extraction and Complementary DNA Preparation
Total RNA was isolated using Trizol (Invitrogen, Carlsbad, California, USA) following the manufacturer’s protocol. RNA integrity was assessed on the basis of demonstration of distinct 28 s and 18 s ribosomal RNA bands following 1% agarose electro-phoresis and the 28 S RNA was approximately twice as intense as the 18 S rRNA. Complementary DNA (cDNA) synthesis was carried out using the RevertAidTMfirst strand cDNA synthesis kit (Fermentas Inc, Burlington, Canada). Template RNA and 1mL of random hexamer primers (10mM) in a total volume of 12mL were incubated for 5 min at 65uC and chilled on ice. After adding 4mL of 56reaction buffer, 1mL of RiboLockTM RNase Inhibitor (20 U/mL), 2mL of dNTP Mix (10 mM), 1mL of RevertAidTM M-MuLV Reverse Transcriptase (200 U/mL), the incubation step for 5 min at 25uC, followed by reverse transcriptase incubation for 60 min at 42uC, termination of the reaction by heating at 70uC for 5 min, finally cooling to 4uC before storage at220uC. The cDNA for assays ofACTB,GAPDH,B2M,PPIAandRPLP0was diluted 1:25 because these genes were highly expressed in pilot studies; while assays of RN28S1, GUSB, RPL13A and PGK1 were performed using cDNA diluted 1:15 because they had relatively low expression levels.
Real-time Quantitative PCR
The expression analysis for all 9 genes was performed using an FTC 2000 qPCR system (Funglyn Biotech Inc, Scarborough, Canada), PCR primers and TaqMan probes were obtained from Shanghai biological engineering corporation, China (see Table 4 for primer sequences). The reactions were performed according to the manufacturer’s instructions with minor modifications. Briefly, 2mL template cDNA was used in a final PCR reaction volume of 30mL, containing 0.3mL of 5 U/mL Taq DNA polymerase, 3mL of 25 mM MgCl2, 0.36mL of 25 mM dNTP, (TAKARA Bio Group, Dalian, China), 1mL of 10mM of each forward and reverse primer and probe. The conditions for the PCR included for 2 min at 94uC followed by 45 cycles of real-time PCR with 3-segment amplification, including 20 s at 94uC for denaturation, 20 s at 52uC (RN28S1,PPIA,GAPDHandRPL13A), 54uC (RPLP0, ACTB,GUSB) or 56uC (PGK1andB2M) for annealing, and 30 s at 60uC for polymerase elongation. All reactions were performed in triplicate, with non-template controls and standard curves which were generated using four serial dilution points (in steps of 10-fold) of stock cDNAs for each gene. The threshold cycle (Ct) was manually determined from amplification plots. TheDCt value for each sample was obtained by subtracting the Ct values of the highest relative quantities for each gene, and was converted into
relative gene expression by the amplification efficiency (2 = 100%) to the2DCt power.
Statistical Analysis
In order to identify the optimal reference genes among the candidates, three different tools called BestKeeper, geNorm, and NormFinder based on specific algorithms were used. The Best-Keeper [13] and geNorm [14] determines the optimal HKGs by performing similar pair-wise correlation approach. The Norm-Finder produces a comparison of the rankings by a model-based approach and focuses on estimating both the overall variation of the reference genes and the variation between subgroups [15].
Clinical data are reported as mean 6 SD for normally distributed data and median (range) for nonparametric data. Descriptive statistics of the 8 HKGs were computed by Best-Keeper.
The comparisons of gene expression levels and demographic characteristics of the participants between subgroups were performed by using the one-way ANOVA (two tailed) for parametric data, Kruskal-Wallis H test for nonparametric data and Student-Newman-Keuls test for multiple comparisons. All analyses were conducted with SPSS software, version 18.0 (IBM Corp, New York, USA).P,0.05 was considered significant.
Results
Subjects
Characteristics of the three groups of participants are summa-rized in Table 1. By design, all 3 groups (NDA, n = 1, DA, n = 11, and HC, n = 10) were similar in sex and age distribution. All subjects were non-smokers or former smokers and there were only two former smokers, one in NDA group and the other in NC group. Both of them have quitted at least 10 years and had smoked cigarette 4.5 and 0.5 pack-years, respectively. All medications were discontinued for a minimum of 2 weeks before recruitment. In detail, one patient from the NDA group and two from DA group inhaled inhaled corticosteroid (ICS) + Long-acting b2-agonists
(LABA). However, all of them used ICS+LABA for a maximum of 1 month and discontinued at least 4 weeks before blood was drawn. Four patients from the NDA group and three from the DA group took theophylline, and one patient from each group took antileukotrienes orally. However, the medications were discontin-ued at least 2 weeks before the experiment.
There were significant differences between subgroups in FEV1% predicted, FEV1/forced vital capacity (FVC) %, the
proportion having anaphylactic history and total immunoglobulin E (IgE) present in each sample. Age, sex, body mass index (BMI), the proportion of participants who were atopic, number of eosinophils and the proportion of eosinophils did not differ among the three groups. There were no significant differences in demographic characteristics such as PD20FEV1 and asthma
severity, etc. between NDA and DA groups (see Table 1 for detail).
Expression Levels of Candidate HKGs
therefore, this subject was excluded. The final analysis contained 28 samples for 8 HKGs (Table 2).
Expression Stability within HKGs
HKG stability was evaluated using three different Excel-based tools, BestKeeper, geNorm and NormFinder. The BestKeeper was used to rank the candidates’ stability by performing a pair-wise comparative analysis across HKGs. All 8 candidate HKGs showed strong correlation (0.69,r,0.93) and were combined into an index. Subsequently, the correlations between each HKG and the index were computed. The highest Pearson correlation coefficient (r) value for the relationship between the index and the contributing HKGs was obtained forRPLP0(r =0.93,P =0.001) (Figure 2).
The geNorm applet calculates a gene expression stability M based on the geometric average V between all tested genes. All 8 studied genes had M values below the default limit of 1.5, which demonstrated that all genes tested had high expression stability. After stepwise exclusion of the worst-scoring HKGs, B2M and
ACTBwere identified as the two most stably expressed genes in the studied samples (Figure 3).
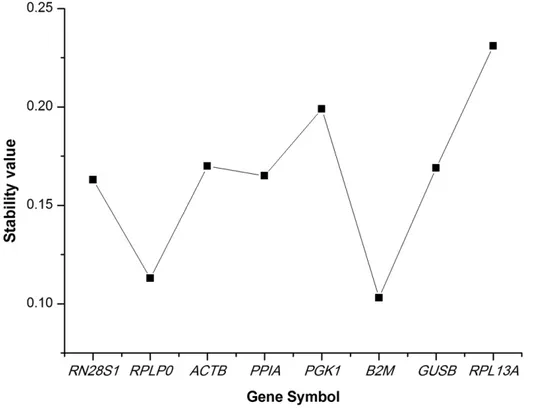
Finally, the NormFinder program was used to rank candidate HKG stability. This applet uses a model-based approach to estimate the intragroup and intergroup expression variation, and then combines them into a stability value that makes ranking the candidate genes across different disease status possible. The best gene identified by this program wasB2M(Figure 4), and the best combination of two genes was B2M and RPLP0. Although the order of stability of the studied genes differed slightly among the 3 applets, the top 2 ranked genes exhibited similarly.
Expression Levels of Candidate HKGs in Three Groups of Subjects
BothB2MandRPLP0were the top two most stable HKGs as generated by the three different analytical methods. Thus, a normalization factor (NF) based on the geometric mean of the expression level of the best-performing HKGs was calculated by geNorm to compare the expression levels of the other candidate HKGs in the three subgroups. The results show that, before
Table 1.Demographic characteristics of the participants.
Clinical characteristic Non-depressive asthmatics Depressive asthmatics Healthy controls
N 10 11 10
Sex, male:female 3:7 2:9 2:8
Age (y)a 33.70
610.58 34.1869.41 30.667.41
BMI, kg/m2a 23.10
62.50 22.2662.28 22.1363.25
Ex-smoker, n (%) 1 (10) 0 (0) 1 (10)
Non-smoker, n (%) 9 (90) 11 (100) 9 (90)
Atopy, n (%) 7 (70) 4 (36.4) 4 (40)
FEV1% predicteda,c 91.12615.69 82.28617.07 116.86615.21
FVC% predicteda,d 97.31
611.20 95.55611.36 107.64614.28
FEV1/FVC%a,c 79.2968.90 74.23611.10 88.3865.90
PD20FEV1Methacholine (mg)b 0.50 (0.08–2.47) 0.94 (0.31–2.30) –
ACT scorea 16.10
64.84 14.9162.70 –
Anaphylactic history, n (%)c 8 (80) 6 (54.5) 1 (10)
GINA severity
Mild, n (%) 1 (10) 0 (0) –
Moderate, n (%) 5 (50) 4 (36.4) –
Severe, n (%) 4 (40) 7 (63.6) –
AQLQa 4.45
60.87 3.9660.68 –
Eosinophils (109/L)b 0.24 (0.06–0.57) 0.20 (0.06–1.22) 0.15 (0.02–0.49)
Eosinophils (%)b 4.35 (1.10–10.5) 5.10 (1.6–14.1) 2.45 (0.3–11.6)
Total IgE (IU/ml)b,c 190.88 (34.17–1002.29) 63.82 (0.05–547.81) 44.41 (8.11–189.05)
Asthma medication used in past year (discontinued at least 2 weeks before recruitment)
ICS+LABA, n (%) 1 (10) 2 (18.18) –
Theophylline, n (%) 4 (40) 3 (27.27) –
Antileukotrienes, n (%) 1 (10) 1 (9.09) –
amean
6SD;
bmedian (range); cP
,0.05;
dP= 0.073; BMI, body mass index; FEV
1, forced expiratory volume in 1 s; FVC, forced vital capacity; ACT, Asthma control test; GINA, Global initiative for asthma; AQLQ,
Asthma quality of life questionnaire; Ig, immunoglobulin; PD20FEV1, provocative dose of methacholine causing a 20% drop in FEV1; ICS, inhaled corticosteroid; LABA,
Long-actingb2-agonists.
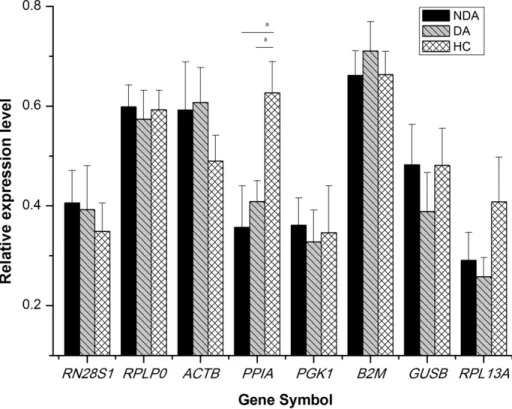
normalization, the expression levels were not significantly different among the three groups for all candidate genes. After normaliza-tion, the expression levels of PPIA were significantly different between the three groups; Post hoc analysis by Student-Newman-Keuls test shows that depressive asthmatics and non-depressive asthmatics exhibited lower expression levels ofPPIAthan healthy controls (p,0.05) (Figure 5).
Discussion
The literature [6] overwhelmingly confirms that CD4+T cells
play an important role in the occurrence and development of asthma, and an increasing amount of evidence [7,16] supports the concept that these cells also influence susceptibility to depression. The results of the present study will enable meaningful interpre-tation of data from expression studies that use purified CD4+
T cells, and therefore can help understanding of underlying mechanisms.
Real-time quantitative PCR is a routinely used technique to measure transcript abundance with great sensitivity, specificity and reproducibility. Nevertheless, exact normalization of gene expres-sion levels is an absolute prerequisite for reliable results of qPCR quantification methods.
This study demonstrates the use of three different Excel-based applets to identify the most stable HKGs in the studied population. Expression stability for a single sample or each HKG was investigated using BestKeeper first. All of the studied 28 samples had low InVar fold level. An InVar value of more than 3-fold indicates low consistency and reliability. The geNorm applet uses a
pairwise comparison approach similar to BestKeeper to identify the best combination of two genes based on the geometric mean expression levels [15]. However, it uses the transformed expression levels instead of raw Ct data used in BestKeeper to control the profound influence made by any outliers.
The NormFinder uses a model-based approach to provide a more precise measure of gene expression stability due to its direct estimation of expression variation and consideration of systematic differences between subgroups, rather than pairwise comparison approach [14]. In addition, the pairwise comparison approach is probably influenced by HKG co-regulation, and therefore the final ranks may not be optimal.
PPIA encodes a member of the peptidyl-prolyl cis-trans isomerase (PPIase) family, which are ubiquitous intracellular proteins that play a role in cyclosporine A-mediated immunosup-pression [17]. The role of PPIA in allergic asthma is inconsistent in the literature. On one hand, PPIA2/2 lockout mice developed allergic disease accompanied by elevated IgE and an increased number of mast cells and eosinophils in multiple tissues, which was caused by type 2 cytokines released from CD4+T cells [18]. While
on the other hand, increasing evidence has suggested that cyclophilins are potent chemoattractants for a variety of human and mouse leukocyte subsets [19,20]. Indeed, elevated protein levels of cyclophilin have been observed both in acute allergic asthma [21] and chronic periods of the disease. Blocking the function of PPIA reduced the recruitment of leukocytes and acute episodes of the disease following allergen challenge [22]. In the present study, PPIA mRNA level was lower in asthmatics than in healthy controls. One explanation is that in the present study, Table 2.Data of candidate housekeeping genes (n = 28).
RN28S1 RPLP0 ACTB PPIA PGK1 B2M GUSB RPL13A
n 28 28 28 28 28 28 28 28
GM 14.90 26.69 26.37 27.54 28.63 24.36 32.54 25.99
AM 14.94 26.72 26.39 27.57 28.67 24.38 32.56 26.02
min 12.83 23.77 23.83 23.93 24.33 22.33 30.07 24.00
max 16.46 28.23 28.65 29.82 31.10 26.49 35.22 28.43
SD 0.92 0.97 1.02 0.89 1.20 0.88 0.83 0.95
CV (%) 6.19 3.65 3.85 3.22 4.19 3.63 2.56 3.66
GM, geometric mean; AM, arithmetic mean; Min, minimal value; Max, maximal value; CV, coefficient of variance. doi:10.1371/journal.pone.0048367.t002
Table 3.Housekeeping genes evaluated in the present study.
Full name Symbol Gene function Accession no.
RNA, 28S ribosomal 1 RN28S1 Riboxomal units ENST00000419932
Ribosomal protein, large, P0 RPLP0 Structural component of the 60S subunit of ribosomes NM_001002.3
Actin,beta ACTB Cytoskeletal structural actin NM_001101
Cyclophilin A PPIA Accelerate the folding of proteins NM_021130.3
Glyceraldehyde-3-phosphate dehydrogenase GAPDH Enzyme in glycolysis and nuclear functions NM_002046
Phosphoglycerate kinase 1 PGK1 Glycolytic enzyme NM_000291.3
Beta-2-microglobulin B2M Component of the major histocompatibility complex class I molecules
NM_004048.2
Glucuronidase, beta GUSB Hydrolase that degrades glycosaminoglycans NM_000181.3
Ribosomal protein L13a RPL13A Structural component of the 60S ribosomal subunit NM_012423.2
unstimulated CD4+
T cells were studied. It is possible thatPPIA level is low in resting CD4+
T cells. Upon allergen stimulation, such as in acute asthmatics or chronic asthmatics with continuous allergen exposure,PPIAexpression would be higher than normal. This phenomenon was seen previously with other chemoattrac-tants such as eotaxin, RANTES, MIP-1a, and MCP-1 [23,24,25]. Our previous study identifiedPPIAas a stable expressed HKG in airway epithelial cells [26], this paper has provided helpful information to a dozen of studies since its publication (citations from Google Scholar). Several publications usedPPIAas a HKG to normalize the expression levels of target genes and found meaningful differential expressions of target genes [27,28], Current study identified B2M and RPLP0 as the most optimal HKGs in gene expression studies involving human blood CD4+
T
cells derived from normal subjects and asthmatics with and without depression. The different results from the two studies may be explained by the fact that the cell types in the two studies were different and our results have also strengthened the importance of optimal HKGs selection before performing any qRT-PCR in different disease conditions. Since asthma with depression have been considered to influence the disease process of asthma certainly, exploring the underlying pathophysiological mecha-nisms is necessary. However, before we determine the molecular basis, selecting optimal HKGs is the first and crucial step.
Conclusions
To our knowledge, this is the first study to identify the most stable HKGs in CD4+
T cells and depressive/non-depressive asthmatic disease status.B2M and RPLP0were identified as the most optimal combination of HKGs in gene expression studies involving human blood CD4+
T cells derived from normal, depressive asthmatics and non-depressive asthmatics. Moreover, the present findings question the suitability of thePPIAgene as the HKG for such studies due to its significantly lower expression levels in asthmatic CD4+
T cells. Furthermore, careful comparison of the gene expression profiles of purified CD4+
T cells based on information from this study will further elucidate the molecular basis of the incidence and development of asthma with or without depression.
Acknowledgments
We thank Dr. Ya-Jing Meng, a psychiatrist for evaluation the psychological conditions of these subjects, Yan He and Qing-Jie Xia for helping experiment technology; and all of the subjects for their participation.
Figure 2. Correlation analysis of candidate housekeeping genes (HKGs) versus BestKeeper index.aAll 8 candidate HKGs showed strong
correlation (correlation coefficientrvalue from 0.69 to 0.93) and were combined into an index, which was then used to compute the correlation between each HKG and the index.
doi:10.1371/journal.pone.0048367.g002
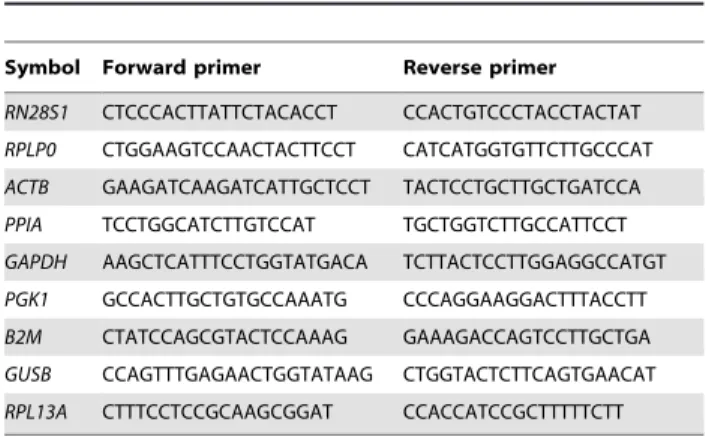
Table 4.Primer sequences for housekeeping genes.
Symbol Forward primer Reverse primer
RN28S1 CTCCCACTTATTCTACACCT CCACTGTCCCTACCTACTAT
RPLP0 CTGGAAGTCCAACTACTTCCT CATCATGGTGTTCTTGCCCAT
ACTB GAAGATCAAGATCATTGCTCCT TACTCCTGCTTGCTGATCCA
PPIA TCCTGGCATCTTGTCCAT TGCTGGTCTTGCCATTCCT
GAPDH AAGCTCATTTCCTGGTATGACA TCTTACTCCTTGGAGGCCATGT
PGK1 GCCACTTGCTGTGCCAAATG CCCAGGAAGGACTTTACCTT
B2M CTATCCAGCGTACTCCAAAG GAAAGACCAGTCCTTGCTGA
GUSB CCAGTTTGAGAACTGGTATAAG CTGGTACTCTTCAGTGAACAT
RPL13A CTTTCCTCCGCAAGCGGAT CCACCATCCGCTTTTTCTT
Figure 3. Ranking the housekeeping genes (HKGs) according to their expression stability M determined using geNorm.A stepwise exclusion of the least stable HKG was conducted to obtain the mean expression stability value M of remaining HKGs until the two most stable HKGs were identified. The genes are ranked according to M values.
doi:10.1371/journal.pone.0048367.g003
Figure 4. Determination of the housekeeping gene expression stability by NormFinder.The stability value is estimated using the model-based approach. Having considered both the intra- and inter-group variation, a lower stability value represents a smaller systematic error that would be introduced when using the studied gene.
Author Contributions
Conceived and designed the experiments: YLJ ZAL TW JQH. Performed the experiments: TW XYX YYY. Analyzed the data: TW. Contributed
reagents/materials/analysis tools: TW XYX YYY. Wrote the paper: TW AJS JQH. Interpreted the results: TW AJS JQH.
References
1. Scott KM, Von Korff M, Ormel J, Zhang MY, Bruffaerts R, et al. (2007) Mental disorders among adults with asthma: results from the World Mental Health Survey. Gen Hosp Psychiatry 29: 123–133.
2. Lavoie KL, Bacon SL, Barone S, Cartier A, Ditto B, et al. (2006) What is worse for asthma control and quality of life: depressive disorders, anxiety disorders, or both? Chest 130: 1039–1047.
3. Van Lieshout RJ, Bienenstock J, MacQueen GM (2009) A Review of Candidate Pathways Underlying the Association Between Asthma and Major Depressive Disorder. Psychosomatic Medicine 71: 187–195.
4. Corrigan CJ, Hartnell A, Kay AB (1988) T lymphocyte activation in acute severe asthma. Lancet 1: 1129–1132.
5. Gonzalez MC, Diaz P, Galleguillos FR, Ancic P, Cromwell O, et al. (1987) Allergen-induced recruitment of bronchoalveolar helper (OKT4) and suppressor (OKT8) T-cells in asthma. Relative increases in OKT8 cells in single early responders compared with those in late-phase responders. The American review of respiratory disease 136: 600–604.
6. Robinson DS (2010) The role of the T cell in asthma. J Allergy Clin Immunol 126: 1081–1091; quiz 1092–1083.
7. Miller AH (2010) Depression and immunity: a role for T cells? Brain Behav Immun 24: 1–8.
8. Bustin SA (2000) Absolute quantification of mRNA using real-time reverse transcription polymerase chain reaction assays. Journal of Molecular Endocri-nology 25: 169–193.
9. Hamilton M (1960) A rating scale for depression. Journal of neurology, neurosurgery, and psychiatry 23: 56–62.
10. Schatz M, Sorkness CA, Li JT, Marcus P, Murray JJ, et al. (2006) Asthma Control Test: reliability, validity, and responsiveness in patients not previously followed by asthma specialists. The Journal of allergy and clinical immunology 117: 549–556.
11. Juniper EF, Buist AS, Cox FM, Ferrie PJ, King DR (1999) Validation of a standardized version of the Asthma Quality of Life Questionnaire. Chest 115: 1265–1270.
12. Mane VP, Heuer MA, Hillyer P, Navarro MB, Rabin RL (2008) Systematic Method for Determining an Ideal Housekeeping Gene for Real-Time PCR Analysis. J Biomol Tech 19: 342–347.
13. Pfaffl MW, Tichopad A, Prgomet C, Neuvians TP (2004) Determination of stable housekeeping genes, differentially regulated target genes and sample integrity: BestKeeper–Excel-based tool using pair-wise correlations. Biotechnol Lett 26: 509–515.
14. Andersen CL, Jensen JL, Orntoft TF (2004) Normalization of real-time quantitative reverse transcription-PCR data: a model-based variance estimation approach to identify genes suited for normalization, applied to bladder and colon cancer data sets. Cancer Res 64: 5245–5250.
15. Vandesompele J, De Preter K, Pattyn F, Poppe B, Van Roy N, et al. (2002) Accurate normalization of real-time quantitative RT-PCR data by geometric averaging of multiple internal control genes. Genome Biol 3: RESEARCH0034. 16. Irwin MR, Miller AH (2007) Depressive disorders and immunity: 20 years of
progress and discovery. Brain Behav Immun 21: 374–383.
17. Handschumacher R, Harding M, Rice J, Drugge R, Speicher D (1984) Cyclophilin: a specific cytosolic binding protein for cyclosporin A. Science 226: 544–547.
18. Colgan J, Asmal M, Neagu M, Yu B, Schneidkraut J, et al. (2004) Cyclophilin A regulates TCR signal strength in CD4+ T cells via a proline-directed conformational switch in Itk. Immunity 21: 189–201.
19. Arora K, Gwinn WM, Bower MA, Watson A, Okwumabua I, et al. (2005) Extracellular cyclophilins contribute to the regulation of inflammatory responses. J Immunol 175: 517–522.
20. Damsker JM, Bukrinsky MI, Constant SL (2007) Preferential chemotaxis of activated human CD4+T cells by extracellular cyclophilin A. J Leukoc Biol 82: 613–618.
21. Balsley MA, Malesevic M, Stemmy EJ, Gigley J, Jurjus RA, et al. (2010) A cell-impermeable cyclosporine A derivative reduces pathology in a mouse model of allergic lung inflammation. J Immunol 185: 7663–7670.
22. Stemmy EJ, Balsley MA, Jurjus RA, Damsker JM, Bukrinsky MI, et al. (2011) Blocking cyclophilins in the chronic phase of asthma reduces the persistence of leukocytes and disease reactivation. Am J Respir Cell Mol Biol 45: 991–998.
Figure 5. Comparison of the normalized relative expression levels of housekeeping genes (HKGs) between the three subgroups.
The relative expression levels of remaining seven genes were normalized against the Normalization Factor based on the geometric mean of the expression level of the best-performing HKGs (B2MandRPLP0). Data are presented as mean6SE.aP
23. van den Toorn LM, Overbeek SE, de Jongste JC, Leman K, Hoogsteden HC, et al. (2001) Airway inflammation is present during clinical remission of atopic asthma. Am J Respir Crit Care Med 164: 2107–2113.
24. Humbles AA, Conroy DM, Marleau S, Rankin SM, Palframan RT, et al. (1997) Kinetics of eotaxin generation and its relationship to eosinophil accumulation in allergic airways disease: analysis in a guinea pig model in vivo. Journal of Experimental Medicine 186: 601–612.
25. Gonzalo JA, Lloyd CM, Kremer L, Finger E, Martinez AC, et al. (1996) Eosinophil recruitment to the lung in a murine model of allergic inflammation. The role of T cells, chemokines, and adhesion receptors. J Clin Invest 98: 2332– 2345.
26. He JQ, Sandford AJ, Wang IM, Stepaniants S, Knight DA, et al. (2008) Selection of housekeeping genes for real-time PCR in atopic human bronchial epithelial cells. Eur Respir J 32: 755–762.
27. Oosthuizen JL, Gomez P, Ruan J, Hackett TL, Moore MM, et al. (2011) Dual organism transcriptomics of airway epithelial cells interacting with conidia of Aspergillus fumigatus. Plos One 6: e20527.