EMPIRICAL STUDY OF ACCEPTED GAP AND LANE CHANGE
DURATION WITHIN ARTERIAL TRAFFIC UNDER RECURRENT
AND NON-RECURRENT CONGESTION
Saravanan Gurupackiam1, Steven Lee Jones Jr.2
1, 2 Department of Civil, Construction, and Environmental Engineering, University of Alabama,
Tuscaloosa, USA
Received 9 June 2012; accepted 20 August 2012
Abstract: This paper investigated variations in accepted gaps and lane change duration on arterial under recurrent and non-recurrent congestion. Descriptive statistics and best-fit distributions were obtained for the two parameters for both traffic conditions. Hypothesis testing using Mann-Whitney U-Test showed that the means of accepted gaps and lane change durations were statistically different between the two types of traffic conditions. The study found that during non-recurrent congestion, drivers on an average accepted smaller gaps but took longer lane change durations. Based on the fact that the data were collected for the same flow-rate (70-90 vehicles/minute) in both traffic conditions and based on the literature, the reason for the above findings could be that, drivers get more frustrated during non-recurring congestion that they accept smaller gaps. Drivers visiting the study location for game day (non-recurrent) exhibit different driver behavioral characteristics when compared to regular commuters (recurrent) which could have also contributed to the statistical differences in the lane changing characteristics of two types of congestion. These findings have direct implications on the lane changing parameters used in microscopic traffic simulation and also help transportation planners and managers to understand driver behavior during recurrent and non-recurrent congestion and better manage the facilities.
Keywords: driver behavior, gap acceptance, lane changing, recurrent congestion, non-recurrent congestion.
1 Corresponding author: [email protected]
1. Introduction
Congestion is a major source of discontent and frustration for urban and suburban dwellers (Raney et al., 2000). It leads to increased fuel consumption and vehicular emissions. Excessive delays in moving goods and people affect the local economy. The Urban Mobility Report 2010 by the Texas Transportation Institute indicates that about 439 urban areas in America are experiencing
problems due to congestion and it is getting worse in regions of all sizes (Schrank and Lomax, 2009). The report states that as per 2007 data, congestion caused urban Americans to travel 4.2 billion hours more and to purchase an extra 2.8 billion gallons of fuel for a congestion cost of $87 billion per year.
source. Recurrent congestion refers to congestion caused by routine traffic volumes on a normal day. In a normal day recurrent congestion occurs during peak hours of commuting in the morning, evening, and sometimes even in the mid day. This type of congestion recurs every day and hence the name. Non-recurrent congestion can be defined as unexpected or unusual congestion caused by an event that was unexpected and transient relative to other similar days. Non-recurrent congestion is caused by factors that change the normal traffic operations. Incidents, special events, road work construction/maintenance, bad weather etc., are the main factors that cause non-recurrent congestion. Federal Highway Administration states that non-recurrent congestion constitutes 50% of the congestion throughout the nation. While earlier studies have focused on the changes in driver behavior due to congestion in general, they did not distinguish congestion as recurrent or non-recurrent type. Also, most of these studies focused only freeways rather than arterials. Understanding the changes in driver behavior under recurrent vs non-recurrent congested conditions in urban arterials may help to better predict and model (e.g., microsimulation) these parameters and to better manage transportation facilities in urban areas. This study will contribute to accurate modeling of gap acceptance and lane change duration by identifying the changes in these two parameters with respect to recurrent and non-recurrent congestion. Also, most of the existing research has been done on lane changes on freeways rather than urban streets. The reason could be that traffic operations on urban streets are more complex than on freeways due to the presence of traffic signals and the lack of sufficient access management on urban streets. This study is an attempt to enhance traffic
operations by improving the understanding of lane changing and gap acceptance on arterials under recurrent and non-recurrent congestion and propose recommendations for better modeling of these parameters in microscopic traffic simulation. Most of the above mentioned studies investigated the relationship between congestion and driver behavior, but, did not differentiate congestion from recurrent and non-recurrent conditions. Thus this study was conducted with the anticipation that non-recurrent congestion by its unpredictable nature and duration may induce driver behaviors which may differ from that observed during recurrent congestion.
2. Literature Review
the lane change. That distance, however, will vary by the driver type of each vehicle. Another commonly used microscopic traffic simulation tool, SimTraffic (Trafficware, 2003), splits the lane change distance into positioning distance and mandatory distance. Shabaan (2005) indicated that SimTraffic designates the first 2/3 of the distance between the positioning point and the mandatory point where vehicles will attempt a positioning lane change. Aggressive drivers will ignore positioning lane changes and even move the other way to avoid a queue. After the 2/3-point, vehicles will attempt a mandatory lane change.
Gap acceptance in the current study refers to the minimum size of gap (seconds) in traffic flow that drivers are willing to accept while changing lanes. Lane change duration refers to the time required for a vehicle to actually execute the lane change maneuver (i.e., fully transition from the origin lane to the target lane). There has been considerable research into the characteristics and modeling of these two parameters (Ramanujam et al., 2008; Thiemann et al., 2008; Goswami and Bham, 2007; Toledo and Zohar, 2007; Coifman et al., 2006; Lee, 2006; Hidas, 2005; Tijerina et al., 2005; Lee et al., 2003; Hidas, 2002; Ahmed, 1999). Gap acceptance and lane changing depend on driver parameters like aggressiveness, urgency, and impatience (Goswami and Bham, 2007). It is known that drivers behave differently under diverse traffic, geometric, and environmental conditions. Similarly, the same driver can behave differently under varying traffic and control conditions (Goswami and Bham, 2007). The interactions between drivers involved in a lane change maneuver require complex behavioral decision-making processes (Hidas, 2002). Hence, it is expected that congestion can have
considerable impact on the lane changing process. One of the earlier studies (Stern, 1999) pointed out that transportation impedance (i.e., congestion) as a frustrating condition elicits negative effect in driver behavior such as aggressive lane switching. Other studies (Congestion Management Processes, 2008; Bonneson and Zimmerman, 2004; Hadfield and Estrela, 2004; Porter and Berry, 2001; Kamyab et al., 2000) clearly suggest that congestion leads to frustration among drivers. Thus, in general congestion contributes to frustration and, arguably, aggressive driver behavior. The magnitude to which recurrent or non-recurrent congestion contributes to changes in driver behavior is, however, not known. Hence, it is anticipated that recurrent and non-recurrent congestion may have varying degree of impact on the driver behavior characteristics.
segment ranged between 1.47 to 1.82 seconds and that of a trailing gap ranged between 1.58 to 1.82 seconds (Goswami and Bham, 2007). Another study found that the median lead critical spacing in a freeway ranged from 1.5 to 49.2 meters (Lee, 2006). A study conducted for modeling gap acceptance at freeway merges observed that the lead spacing in I-80 ranged between 0.13 to 102.9 meters and the lag spacing ranged between 0.5 and 172.9 meters (Ahmed, 1999).
With respect to lane changes, most of the microscopic traffic simulation software models treat them as instantaneous event (Toledo and Zohar, 2007). However, in reality lane changes have durations in the range of 1.0 to 13.3 seconds (Thiemann et al., 2008; Toledo and Zohar, 2007; Tijerina et al., 2005; Lee et al., 2003) and follow a specific distribution. It is also shown that lane change maneuvers affect delays (Coifman et al., 2006), and the duration of lane changes for passenger cars differ significantly from that of heavy vehicles (Toledo and Zohar, 2007). Hence, accurate modeling of lane changing process is necessary to achieve better results from microscopic traffic simulation.
3. Data Description
The University Transportation Center for Alabama Traffic Management lab was used extensively for collecting the required data for this study. This lab receives real-time traffic video by closed circuit television cameras operated by the Tuscaloosa Department of Transportation which has cameras installed along the study corridor (McFarland Boulevard), a six-lane, two-way arterial in Tuscaloosa, AL. One of the cameras was adjusted to view the intersection of McFarland Boulevard and 37th Street, including about 210 meters of southbound approach to the
signal. Gap acceptance and lane changing were collected from recorded video at this location as described in the methodology section. A schematic of the study corridor is given in Fig. 1, and a snapshot of the camera view is given in Fig. 2. The camera view shows the southbound approach of McFarland Boulevard on the 37th street intersection.
4. Methodology
The PM peak traffic on normal working days was recorded to represent recurrent congestion. Similarly, the A-Day (first day of football scrimmage during spring, which attracted more than 90,000 people) traffic was recorded to represent non-recurrent congestion. The A-Day traffic was recorded after the completion of the game that covered the entire period of congestion. Accepted gaps and lane change durations were collected in time intervals corresponding to the green phase for the southbound traffic shown in Fig. 2. The number of lane changes and gap acceptances per cycle of green time were noted. Data were collected corresponding to flow rate of 70 to 90 vehicles per minute of green time for both types of congested conditions. Because, this flow rate closely resembled saturation flow rate. For each lane change and gap acceptance, the duration of the change maneuver (in seconds) and the size of the accepted gap (in seconds) was collected.
Fig. 1.
Study Approach and Intersection
Fig. 2.
eliminated from the data collection process. The gap acceptance and lane change duration data in this study correspond only to passenger cars.
4.1. Data Collection Procedure
In this study, gap acceptance refers to accepting a gap during a lane change maneuver. Hence, the parameters gap acceptance and lane changing duration are related to each other. Fig. 3a shows all the lane change maneuvers possible within a three-lane road and Fig. 3b shows the process of vehicle accepting gap while changing lanes.
In this study, gap refers to the time gap available to the subject vehicle in the target lane, and accepted gaps are those gaps accepted by the subject vehicle. With the absence of any lane drops or other similar situations, lane changes at the studied location were considered to be primarily for positioning the vehicles for turns
upstream to enter an upcoming freeway (I-20), or to enter side streets, adjacent driveways. Thus, these lane changes are positioning in nature. The accepted gaps during lane changes were collected as follows:
• The time (T1) and location of the leading vehicle in the target lane were noted at the instant the subject vehicle first began changing its alignment in the present lane. • The time (T2) was noted when the following
vehicle crossed the same spot as that noted in the first step.
• The difference between times T1 and T2 gives the accepted gap size (in seconds). • The other parameter, duration of the lane
change maneuver was calculated as the time taken by the subject vehicle to completely change from one lane to another.
It has to be noted that by time T2 the subject vehicle would have accepted the gap between
Lead Vehicle
Trailing Vehicle Subject Vehicle
Fig. 3a.
Possible Lane Changes on 3-Lane Road
Fig. 3b.
the leading and the following vehicle. This represents a cooperative lane change, where the following vehicle yields to allow the lane change to happen (Lee, 2006). Given the fact that the lane changes are for positioning vehicles in the goal lane, they will most likely be cooperative in nature. Forced lane changes (when merging by the subject vehicle forces the following vehicle to slow down (Lee, 2006)) usually occur during mandatory lane changes.
Past studies have indicated that spacing between the lead and following vehicles of more than 75 meters suggests no meaningful vehicle interaction with each other (Goswami and Bham, 2007). In this study, gaps are defined as the time between the leading and trailing vehicles (Fig. 3b). Based on travel time measurements conducted for another study on the same road, the speed of vehicles on the approach under consideration during congested conditions was 40 km/hr. Hence, a spacing of 75 meters correspond to 8 seconds which was chosen as the criteria for determining vehicles in interaction in the current study. Also, Chen et al. (2010) prepared probability density distributions of headway and spacing using the Next Generation Simulation Data (Morning Peak, US Highway 101, Los Angeles, CA) that revealed for vehicles traveling at 0 to 55 km/hr the probability of headway to be 8 seconds were almost negligible. Therefore, when vehicles are separated by more than 8 seconds, they can be considered as free flowing and the lane changes under such conditions would constitute a free lane change rather than a lane change with interaction between a leader and following vehicle (cooperative or forced lane change). Thus, gap sizes equal to or more than 8 seconds were not counted in the data collection process. Since the study approach
was close to the signalized intersection and there were frequent queue build-ups, sufficient care was taken to collect data only when there was continuous flow of vehicles and not during stop and go movement.
The approach under consideration had three through lanes. Lane changes and gap acceptances occurring only within the three through lanes were collected for the study. The data form used to collect duration of lane changes and accepted gaps and sample data are shown in Table 1. The table displays the start and end time of each accepted gap and lane change duration within a cycle of green time. It also provides the traffic volume per cycle of green time.
4.2. Sample Requirements
The minimum sample size was calculated as per the standard procedure given in reference (Navidi, 2007). A confidence level of 95%, a sample standard deviation(s) of 1 for 6 samples, and a permitted error of the estimate of 0.25 were assumed. The number of required samples was calculated as 62. This number was taken as the number of lane changing or gap acceptance maneuvers required for statistical validity.
Table 1
Data Collection Form and Sample Data
Green Time Accepted Gap Duration of Lane Change Volume
Start hour min sec ms time min sec ms difference time min sec ms difference
# of vehicle
4 6 40 40 T1 6 40 47
4.86 T1 6 40 47 4.13
78
T2 6 45 33 T2 6 44 60
T1 6 43 07
5.00 T1 6 43 07 3.93
T2 6 48 07 T2 6 47 0
T1 6 52 13 3.60
T2 6 55 73
T1 7 2 40
3.47 T1 7 2 40 5.33
T2 7 5 87 T2 7 7 73
T1 7 9 53
3.00 T1 7 9 53 3.47
T2 7 12 53 T2 7 13 0
T1 7 11 20
8.47 T1 7 11 20 2.93
T2 7 19 67 T2 7 14 13
T1 7 27 27
4.00 T1 7 27 27 4.93
T2 7 31 27 T2 7 32 20
T1 7 44 73
3.14
End 4 7 51 87 T2 7 47 87
Note: min - minute, sec - second, ms – millisecond, T1 and T2 for accepted gaps and lane changing are defined separately in methodology.
Table 2
Available Number of Samples
Type of Congestion
Number of Samples Available
Accepted Gaps Lane Changes
Recurrent Congestion 66 103
5. Analysis of Data
5.1. Descriptive Statistics for Accepted
Gaps and Lane Change Durations
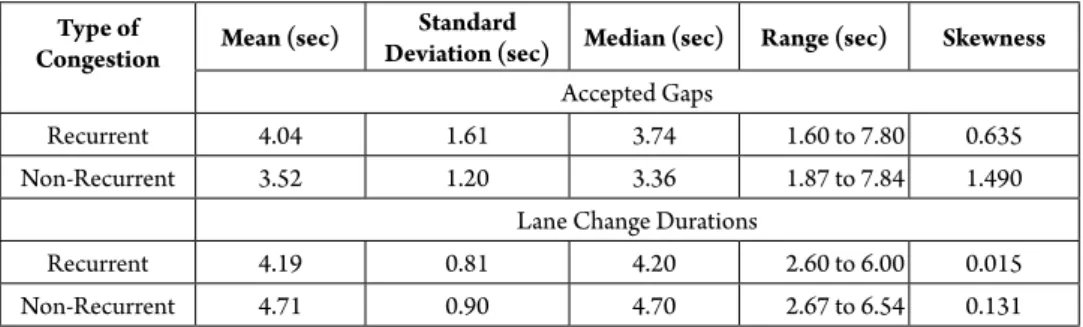
The accepted gaps and lane change durations for both recurrent and non-recurrent traffic conditions were analyzed to obtain basic statistics such as mean, median, standard deviation, range, and skewness. Table 3 shows the basic statistics obtained for the collected data.
From the table it can be observed that the mean and median values of accepted gaps corresponding to recurrent congestion are larger than that obtained under non-recurrent congestion. Inversely, the mean and median values of lane change durations corresponding to recurrent congestion are smaller than that obtained under non-recurrent congestion. Table 3 also shows that the standard deviations of lane change durations for any type of congestion are lesser than that of accepted gaps, indicating that drivers showed broader variations in the size of accepted gaps when compared to the variations in time taken to complete the lane change maneuver itself. The variation in lane change duration is lesser than accepted gaps. The positive and higher value of skewness for accepted gaps under
non-recurrent congestion indicates that its probability distribution is more skewed towards right. The best fit distributions of accepted gaps and lane change durations are dealt with in more detail later in this article.
5.2. Hypothesis Test for Difference
between Two Means
To statistically confirm the difference between the mean values for different flow rates, hypothesis testing using a Mann-Whitney U Test was performed. Because all the samples of accepted gaps and lane change durations did not follow a normal distribution, this specific statistical test, which is a distribution-free test, was performed. The assumptions required for a Mann-Whitney U Test (populations must be continuous and their probability density functions must have the same shape and spread) are somewhat less restrictive than the assumptions needed for the Student’s t-Test in which the populations to be tested need to be normally distributed (Navidi, 2007). The null and alternate hypothesis for conducting the Mann-Whitney U Test was defined as follows:
H0: There is no difference between the mean values of accepted gaps or lane change
Table 3
Basic Statistics of Accepted Gaps and Lane Change Durations Obtained from Recurrent and Non-Recurrent Congestion
Type of
Congestion Mean (sec)
Standard
Deviation (sec) Median (sec) Range (sec) Skewness
Accepted Gaps
Recurrent 4.04 1.61 3.74 1.60 to 7.80 0.635
Non-Recurrent 3.52 1.20 3.36 1.87 to 7.84 1.490
Lane Change Durations
Recurrent 4.19 0.81 4.20 2.60 to 6.00 0.015
durations obtained from recurrent and non-recurrent congested conditions.
HA: There is difference between the mean values of accepted gaps or lane change durations obtained from recurrent and non-recurrent congested conditions.
The hypothesis test was performed at a 95% confidence interval. The results including the Z-Statistic and P-Value of the Mann-Whitney U Test are given in Table 4.
Table 4
Hypothesis Test for Difference in Mean between Accepted Gaps and Lane Change Durations Obtained from Recurrent and Non-Recurrent Congestion
Parameter Z-Statistic P-Value Hypothesis (H0/H1) Accepted
Gaps 1.71 0.044 Reject H0
Lane Change Durations
3.73 <0.01 Reject H0
The results of the hypothesis test confirm the earlier observations that the mean value of the accepted gap during non-recurrent congestion is indeed statistically smaller than
that obtained during recurrent congestion and the mean value of lane change duration during non-recurrent congestion is statistically larger than that obtained during recurrent congestion.
5.3. Best-Fit Distributions for Accepted
Gaps and Lane Change Durations under
Recurrent and Non-Recurrent Congestion
The samples collected for accepted gaps and lane change durations for both traffic conditions were used to find the corresponding fitting distribution. In order to overlay the fitted distributions of recurrent and non-recurrent congestion, the shape, scale and location parameters obtained from a statistical package were used to recreate the distributions. The parameters of the best-fit distributions and their square errors are given in Table 5, and the fitted distributions are shown in Figs. 4a and 4b. The Kolmogorov-Smirnov (K-S) Test was performed to check the goodness of fit. Goodness of fit test is employed to determine whether or not the distribution of scores in a sample conforms to the distribution of scores in a specific theoretical or empirical population distribution. The K-S Test statistic is defined by the greatest vertical distance at any point between the two cumulative probability
Table 5
Parameters, Square Errors, and Goodness of Fit Estimates of Best-Fit Distributions for Accepted Gaps under Different Flow Rates
Type of Congestion
Best-Fit Distribution
Parameters
Square Error
Goodness of Fit, K-S Test
Scale Shape Observed K-S
Value
Critical K-S
Value P-Value
Accepted Gaps
Recurrent Gamma 0.862 3.53 0.0096 0.0687 0.167 > 0.15
Non-Recurrent Gamma 0.537 4.20 0.0103 0.0939 0.144 > 0.15
Lane Change Durations
Recurrent Normal 4.19 0.80 0.0062 0.0681 0.134 > 0.15
distributions. If the K-S Test statistic is less than the tabled critical value at the chosen confidence interval (95%) then the distribution being tested is a good fit. In other words, a P-value greater than 0.05 indicates that the sample distribution being tested is a good fit of the theoretical distribution. The K-S Test statistic, critical values, and the corresponding P-Value are given in Table 5.
The P-Values of K-S Test and low values of square errors of the fitted distributions confirm that the samples of accepted gaps and lane change durations under recurrent and non-recurrent congestion have been fitted with the best distributions.
The probability distributions of accepted gaps shown in Fig. 4a clearly shows a shift toward the left in the peak probability of drivers accepting smaller gaps during non-recurrent congestion when compared with that of recurrent congestion. In other words, the figure shows that a considerable proportion of drivers under non-recurrent congestion accept smaller gaps when compared with that during recurrent congestion. Similarly, Fig. 4b shows a shift toward right in the peak probability of lane change durations under non-recurrent congestion when compared with that during recurrent congestion. This means that a considerable proportion of drivers take longer time to change lanes during non-recurrent congestion than in recurrent congestion.
6. Discussion
From the analysis of accepted gaps, it was observed that the mean value of the accepted gaps during non-recurrent congestion was statistically lesser than that obtained for recurrent congestion. The same trend was observed in the median values between the two types of traffic condition. These findings
suggest that a considerable number of drivers accepted smaller gaps during non-recurrent congestion than during regular, recurrent congestion. The reason behind this finding could be identified after considering the following points:
• The data were collected for the same flow rate (70-90 vehicles per minute) during recurrent and non-recurrent congestion. Since the flow rate is the same in both traffic conditions, by flow – density relationship, the traffic density and thus vehicle headways can be assumed to be similar. Thus, it can be assumed that the distributions of available gaps are similar for both traffic conditions; and
• E arl ier stud ies (L ebanon Count y Metropolitan Organization, 2008; Kamyab et al., 2000; Stern, 1999) have indicated that congestion is one of the sources of frustration and it can lead to aggressive driver behaviors such as aggressive lane switching.
Fig. 4a.
Best-Fit Distributions for Gap Acceptance under Recurrent and Non-Recurrent Congestion
Fig. 4b.
directly affected by non-recurring sources of congestion than recurrent sources. Thus, due to long waiting times and unreliable travel conditions, it is reasonable to believe that the frustration and impatience during non-recurrent congestion could be far higher than that during recurrent congestion. Thereby, inducing drivers to accept smaller gaps. It should also be noted that the drivers during recurrent congestion were predominantly commuters of daily traffic. However, during non-recurrent congestion a large proportion of drivers from other places throughout the state utilized the transportation facilities at the study location. Hence, it can be expected that the driving behavior of these new drivers could be quite different from that of daily commuters. This could have also contributed to the statistical differences between lane changing characteristics of recurrent and non-recurrent congestion.
In contrast to the findings of accepted gaps, the mean and median values of lane change durations of non-recurrent congestion were found to be higher than that during recurrent congestion. From the best-fit distributions, it was observed that a considerable proportion of drivers took longer time to complete the lane change maneuvers during non-recurrent congestion than in recurrent congestion.
An attempt was made to compare the results of this study with other related studies done earlier. As per one of the studies (Hwang and Park, 2005), drivers accepted smaller gaps due to delay in congested conditions. The study showed that the lag spacing accepted during congested condition was only 28.71 meters when compared to that during non-congested conditions (32.70 meters). In line with this finding, it can be observed that the current study has indicated that when the degree of delay/congestion is higher (non-recurring
congestion) drivers accept even smaller gaps. Goswami and Bham (2007) conducted a study on mandatory lane changes in a freeway, the mean value of accepted leading gap ranged between 1.47 to 1.82 seconds and that of a trailing gap ranged between 1.58 to 1.82 seconds. Hence, the combined range of accepted leading and trailing gaps was 3.05 to 3.64 seconds. This range is smaller than what was obtained in this study (3.52 to 4.04 seconds). However, the data in the previous study were collected only for mandatory lane changes. In addition, freeways are operationally different than urban arterials.
With respect to lane change durations, except one study done by Tijerina et al. (2005), which considered data from city street and highway separately, all other studies identified dealt with freeway/highway data. Table 6 shows the basic statistics obtained from some of the earlier studies identified on lane change durations.
Table 6
Basic Statistics of Lane Change Durations Obtained from Previous Studies
Study Mean (sec)
Standard Deviation
(sec)
Range
Tijerina et al.,
2005* 5.00 - 3.5 to 6.5*
Tijerina et al.,
2005+ 5.80 - 3.5 to 8.5+
Lee, 2006+ 6.28 2.00
-Thiemann et al.,
2008+ 4.01 2.31
-Toledo et al.,
2007+ 4.60 2.30 1.0 to 13.3
Current study, recurrent congestion*
4.19 0.81 2.6 to 6.0
Current study, non-recurrent congestion*
4.71 0.90 2.7 to 6.5
From the table, it can be observed that the mean duration of lane change obtained in this study is in the lower end of the various values reported in earlier studies. Two studies have reported higher values of mean duration of lane changes and all these studies considered freeway data. It may be noted that in freeways the travel speed is generally much higher than urban arterials. At higher speeds (e.g. 100 km/hr) drivers intuitively take extra precaution and time for preparation to change lanes and for the lane change maneuver itself. However, the low mean value of lane change duration obtained in one of the earlier studies (Thiemann et al., 2008) could not be explained. The only study that considered city streets had a higher value of mean duration of lane changes than the current study. One of the possible reasons could be the technological advancement in automobiles including quicker acceleration and deceleration characteristics between the previous study period (1997) and the current one. For all the previous studies considered in Table 6, it should also be noted that the data collected for each of these studies are geographically different. Previous studies have shown that drivers from two different geographical regions behave differently (Tsimhoni et al., 2008; Dorn, 2005; Noyce et al., 2000). This can be one of the reasons for differences in the mean values of lane change durations obtained from different studies.
The findings of this study have direct implications upon the gap acceptance and lane changing parameters used in microscopic traffic simulation, particularly during model calibration. The default values of lane changing and gap acceptance parameters used in some of the common traffic simulation tools are indeed different from those obtained in this study. For instance, CORSIM has a default lane change duration value of 3 seconds (ITT
Industries, 2005), while the results obtained in this study show that the mean value of lane change duration varied from 4.19 to 4.71 seconds depending on the type of congestion and that they follow a specific distribution.
7. Conclusions
There is a keen interest in changes in driver behavior parameters such as lane changing and gap acceptance under varying traffic flow conditions. This study explored the changes in size of accepted gaps and lane change durations on urban arterial under recurrent and non-recurrent congested conditions. The mean values of accepted gaps under recurrent and non-recurrent congestion were found to be 4.04 and 3.52 seconds respectively and their standard deviations were 1.61 and 1.19 seconds respectively. A hypothesis test using Mann-Whitney U Test proved that the mean value of accepted gaps during non-recurrent congestion was statistically smaller than that of recurrent congestion. The shape and skewness of the best-fit distributions showed that a considerable proportion of drivers accepted smaller gaps during non-recurrent congestion than in recurrent congestion.
considerable number of drivers changed lanes slower under non-recurrent congestion rather than recurrent congestion.
Based on the assumption that the distributions of accepted gaps were the same for both types of traffic conditions and also based on the literature review, it appears that the driver frustration during non-recurrent congestion resulted in acceptance of smaller gaps. It was also noted that the driving behavior of commuters present during the A-Day non-recurrent congestion could be quite different from that of the daily commuters during recurrent congestion. This could have also contributed to the statistical differences in the lane changing characteristics of recurrent and non-recurrent congestion.
The findings of this study have direct implications upon the gap acceptance and lane changing parameters used in microscopic traffic simulation. The distributions of accepted gaps and lane change durations obtained in this study can be used in lane change models in microscopic traffic simulation software.
The results obtained in this study are characteristic of the arterial and location chosen for this study. Thus, the results cannot be generalized for any arterial without considering further study on the characteristics of the location, geometrics, and the type of facility.
8. Future Research
To further the current research, the sample size of data collection shall be increased to reduce data-related variation. Future studies should focus on the interaction between drivers in a lane-changing situation (i.e. forced and/ or cooperative behavior and its relationship with gap acceptance parameters). Lane change maneuvers should be separated into
mandatory and discretionary lane changes, as the behavioral and physical characteristics of these classes are likely to be quite different. Future efforts should also focus on how to measure the two types of lane changes. In addition, how the driver behavior parameters, as currently used in microscopic traffic simulation models, relate to the field data obtained in this research should be studied. Both logical and statistical relationships can be examined.
Acknowledgement
The current study was funded by the University Transportation Center for Alabama. The authors express their appreciation for the support and encouragement of University Transportation Center for Alabama and Tuscaloosa Department of Transportation.
References
Ahmed, K.I. 1999. Modeling drivers’ acceleration and lane changing behavior. Thesis (PhD). Massachusetts Institute of Technology. 189 p.
Bonneson, J.; Zimmerman, K. 2004. Red-light-running handbook: an engineer’s guide to reducing red-light-related crashes. College Station, TX: Texas Transportation Institute, USA. 80 p.
Chen, X., Li, L.; Zhang, Y. 2010. A Markov model for headway/spacing distribution of road traffic, IEEE Transactions on Intelligent Transportation Systems. DOI: http://dx.doi. org/10.1109/TITS.2010.2050141, 11(4): 773-785.
Coifman, B.; Mishalani, R.; Wang, C.; Krishnamurthy, S. 2006. Impact of lane-change maneuvers on congested freeway segment delays – pilot study, Transportation
Research Record. DOI:
http://dx.doi.org/10.3141/1965-16, 1965: 152-159.
Goswami, V.; Bham, H.G. 2007. Gap acceptance behavior in mandatory lane changes under congested and uncongested traffic on a multi-lane freeway. In Compendium of Papers of the86th Annual Transportation Research Board Annual Meeting,
Paper # 07-2919.
Hadfield, J.C.; Estrela, L. 2004. Red-light-running in southeastern Massachusetts. Southeastern Massachusetts Metropolitan Planning Organization, Taunton, MA,USA. 13 p.
Hidas, P. 2002. Modeling lane changing and merging in microscopic traffic simulation, Transportation Research Part C. DOI: http://dx.doi.org/10.1016/S0968-090X(02)00026-8, 10(5): 351-371.
Hidas, P. 2005. Modelling vehicle interactions in microscopic simulation of merging and weaving, Transportation Research Part C. DOI: http://dx.doi.org/10.1016/j.trc.2004.12.003, 13(1): 37-62.
Hwang, S.Y.; Park, C.H. 2005. Modeling of the gap acceptance behavior at a merging section of urban freeway. In Proceedings of the Eastern Asia Society for Transportation Studies 5: 1641-1656.
ITT Industries, Inc., Systems Division. 2005. CORSIM User’s guide, version 6.0.
Jones, S.L.; Sullivan, A.; Anderson, M.; Malave, D.; Cheekoti, N. 2004. Traffic simulation software comparison study. University Transportation Center for Alabama, Tuscaloosa, AL, USA. 58 p.
Kamyab, A.; McDonald, T.; Stribiak, J.J.; Storm, B. 2000.
Red light running in Iowa, the scope, impact, and possible implications.
Center for Transportation Research and Education, Ames, IA, USA. 50 p.
Kimley-Horn and Associates, Inc. 2010. NDOT Statewide Integrated Transportation Reliability Program, Technical Memorandum 5 – Short and Long Range Implementation Strategies. 59 p.
Lebanon County Metropolitan Organization with Gannett Fleming. 2008. Congestion management processes executive summary.20 p.
Lee, G. 2006. Modeling gap acceptance at freeway merges.
Thesis (MS). Massachusetts Institute of Technology, USA. 105 p.
Lee, S.E.; Olsen, E.C.B.; Wierwille, W.W. 2003. A comprehensive examination of naturalistic lane changes. National Highway Traffic Safety Administration, Washington D.C., USA. 213 p.
Navidi, W.C. 2007. Statistics for engineers and scientists, McGraw-Hill, New York, USA. 675 p.
Noyce, D.A.; Fambro, D.B.; Kacir, K.C. 2000. Traffic characteristics of protected/permitted left-turn signal displays, Transportation Research Record. DOI: http://dx.doi. org/10.3141/1708-04, 1708: 28-39.
Porter, B.E.; Berry, T.D. 2001. A nationwide survey of self-reported red light running: measuring prevalence, predictors, and perceived consequences, Accident Analysis and Prevention. DOI: http://dx.doi.org/10.1016/S0001-4575(00)00087-7, 33(6): 735-741.
Pulugurtha, S.S.; Pasupuleti, N. 2010. Assessment of link reliability as a function of congestion components,
Journal of Transportation Engineering. DOI: http://dx.doi. org/10.1061/(ASCE)TE.1943-5436.0000156, 136(10): 903-913.
Ramanujam, V.; Choudhury, C.F.; Ben-Akiva, M.E. 2008. An extended lane changing model to capture lane-change duration. In Proceedings of 87th Transportation Research Board
Annual Meeting, Paper #08-3041.
Raney, E.A.; Mokhtarian, P.L.; Salomon, I. 2000. Modeling individuals’ consideration of strategies to cope with congestion, Transportation Research Part F. DOI: http://dx.doi. org/10.1016/S1369-8478(00)00022-X, 3(3): 141-165.
Schrank, D.; Lomax, T. 2009. 2009 Urban mobility report. Texas Transportation Institute, College Station, TX, USA. 37 p.
Stern, E. 1999. Reactions to congestion under time pressure, Transportation Research Part C. DOI: http://dx.doi. org/10.1016/S0968-090X(99)00013-3, 7(2-3): 75-90.
Thiemann, C.; Treiber, M.; Kesting, A. 2008. Estimating acceleration and lane-changing dynamics based on NGSIM trajectory data. In Proceedings of 87th Transportation Research
Board Annual Meeting, Paper #08-2084.
Tijerina, L.; Garrott, W.R.; Stoltzfus, D.; Parmer, E. 2005. Eye Glance Behavior of Van and Passenger Car Drivers During Lane Change Decision Phase, Transportation Research Record.
DOI: http://dx.doi.org/10.3141/1937-06, 1937: 37-43.
Toledo, T.; Zohar, D. 2007. Modeling the duration of lane changes, Transportation Research Record. DOI: http://dx.doi. org/10.3141/1999-08, 1999: 71-78.
Trafficware Corporation. 2003. SimTraffic 6, Traffic Simulation Software – User Guide.
Transport Research Center, European Conference of Ministers of Transport. 2007. Managing urban traffic congestion, summary document.296 p.
Tsimhoni, O.; Kandt, A.S.; Flannagan, M.J. 2008. Driver perception of potential pedestrian conflict. Transportation Research Institute, The University of Michigan, Ann Arbor, MI, USA. 22 p.
EMPIRIJSKA STUDIJA PRIHVATLJIVOG
INTERVALA SLEĐENJA VOZILA I
VREMENA PRESTROJAVANJA UNUTAR
ARTERIJSKOG TOKA U USLOVIMA
PERIODIČNOG I NEPERIODIČNOG
ZAGUŠENJA
Saravanan Gurupackiam, Steven Lee Jones Jr.
Sažetak : U ovom radu je prikazano
istraživanje varijacije prihvatljivog intervala
sleđenja vozila i vremena prestrojavanja na gradskim arterijama u uslovima periodičnog i neperiodičnog zagušenja. U oba slučaja saobraćajnih uslova, za ova dva parametra su dobijeni deskriptivni statistički parametri i najpovoljnije raspodele. Testiranje hipoteze uz pomoć testa sume rangova (Mann-Whitney U-Test) pokazalo je da su srednje vrednosti prihvatljivog intervala sleđenja vozila i vremena prestrojavanja, prema vrednostima statističkih parametara različite za oba navedena slučaja saobraćajnih uslova. Studija je pokazala da za vreme neperiodičnog zagušenja, vozači u proseku prihvataju manji interval sleđenja vozila, ali da im treba više vremena za prestrojavanje. Pregledom referentne literature i s obzirom na činjenicu da su podaci prikupljeni za isti protok (70-90 vozila/minutu) u oba slučaja saobraćajnih uslova, razlog napred navedenih zapažanja može biti taj da su vozači nervozniji u uslovima neperiodičnog zagušenja pa prihvataju manji interval sleđenja vozila. Vozači koji su učestvovali u istraživanju neperiodičnog zagušenja pokazuju drugačije odlike u ponašanju u poređenju sa onima koji redovno putuju (periodično) što je možda doprinelo razlikama vrednosti statističkih parametara u odnosu na ova dva tipa zagušenja. Ovi zaključci imaju direktne implikacije na parametre prestrojavanja koji se koriste u simulaciji saobraćaja na mikro nivou, a takođe su od koristi saobraćajnim planerima i menadžerima za razumevanje ponašanja vozača u uslovima periodičnog i neperiodičnog zagušenja, kao i za bolje upravljanje prevoznim sredstvima i objektima.