CENTRO DE DESENVOLVIMENTO E PLANEJAMENTO REGIONAL
ANDREA IDELGA FERNAND JUBITHANA
PROBABILITIES OF DYING BETWEEN 15 AND 60 YEARS OF AGE (45q15) IN
SURINAME AND ITS MAIN REGIONS, 2004-2012 Death Distribution Methods
Belo Horizonte, MG UFMG/Cedeplar
ANDREA IDELGA FERNAND JUBITHANA
PROBABILITES OF DYING BETWEEN 15 AND 60 YEARS OF AGE (45q15) FOR SURINAME AND ITS MAIN REGIONS, 2004-2012
Death Distribution Methods
Belo Horizonte, MG
Centre of Development and Regional Planning Faculty of Economic sciences-UFMG, 2016
Dissertation presented to the Ph. D course in Demography of the Centre of Development and Regional Planning of the Faculty of Economic Sciences of the Federal University of Minas Gerais. The dissertation is a partial requirement to
ACKNOWLEDGEMENTS
I gratefully and with appreciation would like to thank the Lord who gave me the opportunity, strength and health to start and finish my PHD course in Demography.
I gratefully acknowledge my supervisor Dr. Bernardo Lanza Queiroz for the excellent support from the beginning until the end in the process of writing this dissertation.
I acknowledge the members of the examination committee of the dissertation defence, Dr. Ana Carolina Tomas, Dr. Everton Emanuel Campos de Lima, Dr. Irneu Rangel Rigotti and Dr. Laura Lidia Rodrigues Wong and in the qualification exam also, Dr. Ana Paula Verona, for the critical observations and suggestions given in order to improve this dissertation.
I acknowledge the professors of the Centre of Development and Regional Planning (CEDEPLAR) of the Federal University of Minas Gerais (UFMG) who have passed Demographic knowledge to me. I thank also the administrative personnel who have supported every time when necessary.
I thank the Program of cooperation of post-graduate students of the National Coordination for research (CAPES-PEC-PG) in Brazil for the financial support during the study at UFMG. I am sincerely grateful to the ex-rector of the Anton De Kom University of Suriname (AdeKUS), Dr. Ryan Sidin who made it administratively possible that I could attend the PHD course in Brazil. I also thank the director of the Institute of Graduate Studies and Research (IGSR) Dr. Marten Schalkwijk and his personal for providing the Human Development Atlas (2013).
I thank the director of the General Bureau of Statistics in Suriname, Iwan Sno MSc and his personal for the support in providing the necessary data for the production of this dissertation. I also thank Ms. Rita Murli-Mathoera head of the department of Demographic data of the Ministry of Internal Affairs in Suriname. I thank the nurse Ms. Amalia Clark BSc. for the support given with respects to data of Bureau Openbare Gezondheidszorg (BOG) of the Ministery of Health.
letters for the admission to the course in Demography at UFMG. Especially, thank Dr. Roberto Ramos Santos for the encouraging words and support during the course.
I gratefully acknowledge my parents Rudi Eugene Fernand and Elize Geertruida Fernand-Buyne, my husband Vincent Henry Jubithana, my children Dwight Maarten Jubithana and Erika Marijke Jubithana, my brother Earl Ismael Fernand, my sister Mavis Ruth Fernand and Vivian Esther Fernand and their family for their magnificent support and love during my PHD course in Demography.
GLOSARY
AHI – Age Heaping Index
ASFR- Age Specific Fertility Rates BH - Benneth and Horiuchi
BHP- Broken Hill Proprietary Company Limited
BOG – Bureau Openbare Gezondheidszorg (Department of Public Health of the Ministry of Health of Suriname)
CBB – Centraal Bureau voor Burger Zaken ( in Suriname) CBS - Centraal Bureau voor de Statistiek ( in Netherlands) CDR – Child Dependency ratio
DDM´s – Death Distribution Methods GBS – General Bureau of Statistics GGB - General Growth Balance
GGB-SEG- Hybrid General Growth Balance and Synthetic Extinct Generation FDT - First Demographic Transition
HAD – Human Development Atlas HiAP - Health in all policies
ICSI – Index of Concentration on Single Ages IMF- International Monetary Fund
IW – Whipple´s Index
2 1 k
k
- k Coverage of the first census; 21 k coverage of the second census
2
km - Square Kilometers
NBW - Nieuw Burgelijk Wetboek ODR - Old Age Dependency Ratio
PHC- Primary Health Care Foundation
x
n q - Function probability of dying
15
45q - Probability of dying between 15 and 60 years
SBW - Surinaams Burgelijk Wetboek (Surinamese Citizen Lawbook) SDV - Standard Deviation
SEG - Synthetic Extinct Generation
S.Z.F. - Staats Zieken Fonds (Governmental Fund for the sick) TDR - Total Dependency Ratio
TFR - Total Fertility Rate UN - United Nations
TABLE OF CONTENTS
GLOSARY ... I LIST OF ILUSTRATIONS ... VI ABSTRACT ... XIV
1.INTRODUCTION ... 1
2. ANTECEDENTS: SOCIO-ECONOMIC DIFFERENCES BY REGION IN SURINAME, DEMOGRAPHIC DYNAMICS IN SURINAME, MORTALITY IN SURINAME BASED ON CENSUSES 1950, 1964, 1972, 1980, 2004 AND 2012, DEATH REGISTER IN SURINAME8 2.1 Socio-Economic differences and demographic characteristics in Suriname and its main regions ... 8
2.2 General view of the Demographic dynamics in Suriname ... 14
2.2.1 Mortality overview ... 18
2.2.2 Fertility Transition ... 18
2.2.3 Migration ... 20
2.3 System of civil register of mortality in Suriname and its main regions ... 23
2.4 Final Remarks ... 25
3. DATA AND METHODS ... 27
3.1 Data ... 27
3.2 Migration data ... 32
3.3 Methods ... 33
3.3.1 Evaluation of quality population and death data ... 33
3.3.1.1 Whipple´s Index ... 34
3.3.1.2 Coale and Kisker (1986) measure ... 35
3.3.1.3 The index of concentration in single ages ... 36
3.3.2 Death Distributions Methods (DDM´s) ... 36
3.3.2.1 The General Growth Balance (GGB) method (Hill, 1987)... 37
3.3.2.2 The Synthetic Extinct Generation (SEG) method (Benneth and Horiuchi, 1981) and the Hybrid GGB-SEG method (Hill, You and Choi, 2004) ... 40
3.3.2.3 Age segments and Migration ... 42
3.3.2.4 The General Growth Balance (GGB) opens to migration ... 45
4. EVALUATION DATA QUALITY FOR POPULATION AND DEATH FOR SURINAME AND ITS MAIN REGIONS 2004-2012... 49
4.1 Evaluation data quality of the population data for Suriname ... 49
4.1.2 Coale and Kisker measure male and female population ... 49
4.1.3 Index Concentration on Single ages for male and female population ... 50
4.2 Evaluation data quality of the death counts data for Suriname ... 51
4.2.1 Whipple´s Index death count data for male and female ... 51
4.2.2 Coale and Kisker (1986) measure death count data for male and female ... 52
4.2.3 Index Concentration in Single Ages death count data male and female ... 54
4.3 Evaluation data quality of the population for main regions of Suriname ... 55
4.3.1 The Whipple´s Index for male and population of the main regions of Suriname ... 55
4.3.2 Coale and Kisker measure (1986) for male and female population of the main regions of Suriname... 56
4.3.3 Index Concentration in Single ages for male and female population of main regions of Suriname ... 58
4.4 Evaluation data quality of the death counts data for main regions of Suriname ... 59
4.4.1 Whipple´s Index for death count data male and female for main regions of Suriname ... 60
4.4.2 Coale and Kisker (1986) measure for death count data for male and female of the main regions of Suriname ... 61
4.4.3 Index Concentration in Single ages for death count data for male and female of the main regions of Suriname ... 62
5. PARAMETERS DEATH DISTRIBUITION METHODS AND DIAGNOSTIC PLOTS FOR SURINAME 2004-2012 ... 64
5.1 Parameters Death Distribution methods for Suriname 2004-2012 ... 64
5.2 Diagnostic plots of the Death ditribuition methods for Suriname by sex, 2004-2012 .. 68
5.2.1 Diagnostic plots of the GGB method for male and female population 2004-2012 . 68 5.2.2 Diagnostic plots of the SEG and GGB-SEG method for male and female population 2004-2012. ... 70
6. PARAMETERS DEATH DISTRBUITION METHODS AND DIAGNOSTIC PLOTS FOR MAIN REGIONS OF SURINAME 2004-2012 ... 74
6.1 Parameters DDMS by sex for main regions of Suriname 2004-2012 ... 74
6.1.1 Parameters main regions for male population ... 74
6.1.2 Parameters main regions for female population ... 77
6.2 Diagnostic plots of the Death Distribution methods for the main regions of Suriname by sex, 2004-2012 ... 81
6.2.1 Diagnostic plots for the GGB method for male and female population for the main regions of Suriname 2004-2012 ... 81
6.2.1.2 Rural Coastal area GGB plots age segments 5+ to 65+ ... 83
6.2.1.3 Rural interior area GGB plots age segments 5+to 65+ ... 84
6.2.1.4 Rural Coastal and Rural Interior area GGB plots age segments 30+ to 65+ .... 86
6.2.2 Diagnostic plots SEG and GGB-SEG methods for male and female population for the main regions of Suriname ... 88
6.2.2.1 Urban Coastal area SEG and GGB-SEG plots ... 88
6.2.2.2 Rural Coastal area SEG and GGB-SEG plots... 91
6.2.2.3 Rural Interior area SEG and GGB-SEG plots... 93
7. PROBABILITIES OF DYING BETWEEN 15 AND 60 YEARS OF AGE FOR SURINAME AND ITS MAIN REGIONS 2004-2012... 96
7.1 Probabilities of dying between 15 and 60 years by DDM´s, selected age segments and sex for Suriname, 2004-2012... 96
7.2 Probabilities of dying between 15 and 60 years by DDM´s, selected age segments and sex for main regions of Suriname 2004-2012 ... 104
7.3 Discussion regional and sex differences in probability of dying 45q15 for Suriname and its main regions, 2004-2012 ... 115
8. CONCLUSIONS... 121
ANNEX A- ANTECEDENTS SURINAME ... 128
ANNEX B- RESULTS POPULATION AND DEATH DATA ... 133
ANNEX B: RESULTS MIGRATION DATA ... 135
LIST OF ILUSTRATIONS
LIST OF TABLE
TABLE 2. 1: AREA SURINAME BY DISTRICTS, ABSOLUTE POPULATION
POPULATION DENSITY CENSUSES 2004 AND 2012 OF SURINAME ... 10 TABLE 2. 2: ECONOMIC STATUS POPULATION 15-64 IN SURINAME CENSUS 2004
AND CENSUS 2012 ... 13 TABLE 2. 3: PERCENTAGES MAIN AGE GROUPS CENSUSES HELD IN SURINAME
1950-2012 ... 15 TABLE 2. 4: DEPENDENCY RATIOS MAIN REGIONS SURINAME CENSUS 2004-2012 ... 17 TABLE 2. 5: MUTUAL MIGRATION FLOW MAIN REGIONS SURINAME, 2004-2009 23
TABLE 3. 1: CLASSIFICATION OF WHIPPLE´S INDEX ... 35 TABLE 3. 2: EXPLANATION OF THE INTERCEPT AND SLOPE OF GGB METHOD
(HILL, 1987) ... 40
TABLE 4. 1: COALE AND KISKER (1986) MEASURE FOR POPULATION OF CENSUS 2004 AND 2012 FOR SURINAME ... 49 TABLE 4. 2: WHIPPLE´S INDEX FOR DEATH COUNT DATA OF SURINAME 2006-2012
(BOTH SEXES) AND 2009-2012 (BY SEX) ... 52 TABLE 4. 3: RESULTS OF COALE AND KISKER (1986) MEASURE FOR AVERAGE OF
DEATH COUNT DATA OF SURINAME, 2004-2012 ... 54 TABLE 4. 4: WHIPPLE´S INDEX FOR CENTRAL REGIONS OF SURINAME, CENSUS
2012 ... 56 TABLE 4. 5: COALE AND KISKER (1986) MEASURE FOR THE POPULATION IN THE MAIN REGIONS OF SURINAME, CENSUS 2012 ... 57 TABLE 4. 6: WHIPPLE´S INDEX FOR DEATH COUNT DATA OF THE URBAN
COASTAL, RURAL INTERIOR AND RURAL COASTAL AREA OF SURINAME 2006-2012 (BOTH SEXES) AND 2009-2006-2012 (FEMALE AND MALE) ... 61 TABLE 4. 7: COALE AND KISKER (1986) MEASURE FOR THE AVERAGE DEATH
COUNT DATA 2004-2012 IN THE MAIN REGIONS OF SURINAME ... 62
TABLE 5. 1: COMPLETENESS OF DEATH RECORDING RELATIVE TO MALE
POPULATION (GGB, SEG AND GGB-SEG METHOD) AND CENSUS COVERAGE CHANGE: CENSUS 2012 TO CENSUS 2004 (GGB METHOD) ... 66 TABLE 5. 2: COMPLETENESS OF DEATH RECORDING RELATIVE TO FEMALE
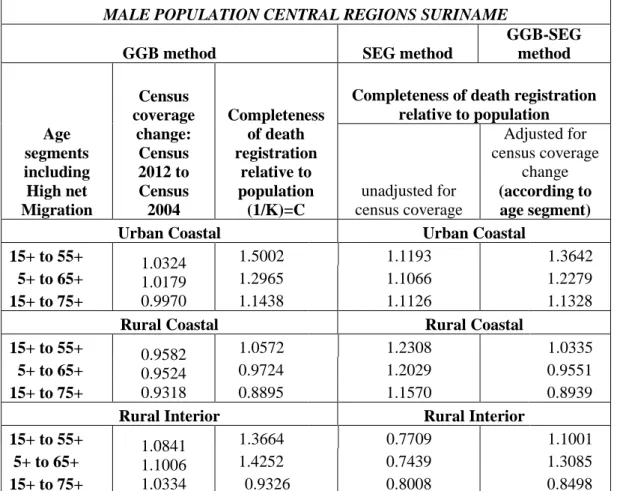
TABLE 6. 1: COMPLETENESS OF DEATH RECORDING RELATIVE TO MALE
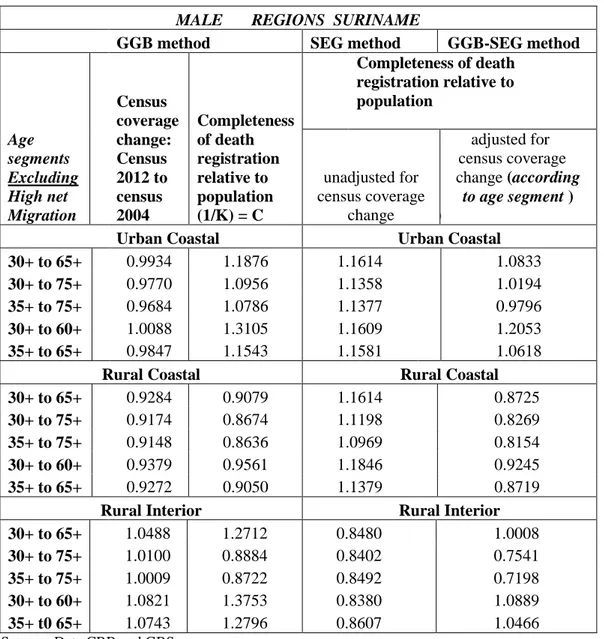
POPULATION (GGB, SEG AND GGB-SEG METHOD) AND CENSUS COVERAGE CHANGE: CENSUS 2012 TO CENSUS 2004 (GGB METHOD) FOR AGE SEGMENTS WITH HIGH PROPORTION OF PEAK MIGRATION ... 75 TABLE 6. 2: COMPLETENESS OF DEATH RECORDING RELATIVE TO MALE
POPULATION (GGB, SEG AND GGB-SEG METHOD) AND CENSUS COVERAGE CHANGE: CENSUS 2012 TO CENSUS 2004 (GGB METHOD) FOR AGE SEGMENTS WITHOUT PEAK MIGRATION ... 77 TABLE 6. 3: COMPLETENESS OF DEATH RECORDING RELATIVE TO FEMALE
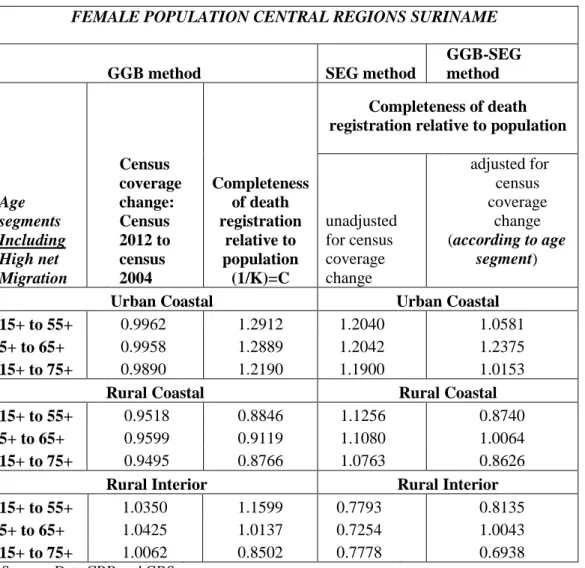
POPULATION (GGB, SEG AND GGB-SEG METHOD) AND CENSUS COVERAGE CHANGE: CENSUS 2012 TO CENSUS 2004 (GGB METHOD) FOR AGE SEGMENTS WITH HIGH PROPORTION OF PEAK MIGRATION ... 78 TABLE 6. 4: COMPLETENESS OF DEATH RECORDING RELATIVE TO FEMALE
POPULATION (GGB, SEG AND GGB-SEG METHOD) AND CENSUS COVERAGE CHANGE: CENSUS 2012 TO CENSUS 2004 (GGB METHOD) FOR AGE SEGMENTS WITHOUT HIGH PROPORTION OF PEAK MIGRATION ... 79
TABLE 7. 1: PROBABILITY OF DYING BY DDM´S FOR MALE POPULATION OF
SURINAME, 2004-2012, BY AGE SEGMENTS INCLUDING AND EXCLUDING HIGH PROPORTION OF PEAK MIGRATION ... 98 TABLE 7. 2: PROBABILITY OF DYING BY DDM´S FOR FEMALE POPULATION OF
SURINAME, BY AGE SEGMENTS INCLUDING AND EXCLUDING PEAK
PROPORTION OF MIGRATION ... 99 TABLE 7. 3: PROBABILITY OF DYING BY DDM´S FOR MALE POPULATION AND
MAIN REGIONS OF SURINAME, 2004-2012, BY AGE SEGMENTS INCLUDING HIGH PROPORTION OF PEAK MIGRATION ... 106 TABLE 7. 4: PROBABILITY OF DYING BY DDM´S FOR MALE POPULATION AND
MAIN REGIONS OF SURINAME, 2004-2012, BY AGE SEGMENTS EXCLUDING HIGH PROPORTION OF PEAK MIGRATION ... 107 TABLE 7. 5: PROBABILITY OF DYING BY DDM´S FOR FEMALE POPULATION AND
MAIN REGIONS OF SURINAME, 2004-2012, BY AGE SEGMENTS INCLUDING HIGH PROPORTION OF PEAK MIGRATION ... 111 TABLE 7. 6: PROBABILITY OF DYING BY DDM´S FOR FEMALE POPULATION AND
MAIN REGIONS OF SURINAME, 2004-2012, BY AGE SEGMENTS EXCLUDING HIGH PROPORTION OF PEAK MIGRATION ... 112
LIST OF ANNEX TABLES
TABLE A 1: TEN MAIN CAUSES OF DEATH IN SURINAME 2004-2011 ... 128 TABLE A 2: LIFETIME FERTILITY BY ETHNIC GROUPS AND AGE GROUPS IN
SURINAME CENSUS 2004 ... 128 TABLE A 3: LIFE TIME FERTILITY BY ETHNIC GROUPS AND AGE GROUPS IN
TABLE B 1: COALE AND KISKER (1986) MEASURE FOR SELECTED COUNTRIES,
MALE AND FEMALE POPULATION 2012 ... 133
TABLE B 2: REFERENCE DEATH DATA (COALE & KISKER, 1986) MALE POPULATION FOR SELECTED COUNTRIES 1999-2001, 2000-2005 AND 2005-2010 ... 133
TABLE B 3: REFERENCE DEATH DATA (COALE & KISKER, 1986) FEMALE POPULATION FOR SELECTED COUNTRIES 1999-2001, 2000-2005 AND 2005-2010 ... 134
LIST OF FIGURES FIGURE 2. 1: CENSUS POPULATION OF SURINAME BY DISTRICT IN 2012 ... 11
FIGURE 2. 2: GDP OF SURINAME IN BILLION USD, 2006-2014 ... 12
FIGURE 2. 3: PYRAMID CENSUS 2004, SURINAME ... 14
FIGURE 2. 4: PYRAMID OF CENSUS 2012, SURINAME ... 15
FIGURE 2. 5: TOTAL DEPENDENCY RATIO, CHILD DEPENDENCY RATIO AND OLD AGE DEPENDENCY RATIO OF SURINAME 1950-2050 ... 16
FIGURE 2. 6: TOTAL FERTILITY RATES OF SURINAME, SOUTH AMERICA AND THE CARIBBEAN 1950-2010 ... 19
FIGURE 2. 7: PERIOD AGE SPECIFIC FERTILITY RATES IN SURINAME CENSUS 2004-2012 ... 20
FIGURE 2. 8: INTERNATIONAL NET MIGRATION IN SURINAME 1972-2012 ... 21
FIGURE 2. 9: GROWTH RATES OF SURINAME, GUYANA AND FRENCH GUYANA 1950-2012 ... 26
FIGURE 3. 1: PROPORTION OF AVERAGE DEATH COUNTS, MALE AND FEMALE POPULATION IN SURINAME, 2004-2012 ... 27
FIGURE 3. 2: PROPORTION OF AVERAGE DEATH COUNTS FOR THE URBAN COASTAL AREA, MALE AND FEMALE POPULATION 2004-2012 ... 28
FIGURE 3. 3: PROPORTION OF AVERAGE DEATH COUNTS FOR RURAL COASTAL AREA, MALE AND FEMALE POPULATION 2004-2012 ... 30
FIGURE 3. 4: PROPORTION OF AVERAGE DEATH COUNTS, FOR RURAL INTERIOR AREA, MALE AND FEMALE POPULATION, 2004-2012 ... 31
FIGURE 3. 5: APPLICATION OF THE GGB METHOD IN CASE OF NO ERRORS ... 44
FIGURE 3. 6: APPLICATION SEG AND GGB-SEG METHOD IN CASE OF NO DATA ERRORS ... 45
FIGURE 4. 2: INDEX CONCENTRATION IN SINGLE AGES OF DEATH COUNT DATA FOR MALE AND FEMALE POPULATION (2009-2012) AND BOTH SEXES (2006-2012) IN SURINAME ... 55 FIGURE 4. 3: INDEX CONCENTRATION IN SINGLE AGES CENSUS POPULATION 2004
FOR THE MAIN REGIONS OF SURINAME ... 58 FIGURE 4. 4: INDEX CONCENTRATION IN SINGLE AGES FOR CENSUS POPULATION
2012 FOR MAIN REGIONS ... 59
FIGURE 5. 1: OBSERVED VERSUS FITTED VALUES MORTALITY RATES MALE POPULATION OF SURINAME, 2004-2012 (GGB METHOD AGE SEGMENT 5+ TO 65+) ... 69 FIGURE 5. 2: OBSERVED VERSUS FITTED VALUES MORTALITY RATES FEMALE
POPULATION SURINAME 2004-2012 (GGB METHOD AGE SEGMENT 5+ TO 65+). ... 70 FIGURE 5. 3: COMPLETENESS OF DEATH REPORTING (A+) MALE POPULATION
SURINAME 2004-2012, SEG AND GGB-SEG METHOD FOR SELECTED AGE SEGMENTS ... 71 FIGURE 5. 4: COMPLETENESS OF DEATH REPORTING (A+) FEMALE POPULATION
SURINAME 2004-2012, SEG AND GGB-SEG METHOD FOR SELECTED AGE SEGMENTS ... 72
FIGURE 6. 1: OBSERVED VERSUS FITTED VALUES MORTALITY RATES MALE POPULATION URBAN COASTAL AREA SURINAME, 2004-2012 (AGE SEGMENT 5+ TO 65+) ... 82 FIGURE 6. 2: OBSERVED VERSUS FITTED VALUES MORTALITY RATES FEMALE
POPULATION URBAN COASTAL AREA SURINAME, 2004-2012 (AGE SEGMENT 5+ TO 65+) ... 82 FIGURE 6. 3: OBSERVED VERSUS FITTED VALUES MORTALITY RATES MALE
POPULATION RURAL COASTAL AREA SURINAME, 2004-2012 (AGE SEGMENT 5+ TO 65+) ... 83 FIGURE 6. 4: OBSERVED VERSUS FITTED VALUE MORTALITY RATES FEMALE
POPULATION RURAL COASTAL AREA SURINAME, 2004-2012 (AGE SEGMENT 5+ TO 65+) ... 84 FIGURE 6. 5: OBSERVED VERSUS FITTED VALUES MORTALITY RATES MALE
POPULATION RURAL INTERIOR AREA SURINAME, 2004-2012 (AGE SEGMENT 5+ TO 65+) ... 85 FIGURE 6. 6: OBSERVED VERSUS FITTED VALUES MORTALITY RATES FEMALE
POPULATION RURAL INTERIOR AREA SURINAME, 2004-2012 (AGE SEGMENT 5+ TO 65+ ... 86 FIGURE 6. 7: OBSERVED VERSUS FITTED VALUES MORTALITY RATES RURAL
FIGURE 6. 8: OBSERVED VERSUS FITTED VALUES MORTALITY RATES RURAL INTERIOR AREA MALE POPULATION SURINAME (AGE SEGMENT 30+ TO 65+) ... 87 FIGURE 6. 9: OBSERVED VERSUS FITTED VALUES MORTALITY RATES RURAL
INTERIOR AREA FEMALE POPULATION (AGE SEGMENT 30+ TO 65+) ... 88 FIGURE 6. 10: COMPLETENESS OF DEATH REPORTING (A+) MALE POPULATION
URBAN COASTAL AREA SURINAME 2004-2012, SEG AND GGB-SEG METHOD FOR SELECTED AGE SEGMENTS ... 89 FIGURE 6. 11: COMPLETENESS OF DEATH REPORTING (A+) FEMALE POPULATION
URBAN COASTAL AREA SURINAME 2004-2012, SEG AND GGB-SEG METHOD FOR SELECTED AGE SEGMENTS ... 90 FIGURE 6. 12: COMPLETENESS OF DEATH REPORTING (A+) FOR MALE
POPULATION RURAL COASTAL AREA OF SURINAME 2004-2012, SEG AND GGB-SEG METHOD FOR SELECTED AGE GGB-SEGMENTS ... 92 FIGURE 6. 13: COMPLETENESS OF DEATH REPORTING (A+) FOR FEMALE
POPULATION RURAL COASTAL AREA SURINAME, 2004-2012, SEG AND GGB-SEG METHOD FOR SELECTED AGE GGB-SEGMENTS ... 93 FIGURE 6. 14: COMPLETENESS OF DEATH REPORTING (A+) MALE POPULATION
RURAL INTERIOR AREA SURINAME, 2004-2012, SEG AND GGB-SEG METHOD FOR SELECTED AGE SEGMENTS ... 94 FIGURE 6. 15: COMPLETENESS OF DEATH REPORTING (A+) FOR FEMALE
POPULATION RURAL INTERIOR AREA SURINAME, 2004-2012, SEG AND GGB-SEG METHOD FOR SELECTED AGE GGB-SEGMENTS ... 95
FIGURE 7. 1: SCATTER PLOT PROBABILITIES OF DYING 45Q15 BY DDM´S AND SELECTED AGE SEGMENTS FOR MALE POPULATION SURINAME, 2004-2012 . 101 FIGURE 7. 2: SCATTER PLOT OF PROBABILITIES OF DYING 45Q15 BY DDM´S AND
SELECTED AGE SEGMENTS FOR FEMALE POPULATION OF SURINAME, 2004-2012 ... 102 FIGURE 7. 3: PROBABILITIES OF DYING BETWEEN 15 AND 60 YEARS OF AGE FOR
MALE AND FEMALE POPULATION IN SURINAME, 1950-2015 ... 103 FIGURE 7. 4: SCATTER PLOT OF PROBABILITY OF DYING 45Q15 BY METHODS AND SELECTED AGE SEGMENTS FOR MALE POPULATION URBAN COASTAL AREA SURINAME, 2004-2012 ... 108 FIGURE 7. 5: SCATTER PLOT OF PROBABILITIES OF DYING 45Q15 BY METHOD AND
SELECTED AGE SEGMENTS FOR MALE POPULATION RURAL COASTAL AREA SURINAME, 2004-2012 ... 109 FIGURE 7. 6: SCATTER PLOT OF PROBABILITIES OF DYING 45Q15 BY METHODS
AND SELECTED AGE SEGMENTS FOR MALE POPULATION RURAL INTERIOR AREA SURINAME, 2004-2012 ... 109 FIGURE 7. 7: SCATTER PLOT OF PROBABILITIES OF DYING 45Q15 BY METHODS
FIGURE 7. 8: SCATTER PLOT OF PROBABILITIES OF DYING 45Q15 BY METHODS AND SELECTED AGE SEGMENTS FOR FEMALE POPULATION RURAL COASTAL AREA SURINAME, 2004-2012 ... 114 FIGURE 7. 9: SCATTER PLOT OF PROBABILITIES OF DYING 45Q15 BY AGE
SEGMENTS AND METHODS FOR FEMALE POPULATION RURAL INTERIOR AREA SURINAME, 2004-2012 ... 115 FIGURE 7. 10: RATIO PROBABILITIES OF DYING BETWEEN 15 AND 60 YEARS,
MALE BY FEMALE POPULATION OF SURINAME, 2004-2012 ... 116 FIGURE 7. 11: RATIO PROBABILITIES OF DYING BETWEEN 15 AND 60 YEARS,
MALE BY FEMALE POPULATION URBAN COASTAL AREA SURINAME, 2004-2012 ... 117 FIGURE 7. 12: RATIO PROBABILITIES OF DYING BETWEEN 15 AND 60 YEARS,
MALE BY FEMALE POPULATION RURAL COASTAL AREA OF SURINAME, 2004-2012 ... 118 FIGURE 7. 13: RATIO PROBABILITIES OF DYING BETWEEN 15 AND 60 YEARS,
MALE BY FEMALE POPULATION RURAL INTERIOR AREA SURINAME, 2004-2012 ... 119
MAP 2. 1: MAP OF SURINAME ... 9
LIST OF ANNEX FIGURES
FIGURE A 1: POPULATION CENSUS 2012 IN SURINAME BY ETHNIC GROUPS ... 130 FIGURE A 2: INFANT AND CHILD MORTALITY IN SURINAME 1950-2010 ... 130 FIGURE A 3: ABSOLUTE NUMBER OF BIRTHS, DEATHS AND NATURAL INCREASE
OF SURINAME FROM 1923-2013... 131 FIGURE A 4: ETHNIC GROUPS IN SURINAME WITH THE HIGHEST MORTALITY DUE
TO CARDIO VASCULAR DISEASE, 2004-2011 ... 131 FIGURE A 5: POPULATION GROWTH RATES OF SURINAME, SOUTH AMERICA AND
THE CARIBBEAN 1950-2010 ... 132 FIGURE A 6: NET INTERNAL MIGRATION FOR BOTH SEXES BY DISTRICTS IN
SURINAME, 2004-2012 ... 132
FIGURE B 1: NET INTERNAL MIGRATION FOR BOTH SEXES BY AGE GROUPS URBAN COASTAL AREA IN SURINAME, 2004-2012 ... 135 FIGURE B 2: NET INTERNAL MIGRATION BOTH SEXES BY AGE GROUPS RURAL
COASTAL AREA SURINAME, 2004-2012 ... 135 FIGURE B 3: NET INTERNAL MIGRATION FOR BOTH SEXES BY AGE GROUPS
RURAL INTERIOR AREA SURINAME, 2004-2012 ... 136 FIGURE B 4: NET INTERNATIONAL MIGRATION SURINAME, BOTH SEXES BY AGE
FIGURE B 5: RATIO IMMIGRATION DATA CBS TO EMIGRATION DATA CBB 1995-2012 ... 137 FIGURE B 6: AGE PATTERN OF INTERNAL MIGRATION MALE POPULATION IN
SURINAME 2004-2012 ... 137 FIGURE B 7: AGE PATTERN INTERNAL MIGRATION FEMALE POPULATION IN
SURINAME 2004-2012 ... 138
RESUMO
Na maioria dos países em desenvolvimento, omissão nos censos populacionais e omissões no sistema de registo vital são comuns. Portanto, é importante avaliar a integralidade da cobertura do registro censitário e de óbitos e realizar os ajustes necessários. Os métodos de distribuição de morte (DDM) são um dos três métodos para avaliar a qualidade dos dados e estimar a mortalidade de adultos. DDM compararam a distribuição dos óbitos por idade com a distribuição etária dos vivos e fornecem o padrão etário da mortalidade em um período de referência definido.
Nesta dissertação, o objetivo principal é avaliar a qualidade do registro de óbitos e enumeração dos censos populacionais para estimar a mortalidade de adultos no Suriname e seus principais regiões entre 2004 e 2012. Foram aplicados os métodos de distribuição de morte usando diferentes segmentos etários incluindo ou excluindo uma alta proporção de migração de pico por sexo para o Suriname e as suas regiões. Nós produzimos estimativas do grau de cobertura do registro de óbitos, ajustamos os dados e produzimos estimativas de mortalidade de adultos por sexo e para cada uma das regiões. A análise dos métodos de distribuição de morte por vários segmentos etários no estudo do Suriname e seus principais regiões é necessário por causa da presença de migração interna e internacional e porse tratar de uma população pequena.
ABSTRACT
In most developing countries, omission in population censuses and vital registration system omissions are common. Therefore, it is important to assess completeness of coverage of the census and death registration to make some adjustments accordingly. The death distribution methods (DDM) are one of the three advanced methods for evaluating data quality or otherwise estimating adult mortality. DDM compare the distribution of the deaths by age with the age distribution of the living and furthermore provide the age pattern of mortality in a defined reference period.
In this dissertation, the main objective is to evaluate the data quality of the death counts and population enumeration to estimate adult mortality in Suriname and its main regions between 2004 and 2012. We applied the death distribution methods using different age segments
including or excluding a high proportion of peak migration by sex for Suriname and its central
regions. We produced estimates of completeness of death counts coverage, adjusted the data and produce adult mortality estimates. The analysis of the death distribution methods by various age segments in the study of Suriname and its main regions is necessary because of the presence of internal and international migration in this small scale population.
The quality of the population data of Census 2004 and 2012 of Suriname and its main regions is considered to be good. With respect to the death count, the quality for the country varies from reasonable to good. The results of 45q indicates probabilities of dying for the male and female 15 population in the intervals
0.1950,0.2329
and
0.1153,0.1324
, respectively. The urban coastal area and rural coastal area show for a male and female population 45q15 close to those on a country level. However, the 45q for a male and female population of the rural interior area 15 have on average values below or above the values of the urban coastal and or rural coastal area depending on the death distribution method and the age segments adopted. The average probability of dying between 15 and 60 years of age for the male and female population in the rural interior area by different death distribution methods and age segments is in the interval1 1. INTRODUCTION
In most developing countries, a complete registration of deaths to determine mortality estimates does not exist (Timaeus, 1991; Hill, Choi, and Timaeus, 2005; Hill, 2000). Researchers mainly encounter various difficulties such as incomplete vital registration, imprecise censuses, and misreporting of age at death or age of the living (Hill, 2000; Hill, You and Chou, 2009; United Nations, 1983; Bhat 1990; Leone, 2014); Queiroz & Sawyer, 2012; Lima & Queiroz, 2014). Therefore, due to the lack of vital statistics, in most developing countries it is impossible to apply standard direct methods to produce specific mortality and or life table estimates, such as the probability of dying (n qx) at different ages (Luy, 2010).
Within this context, the research questions in this dissertation are:
1. What are the quality of the death counts and population data and the completeness of death registration in Suriname and its central regions, by sex between the Census 2004-2012?
2. What are the adult mortality levels (45q15) for the country and its central regions, by methods, age segments, and sex after correction of the population data (Census 2004 and 2012) and death counts between 2004 and 2012?
To answer the research questions, the first primary objective of this dissertation is to evaluate and analyze the data quality of death registration and the population of Suriname and its central regions. The second objective is, to determine the completeness of death reporting in Suriname and its main areas in the most recent period (2004 – 2012). Therefore, the specific objectives are:
Evaluate the data quality of the population and death count data for Suriname and its main regions using selected age heaping indexes;
To determine and analyze the indicators of adult mortality by sex for Suriname and its central areas, based on some age segments of the population which will either include or exclude age groups with peak adult migration;
Compare and analyze the results of adult mortality (45q ) after the application of the 15 DDM´s for Suriname and its main regions between methods, within methods, by sex and age segments;
To discuss the mortality differences by sex, age segments, and region;
In the process to answer the research questions the first step is to evaluate and analyze age data errors (coverage errors, failure to record age, and misreporting of age) of the population and the deceased. Moreover, are applied the DDMs which are direct methods of measures for mortality and represent the conventional or classical approach to demographic estimation (Timaeus, 1991). The completeness of death registration in Suriname and its central regions will be determined by using the following death distribution methods (DDMs). Firstly, the General Growth Balance (GGB) proposed by Hill (1987) and secondly the Synthetic Extinct Generations (SEG), the Benneth-Horiuchi method (1981;1984). Furthermore, the combined GGB-SEG method (Hill, You and Choi, 2009) will be used. Lastly, the General Growth Balance (GGB) method for migration or populations open to migration will be presented (Bhat, 2002; Hill and Queiroz, 2010), but not used in this dissertation.
These five DDMs methods were developed to apply to non-stable populations. The advantage compared to former methods is that the old methods1 assume stability2 and the newer ones do not. The distribution of deaths by age is compared with the age distribution of the living population, which in turn will afford the age array of mortality in a defined reference period (Hill, You & Choi, 2009). Additionally, the GGB method (Hill, 1987) and the method of Benneth-Horiuchi (1981; 1984) assume that the coverage of deaths and population does not vary with age. Furthermore, these methods assume no experience of net migration and proper declaration of the age of the people and the age of deaths.The GGB and SEG methods have an additional assumption that is, the coverage of the population does not vary over time. Moreover, the combined GGB-SEG method consists of applying the GGB method to estimate
1
The old methods are the Growth Balance (Brass, 1975) and the method of Preston et.al (1980)
2 A population is stable if three conditions prevail for a long enough period: 1) the growth rate in the annual
the change in Census coverage, adjusting the expected change and then using the SEG method. The GGB method for migration (Bhat, 2002; Hill and Queiroz, 2010) that is applied to populations affected by substantial net migration requires the same assumptions as the GGB (Hill, 1987) method.
The second step, after analyzing the quality of mortality data is to estimate the probability of dying between 15 and 60 years (45q ). The likelihood of dying between 15 and 60 years 15 (45q ) is an indicator that is used to measure adult mortality. The choice of 15 45q is done 15 because it is a summary measure of adult mortality for the death distribution methods (Hill, 2000).
For small population countries such as Suriname, which suffers from the effect of international and/or internal migration (emigrants and immigrants) the impact of relocation is strongly notable in the growth rate of the population in some periods3. Therefore, it is necessary to consider migration effects in the estimation of adult mortality. According to GBS (2006), the results of the pattern of survival ratios for both sexes of the age groups 5-9 up to 25-294 are not acceptable from censuses between 1980- 2004. The explanation given is that also migration should have had an effect on the survival ratios, besides the mortality effect.
The estimates of adult mortality in the country and regional level are of paramount interest for Suriname. Mainly because of the small possibility of conducting registration in the hinterland of the country. Furthermore, the four category of problems identified by GBS concerning registration of vital statistics5, and the presence of international net and net internal migration (positive or negative) are of great importance. Another justification for estimating adult mortality regionally in Suriname is in the scope of improvement of national planning on quality control data of the death. Moreover, establishments of more CBB offices in remote areas and the continuous improvement of access to health services in all parts of the country
3 The exponential growth rate of the population of Suriname from census 1972 to census 1980 was - 0.06634.,
based on Census data of General Bureau of Statistics (GBS) of Suriname. According to data of the United Nations (World Population Prospects 2012) the growth rate of the population of Suriname was negative (-0.429) from 1970-1975(a period of peak international migration in Suriname (CBB)).
4 Survival Ratios Census 1980-2004 for age groups 5-9, 10-14, 15-19, 20-24 and 25-29 are 0.7910, 0.7526,
0.7624, 0.8366 and 0.9492, respectively (GBS, 2006) 5
is necessary. According to Kibele (2012), between regions of one country, significant differences in probabilities of dying and life expectancy may exist. Likewise, mortality can be differentiated by the socio-economic status of the population.
Another important fact to study mortality in Suriname and its central regions is that the country has diverse ethnic compositions, cultural characteristics and areas of tiny and disperses population. The study of small areas by sex results in the rare occurrence of death in single ages and thus affects the outcome of the adult mortality indicators. Investigating adult mortality in Suriname is interesting within the context of its characteristic in South –America namely being part of the Guyana’s with the smallest populations and not being culturally part of the Latin America but of the Caribbean. The adult mortality study of the central regions in Suriname is also relevant because there exist few mortality studies in these areas, and the health services and infrastructure are different in the three regions. The best health infrastructure and services are in the capital Paramaribo, part of the urban coastal area.
It is clear that the differences in regional development, population density, and infrastructure concerning the presence of CBB registration offices for birth and death might have a significant effect on the estimation of probabilities of dying by sex in the various regions of Suriname. Considering some socio-economic characteristics of Suriname we observe differences between the major areas. The urban coastal area has the highest Human Development Index6 of 0.715, followed by the rural coastal area with a value of 0.688 and the rural interior area with 0.599 (HAD, 2013). With respect to a significant social characteristic in Suriname for 2006 and 2009, the average year of schooling7 for the urban coastal area, the rural coastal area, and rural interior area presents the values of 9.4 years, 8.28 years and 5.03 years, respectively (HAD, 2013). The Multidimensional Poverty Index8 of 2009/ 2010 in Suriname also shows that the urban coastal area (0.009) presents better results than the rural
6
The Human Development Index (HDI) is a summary measure of human development. It measures the average achievements in a country in three basic dimensions of human development: a long and healthy life, access to knowledge and a decent standard of living (Source: GBS).
7 Mean years of schooling is defined as the average number of years of education received by people ages 25
and older in their life time based on education attainment levels of the population converted into years of schooling based on theoretical durations of each level of education attained (Source MICS 3 AND MICS4). In Suriname it takes between 12 and 14 years to complete the secondary senior school, depending on the school type and considering no repetition of class (Ministry of Education and Science of Suriname).
8 The Multidimensional Poverty Index (MPI) allows to identify the poor, excluded and vulnerable group of
coastal area (0.014) and rural interior area (0.098). The HAD (2013) shows that for the economic indicator Gross National Income per capita9 for 2009 (GBS) the best result is for the urban coastal area (7521 USD), followed by the rural coastal area (6321 USD) and the rural interior area (6340 USD). Regarding the percentage of the population using an improved sanitation facility in 2010, the urban coastal area, rural coastal area and rural interior area has the 98.05%, 95.66%, and 60.33%, respectively10. The percentage of the population using an improved water drinking source was in 2010 for the urban coastal area, rural coastal area, and rural interior area 98.25%, 97.6%, and 81.67%, respectively11.
All these indicators presented here resume in their one way the differences in the social and economic development of the central regions in Suriname. The region with the best results for the indicators is the urban coastal area followed by the rural coastal area and the rural interior area.
Therefore, the hypothesis of this study is that there will be differences as well in the probability of dying 45q15 and consequentially in adult mortality by main regions and sex. To see the difference between male and female 45q15 in this dissertation, the ratio of the male to the female probability of dying between 15 and 60 years is used. To observe the differences of 45q15 between the methods the comparison is made on the different age segments by sex and for Suriname and regions.
In Suriname, currently, the actual estimation of life expectancy is conducted without the quality control of death counts (GBS, 2011). Moreover, the existence and gradually expansion of civil registration systems in all districts as well as the international and internal migration have an effect on the quality of mortality data. Therefore, this study using DDM´s is of paramount interest for Suriname, because the 45q15 will be estimated after evaluation of data quality of the population and the death counts. Altogether, this dissertation will contribute to the demographic research regarding the assessment of data quality of mortality
9
Gross National Income per capita is defined as the sum of value added by all resident producers in the economy plus any product taxes (less subsidies) not included in the valuation of output plus net receipts of primary income (compensation of employees and property income) from abroad, divided by midyear population. Value added is the net output of an industry after adding up all outputs and subtracting intermediate inputs (Source: GBS)
in less developed countries (South – America and the Caribbean) and small populated countries with the presence of international net and internal net migration. This study also provides the information of sensitivity of the application of the DDM´s in a country with primary regions of different socio-economic development and areas of tiny scale.
The results presented in this dissertation concerning the evaluation of the quality of death counts reveal that the death numbers of Suriname vary from precise to less accurate and to acceptable. According to GBS, the population data of Census 2004 and 2012 also indicate to be reasonable12. After applying the GGB, SEG, Hybrid GGB-SEG methods by different age segments different results are observed for the three methods adopted regarding the adjusted probability of dying 45q15 on country level and central regions about the unadjusted45q15. The application of the Hybrid GGB-SEG method for the male and female population for different selected age segments including or excluding age groups of peak migration presents higher values for45q15in comparison with the GGB and SEG method. This is in the case in nearly all the age segments compared to the results of the adopted GGB method for Suriname and its central regions. It is clear that the choice of the age segments for the calculation of the probability of death between 15 to 60 years, 45q15 using the Hybrid GGB-SEG method, results in big or small differences regarding the GGB method. The differences in the values of
15
45q after application of these two methods depend on the choice of the age segments and
the migration pattern of the region in study.
For the urban coastal area, rural coastal area, and for Suriname for the male and female population the values of 45q15 are lower for the SEG method than for the GGB method using age segments excluding a high proportion of migration. For the rural interior area for the male population the values of 45q15are much higher for the SEG method than for the GGB method for age segments excluding age groups with a high proportion of migration. Furthermore, for the female population, the results in the rural interior show small differences for the SEG method in comparison with the GGB method. Likewise, for some age segments excluding peak migration there is a higher and for others a lower difference. As Hill, You and Choi (2009) mentioned the GGB and SEG method are very sensitive to net migration. The
12 Whipple´s Index for Census 2004 was respectively for male and female, 100.4 and 102.0; Whipple´s Index for
SEG method is less sensitive to age misreporting or differential coverage by age than the GGB method. Increasing or decreasing coverage of deaths by age affects GGB more than SEG (Hill and Choi, 2004). Consequently, the results of lower or higher values of 45q15 for, the different age segments and methods applied can be better understood. Even the GGB as the SEG method gives an improvement over unadjusted data (Hill and Choi, 2004). On the results of the Hybrid GGB-SEG methods for some adjustment age segments of the GGB method, the values of 45q15 are for some age segments higher, lower or nearly the same as the values of 45q15 for the SEG or GGB method. These depend on the choice of age segments including a large proportion of peak migration and the central region in question. This dissertation contains nine Chapters, whereby the second Chapter addresses antecedents of Suriname with respect to Socio-Economic and Demographic characteristics, general view of demographic dynamics, and the civil register system in the country. In the third Chapter, information regarding the data of death and population is provided beside the presentation of the methodology for the evaluation of the quality of the population and mortality data. Additionally, the methodology of the Death Distribution Methods is presented in Chapter three.
2. ANTECEDENTS: SOCIO-ECONOMIC DIFFERENCES BY REGION IN SURINAME, DEMOGRAPHIC DYNAMICS IN SURINAME, MORTALITY IN SURINAME BASED ON CENSUSES 1950, 1964, 1972, 1980, 2004 AND 2012, DEATH REGISTER IN SURINAME
In this chapter socio-economic and demographic characteristics of Suriname and its main regions are presented. Also, a general view of the demographic dynamics in Suriname is given through the graphical presentation of the age-sex composition of the population in Census 2004 and 2012. Furthermore, some demographic indicators related to the age-sex structure in the last two Censuses held (2004 and 2012) are presented. In the second part of the chapter an overview of mortality and fertility transition and migration, information is given. In the third part, a brief discussion of the functioning of the civil registration system in Suriname and its central regions with respect to the register of death is pointed. The last part presents some final remarks.
2.1 Socio-Economic differences and demographic characteristics in Suriname and its main regions
MAP 2. 1: MAP of Suriname
Source: http://suriname.startsuper.nl/14455-landkaart-suriname.html
http://members.casema.nl/h.schot/beeldenweb/surkaart780.gif (accessed February 2015)
population density13, 0.3 habitants/km2followed by district Coronie with
2
/ tan 8
.
0 habi ts km and district Brokopondo with 2.0habitants/km2 in Census 2012. TABLE 2. 1: Area Suriname by districts, total population and population density Censuses 2004 and 2012 of Suriname
DISTRICTS AREA CENSUS CENSUS
POPULATION DENSITY
POPULATION DENSITY 2004 2012 CENSUS 2004 CENSUS 2012 Paramaribo 182 242946 240924 1334.87 1323.76
Wanica 443 85986 118222 194.10 266.87
Nickerie 5353 36639 34233 6.84 6.40
Coronie 3902 2887 3391 0.74 0.87
Saramacca 3636 15980 17480 4.39 4.81
Commewijne 2353 24649 31420 10.48 13.35
Marowijne 4627 16642 18294 3.60 3.95
Para 5393 18759 24700 3.48 4.58
Brokopondo 7364 14215 15909 1.93 2.1
Sipaliwini 130567 34136 37065 0.26 0.28
TOTAL 163820 492839 541638
Source: GBS, 2004 and 2012
In FIGURE 2.1 the population of Suriname in census 2012 is presented in percentages by districts. The capital district Paramaribo has the highest percentage (44%) of the population and district Coronie has the smallest percentage (1%) of the population in Suriname. The institutional de jure population and particular groups14 were in Suriname in Census 2012 about 1.24 % of the total population, whereby 69.97 % were men and 30.03% (GBS, 2013).
13
Population density is the number of inhabitants divided by the area they populate
14 De jure institutional population is the population who were at the moment of the Census in hospitals,
FIGURE 2. 1: Census population of Suriname by district in 2012
Source: Data GBS, 2012
The primary economic activity in Suriname is mining and in minor terms agriculture. The minerals Gold, Oil, and Alumina, cover 95% of the export of Suriname (WORLDBANK, 2011). According to an IMF report, the estimation is that Suriname has grown by 4 percent in 2012, buoyed by the oil and gold sectors, as well as public investment15.
According to the World Bank Suriname is considered to be an upper middle-income country (2011)16. FIGURE 2.2 presents the Gross Domestic Product (GDP) of Suriname in the period 2006-2014. The GDP of 1.79 billion USD in 2006 increased up to 5.23 billion USD in 2014.
15
http://www.imf.org/external/pubs/ft/survey/so/2013/car011013a.htm (accessed on 23 of September 2015) 16http://chartsbin.com/vieuw/2438 (accessed 22 of September 2015); Upper middle income countries are
according to the classification of the World Bank countries with a per capita income in USD in the range 3976-12275
44%
22% 6%
1% 3%
5% 6%
3% 3%
7%
Paramaribo
Wanica
Nickerie
Coronie
Saramacca
Para
Commewijne
Marowijne
Brokopondo
FIGURE 2. 2: GDP of Suriname in Billion USD, 2006-2014
Source: Data Worldbank
According to GBS (2013), the activities of the bauxite sector in Suriname existed for the production of bauxite, alum earth and aluminum until 2000. The stop of the manufacture of alum earth took place in 2000 because of: 1) the lack of enough energy, 2) the old process of the aluminum smelter, 3) high production cost of aluminum, and 4) the decline in the demand for aluminum on the world market. In 2008, the BHP Billiton Suriname took the decision to leave Suriname until 2012. Significant parts of the operation of Billiton were already stopped in 2009. The reasons for the departure of the multinational BHP was that the reserves in the existing concession areas were terminated, and there was not achieved a concordance with the state for new exploitation areas. At the end of November 2015, ALCOA also left Suriname. Based on the above-stated development of the bauxite sector in Suriname, some labor places were lost and thus affected the household income and consequently the overall welfare of those families and the country. As we can observe, Suriname needs to diversify more its economy to guarantee state revenue for mainly good health, education, and other policies. On the one hand, in Suriname the labor force participation rate for the age group, 15-64 increased from Census 2004 to Census 2012 for the male, female and total population. On the other hand, the unemployment rate decreased from Census 2004 to Census 2012 for the male, female and total population in Suriname. TABLE 2.2 presents the results calculated based on data of GBS. The unemployment rate in the total population was in census 2004 and 2012,
8.77 and 7.88, respectively and it decreased between both censuses. 1.79
2.63
2.94
3.53
3.88
4.37 4.42
5.01 5.23
0 1 2 3 4 5 6
2006 2007 2008 2009 2010 2011 2012 2013 2014
G
DP
TABLE 2. 2: Economic status population 15-64 in Suriname Census 2004 and Census 2012
Sex
CENSUS 2004 CENSUS 2012
Employed Unemployed Employed Unemployed
Male 65.82 7.81 68.50 6.11
Female 35.52 9.66 39.42 9.63
Total 50.69 8.77 53.84 7.88
Source: Census data 2004 and 2012, GBS
The social and economic development is diverse in the different districts of Suriname. The districts Paramaribo, the capital of Suriname, and district Wanica, which belong to the urban coastal area, has 66 % of the whole population living there. A significant part of the population of Wanica works in the capital. Paramaribo is the most important economic and trade center of the country and in district Wanica, the economic activity is horticulture and cattle breeding17.
In district Brokopondo, there is the only hydroelectric installation of the country, besides the National Nature Park. The economic activities are gold mining and forestry. A great part of the Marroon population lives in district Brokopondo. District Sipaliwini is for 90% composed of rainforest, and the Central Suriname National Reservation is part of it. The population of district Sipaliwini is composed by Indigenous and part of the Marroon population. In district Marowijne, the economic activities are Fishery, Mining, Trade with French Guyana, deforestation, and tourism18.
District Commewijne is characterized by the successful history of the plantations, and the economic activities are tourism, agriculture, cattle breeding, and fishery. The economic activities in district Saramacca are Mining of Petroleum, agriculture, and horticulture. In district Para, the economic activity is tourism. Concerning district Coronie, the economic activity is agriculture, cattle breeding, and fishery. In district Nickerie, the second biggest city of Suriname the economic activity is mainly agriculture, namely the plantation of rice and banana. Aquaculture is also an economic activity in district Nickerie 19. Besides the small population of Suriname the peculiar thing is that based on history, Suriname is composed of different ethnic groups and thus can be considered a multicultural society. FIGURE A1, in
17
ANNEX A, depicts detail information of the ethnic population composition in the last Census of 2012. The biggest population group in Suriname in Census 2012 is the Indian group (27.41%) followed by the Maroon group (21.71%), the Creole (15.68%) and Javanese (13. 66 %).
2.2 General view of the Demographic dynamics in Suriname
To have a better understanding of this mortality study of Suriname, it is important to present first a percent pyramid of the last two Censuses held in Suriname (2004 and 2012). The percent pyramid shows the differences or changes in the proportional size of each age-sex groups (Shryock and Siegel, 1980). FIGURE 2.3 and FIGURE 2.4 show the population by sex and age composition in Census 2004 and Census 2012, respectively. Census 2012 present in relation to Census 2004 a smaller base and migration effects are also observed in the young adult age groups in both censuses. Furthermore, Pyramid 2012 also reveals the fertility decline in Suriname about Census 2004.
FIGURE 2. 3: Pyramid Census 2004, Suriname
Source: Census data 2004 (GBS)
6.00 4.00 2.00 0.00 2.00 4.00 6.00
0-4 10-14 20-24 30-34 40-44 50-54 60-64 70-74 80-84 90-94
Percentages
Female
FIGURE 2. 4: Pyramid of Census 2012, Suriname
Source: Census data 2012 (GBS)
Shryock and Siegel (1980) mention that age is the most significant variable in the study of mortality, fertility, migration and other areas of demographic analysis. Based on the age-sex composition the percentage of the population in each age group the so-called age total dependency ratio20 can be calculated. The TDR provides the information about the population which is economically dependent concerning those who are in their working age. TABLE 2.2 presents percentages of main age groups for Census 1950, 1964, 1972, 1980, 2004 and 2012. TABLE 2. 3: Percentages main age groups Censuses held in Suriname 1950-2012
Census Census Census Census Census Census Age groups 1950 1964 1972 1980 2004 2012 0-14 41.2 46.6 48.3 39.7 30.0 27.6
15-59 51.7 47.2 45.7 53.8 61.4 62.2
60+ 7.0 6.2 6.1 6.6 8.6 10.1
Total 100 100 100 100 100 100
Source: Data GBS, Census 1950, 1964, 1972, 1980, 2004 and 2012
20
The age dependency ratio is the variation in the proportions of children, aged person and working age population (Shryock and Siegel, 1980). In formula the age dependency ratio or total dependency ration is
100 * 64 15
65 14 0
P P P TDR
6.00 4.00 2.00 0.00 2.00 4.00 6.00
0-4 10-14 20-24 30-34 40-44 50-54 60-64 70-74 80-84 90-94
Percentages
Female
Since 1972 the population of 0-14 is declining, while the population of 15-59 and 60+ is increasing. The decrease in the age group 0-14 from 1950 to 2012 is about 13.6 %. For the age groups 15-59 and 60+ the increase for the same period is 10.5 % and 3.1%, respectively. In FIGURE 2.5 we observe the development of the child dependency ratio (CDR)21, old age dependency ratio (ODR)22 and the total dependency ratio from 1950-2050 of Suriname, based on data of the United Nations. It is a clear that the TDR is declining after 1975 up to 2020 and then increase again as a consequence of the rise of the ODR after 2015. However, the CDR is declining after 1975 up to 2050.
FIGURE 2. 5: Total dependency ratio, Child dependency ratio and Old age dependency ratio of Suriname 1950-2050
Source: World Population Prospects 2012 (UN)
or *100
In Suriname, the decline of mortality and fertility started between 1965 and 1970. The effects of international migration in the period 1973-1980 are also notable in the small distance between the TDR and the CDR. Furthermore, the decline in TDR and CDR is very steady after 1975, due to international migration. With this discussion, we observe that Suriname is still in the middle process of the first demographic transition. The demographic transition involves the fertility and the epidemiological transition (Thompson, 1929; Notestein, 1954). The fertility transition implies the change of high fertilities to lower ones. The epidemiological transition refers to the decline of acute infectious disease and the increase in the degenerative disease (Omran, 1971). As can be observed Suriname is date 2016 in the third phase of the demographic transition, namely the demographic dividend23 and simultaneously in the beginning stage of the aging process. In Census 2012 the share of the working-age population was 62.2 % in Suriname.
In TABLE 2.4 the child, old age and total dependency ratios for the central regions of Suriname for Census 2004 and Census 2012 are presented. As can be seen, the child dependency ratio for the rural interior area is near twice the one of the urban coastal area in 2004 and 2012, respectively. The old age dependency ratio between the three regions does not differ a lot in both censuses.
TABLE 2. 4: Dependency ratios main regions Suriname Census 2004-2012 URBAN
COASTAL
RURAL COASTAL
RURAL
INTERIOR SURINAME
DEPENDENCY CENSUS 2004
RATIOS
CDR 0.4423 0.4778 0.8076 0.4896
ODR 0.1389 0.1436 0.1484 0.1409
TDR 0.5812 0.6214 0.9561 0.6306
DEPENDENCY
RATIOS CENSUS 2012
CDR 0.3949 0.4200 0.8078 0.4443
ODR 0.1655 0.1505 0.1693 0.1628
TDR 0.5604 0.5705 0.9771 0.6071
Source: Data based on Census data 2004 and 2012, GBS
On the total dependency ratio, we notice that the rural interior area has the highest one within the three regions in both censuses. This high result of the overall dependency ratio in the rural interior area is due to the high child dependency ratio in this small populated area. So, the
working age population in the rural interior area is of a smaller proportion compared to this population in the urban coastal and rural coastal area.
2.2.1 Mortality overview
The analysis of the death statistics from Centraal Bureau Burgerzaken - CBB of Suriname depends on the demographic data from the census or yearly population estimation. The results of CBB may suffer from incomplete registration of birth and death mostly in the period of the sixties, seventies, and eighties. Possible explanation is that the geographical location of the rural population concerning support offices of CBB was in that time not nearby, and thus, they had not the possibility of these communities to register birth and death on time. In the past, there were also less registration support offices of CBB in the country and the central regions of Suriname in comparison with nowadays. Moreover, FIGURE A3 in ANNEX A presents the absolute number of deaths and births in Suriname from 1924-2013.
Important information in this mortality study is on the leading causes of death because a better understanding of mortality in Suriname takes place. For Suriname the main 50 causes of death published by World Health Rankings in 2011 reveal that number one was the stroke (21.08%) followed by coronary heart disease (13,01%) and HIVAIDS (6,38%). Data of Bureau Openbare Gezondheidsdienst (BOG) for the period 2004-2011 (ANNEX A, TABLE A1) show that the mean percentage of the three leading causes of death in Suriname was the cardiovascular and Cero vascular disease (27.94%), followed by Accidents and Violence (12.05%) and Maligne Neoplasms (11.36).
On external causes of deaths in 2011, the information of BOG is that 33.9 % of the external causes of deaths were suicide, and 23.7% of the apparent category deaths were traffic accidents on land. Based on the data of BOG mortality in the urban coastal area was due to cardiovascular diseases in 2008, 2009, 2010 and 2011 respectively, 63.49%, 61.84%, 62.99 %, and 62.84 %. FIGURE A4 in ANNEX A depicts the results for the five ethnic groups with the highest percentage of the cause of death due to cardiovascular diseases in Suriname for the period 2008-2011. As can be seen the greatest group of mortality as a result of cardiovascular disease are the Indian population followed by the Creole and the Javanese. 2.2.2 Fertility Transition
Suriname. FIGURE 2.6 show that the Total Fertility Rate (TFR) of Suriname was from 1950-1975 above the TFR of South America and the Caribbean. From 1950-1975 – 1990 the TFR of Suriname was below of the values of South-America or the Caribbean. For the period 1990-2010, the TFR of Suriname is higher than for the regions. The result of lower TFR for the period 1975-1990 is an effect of the vast exodus of Surinamese’s of 123.780 persons to the Netherlands from 1973-1980, due to the independence in 1975. The midyear population of Suriname in 1975 was approximately 364.499 and the population at the end of the year was 350.309 (CCB, 2002). In 1975, the emigration to the Netherlands was of 39.699 habitants which are 32.07 % of the emigration for the period 1973 - 1980 (CBB, 2002).
FIGURE 2. 6: Total Fertility rates of Suriname, South America, and the Caribbean 1950-2010
Source: World Population Prospects 2012, UN
In Suriname, for the lifetime fertility, we can observe some differences in the various ethnic groups. According to GBS (2012), the Maroons presents the highest total fertility rate in Census 2004 and 2012, respectively 2.8 and 2.9. The total fertility rate is the number of children a woman may have if she survives at the end of her reproductive period (Preston et al., 2001).
The Javanese population and other groups had a total fertility rate of respectively 2.0 in Census 2004 and 2012. For Census 2004 and 2012, the total fertility rate of the Indian population was respectively, 1.9. TABLE A2 and TABLE A3 in ANNEX A present the
age-0 1.00 2.00 3.00 4.00 5.00 6.00 7.00
1950 1955 1960 1965 1970 1975 1980 1985 1990 1995 2000 2005
T
F
R
Years South America
Suriname
specific rates and the total fertility of the population by ethnic groups respectively, in census 2004 and 2012.
FIGURE 2.7 shows the age-specific fertility rates (ASFR) for census 2004 and 2012. ASFR is the number of births in a particular period divided by the person-years lived off the population in question during the same period (Preston et al., 2001).
FIGURE 2. 7: Period age-specific fertility rates in Suriname Census 2004-2012
Source: Census data 2004 and 2012, GBS
In Census 2012, ASFR is higher for the age groups 25-29, 30-34 regarding Census 2004. In Census 2012 adolescent ASFR declined 0.0179 in relation to census 2004. For age group 20-24 ASFR is nearly the same in both Censuses. The total fertility rate (TFR) in Census 2004 and 2012 are respectively, 2.53 and 2.56 (GBS, 2012).
2.2.3 Migration
On migration, we observe that international and internal migration occurs in Suriname. FIGURE 2.8 presents the international net migration history of Suriname from the period 1972-2013. As can be seen, the peak period of negative net international migration was from 1973-1975 and 1980. Crucial years were the year of the independence in 1975 and the year in which a military coup took place in 1980. After 2005, the net international migration in Suriname is active probably due to public policy “Clean Sweep” of the Surinamese government to incentive illegal pork knockers and garimperios and others strangers to
0 0.02 0.04 0.06 0.08 0.1 0.12 0.14 0.16
15-19 20-24 25-29 30-34 35-39 40-44 45-49
ASFR
Age groups
2004
become legal (registration as immigrant). The operation “Clean Sweep” started in July 2008 and had the intention to organize the small-scale gold mining in the hinterland of Suriname (Fernand, A. I., 2009). Currently, the Surinamese government makes efforts to organize the small-scale gold mining.
FIGURE 2. 8: International net migration in Suriname 1972-2012
Source: Data CBB, 1972-2012
Furthermore, FIGURE A5 in ANNEX A present the effects of international migration on the population growth rate of the Surinamese population compared to Southern American and the Caribbean countries. The impact of international migration in FIGURE 2.9 observed is also reflected in FIGURE A5, ANNEX A. The growth rate of the Surinamese population was for the period 1970-1975 negative (-0.429), based on data from UN.
As the FIGURES B6 and B7 in ANNEX B show the age structure of internal migration of the male and female population of the country is not the same for the period 2004 - 2012. The male population has its maximum value in the ages 0 - 4 and is a declining up to 15 - 19 to reach a maximum again in the age 20 - 24, which is a lower peak than the one in age 0-4. For a female population, the age structure of migration presents a steadier increase after age 10 - 14 to reach its peak at age 20 - 24, a higher one than for age 0 - 4. After age group 20 - 24 the proportion of female migrants decline. Common for the male and female population is that age 20-24 presents peak migration. However, the percentage of female population in age groups 20-24 is on average higher than for male population in the period 2004-2012. The
explanation of the differences in migration pattern between male and female population can only be given after a qualitative research.
According to data of GBS (2011) the internal migrants move more from the rural interior area to the urban coastal area, from the rural coastal area to the urban coastal area and from the rural interior to the rural coastal area. The internal migration in 2012 from rural interior area to urban coastal area and from rural coastal area to urban coastal area was 78.04 % and 77.49 % of the internal migrants, respectively.
The yearly movement of people from the urban coastal to the rural interior area is on average smaller than to the rural coastal area. In 2012, the movement of people from urban coastal to rural coastal and to the rural interior was 29.20 % and 12%, respectively. The movement within the urban coastal area was in 2012 nearby 58.80 %. In FIGURE A 6 in ANNEX A, the net internal migration in Suriname by districts for the period 2004 -2012 is depicted. TABLE 2.5 presents the mutual migration flows in absolute numbers of urban coastal, rural coastal and rural interior districts for the period 2004-2009.
TABLE 2. 5: Mutual migration flow (absolute numbers) main regions Suriname, 2004-2009
FROM
Year
TO
Urban Coastal Rural Coastal Rural Interior
2004 2005 2006 2004 2005 2006 2004 2005 2006
Urban Coastal - - - 1907 2195 1597 726 959 810
Rural Coastal 1932 1985 1900 - - - 164 192 160
Rural Interior 1317 1585 1360 225 312 155 - - -
FROM
Year
TO
Urban Coastal Rural Coastal Rural Interior
2007 2008 2009 2007 2008 2009 2007 2008 2009
Urban Coastal - - - 1825 2002 1909 964 882 783
Rural Coastal 2219 2090 1805 - - - 194 170 216
Rural Interior 1498 1489 1195 243 337 211 - - - Source: GBS, 2011
2.3 System of civil register of mortality in Suriname and its main regions
BOG, a department of the Ministry of Health and the Centraal Bureau voor Burgerzaken (CBB) of the Ministry of Internal Affairs are involved in the collection of death count data. However, the registration of mortality of citizens is done at CBB. According to a colonial law of June 5 of 1944 all the babies who born and died before the registration of birth are not registered as death (Surinaams Burgelijk Wetboek, Boek 1, and article 43)24. In the Nieuw Burgelijk Wetboek, Boek 1, Article 19i; 2 the registration of birth and death is done if the child dies within the period of legal registration of birth (five days) mention in article 19e; 6. Further, the law states that the register of death should happen within 24 hours after the death in the capital Paramaribo and seven days after death in the other districts (Nieuw Burgelijk Wetboek, Boek 1, article 19h; 4, 2011)25. The registration of death could be done personal or by written through a family member or other person of the one who died26. In case, the register is not done within the period determinate by the law the civil servant of the Central
24http://www.dna.sr/media/19726/burgelijk_wetboek.pdf (accessed on 07 February 2015) 25http://www.gov.sr/sr/ministerie-van-juspol/documenten (accessed on 07 February 2015)