© 2004 Museu de Ciències Naturals ISSN: 1578–665X
Kendall, W. L., 2004. Coping with unobservable and mis–classified states in capture–recapture studies. Animal Biodiversity and Conservation, 27.1: 97–107.
Abstract
Coping with unobservable and mis–classified states in capture–recapture studies.— Multistate mark– recapture methods provide an excellent conceptual framework for considering estimation in studies of marked animals. Traditional methods include the assumptions that (1) each state an animal occupies is observable, and (2) state is assigned correctly at each point in time. Failure of either of these assumptions can lead to biased estimates of demographic parameters. I review design and analysis options for minimizing or eliminating these biases. Unobservable states can be adjusted for by including them in the state space of the statistical model, with zero capture probability, and incorporating the robust design, or observing animals in the unobservable state through telemetry, tag recoveries, or incidental observations. Mis–classification can be adjusted for by auxiliary data or incorporating the robust design, in order to estimate the probability of detecting the state an animal occupies. For both unobservable and mis–classified states, the key feature of the robust design is the assumption that the state of the animal is static for at least two sampling occasions.
Key words: Temporary emigration, Robust design, Auxiliary data, Metapopulation, Breeding probability. Resumen
Cómo abordar los estados inobservables y clasificados incorrectamente en los estudios de captura– recaptura.— Los métodos de marcaje–recaptura de estados múltiples brindan un excelente marco conceptual para considerar la estimación en los estudios de animales marcados. Los métodos tradicionales incluyen las dos hipótesis siguientes: (1) cada uno de los estados que ocupa un animal es observable; (2) el estado se asigna correctamente en cada momento. Fallos con cualquiera de estas dos hipótesis pueden traducirse en estimaciones sesgadas de parámetros demográficos. El presente estudio analiza las opciones de diseño y análisis para minimizar o eliminar estos sesgos. Los estados inobservables pueden ajustarse incluyéndolos en el espacio de estados del modelo estadístico, con cero probabilidades de captura, e incorporando el diseño robusto u observando los animales en estado inobservable mediante telemetría, recuperaciones de marcas u observaciones fortuitas. La clasificación errónea puede ajustarse mediante datos auxiliares o incorporando el diseño robusto, con objeto de estimar la probabilidad de detectar el estado que ocupa un animal. Tanto para los estados inobservables como para los clasificados erróneamente, la característica clave del diseño robusto se basa en la hipótesis de que el estado del animal es estático como mínimo en dos muestreos.
Palabras clave: Emigración temporal, Diseño robusto, Datos auxiliares, Metapoblación, Probabilidad de reproducción.
William L. Kendall, USGS Patuxent Wildlife Research Center, 12100 Beech Forest Road, Laurel, MD 20708, U.S.A.
Coping w it h unobse r va ble
a nd m is–cla ssifie d st at e s
in c a pt ure –re c a pt ure st udie s
I nt roduc t ion
The development of multi state mark–recapture (MSMR) methods dates back to the late 1950’s (Darroch, 1961) for short–term studies and the early 1970’s (Arnason, 1972, 1973) for longer term studies. MSMR methods saw little use until the late 1980’s (good ideas often take a while to catch on, and this usually requires usable software). At that time Hestbeck et al. (1991) used a maximum like-lihood approach and program SURVIV (White, 1983) to estimate annual survival and movement prob-abilities for wintering Canada Geese (Branta canadensis). Whereas Arnason’s work modeled movement probability as a first–order Markov proc-ess, Hestbeck et al. (1991) utilized a memory model, where an animal’s movement depended not only on its current location, but on its location in the previ-ous time period. In Nichols et al. (1992) and Nichols et al. (1994), respectively, state transitions are not geographic movements, but transitions between phenotypic states (weight classes or breeding states, respectively). Schwarz et al. (1993) provided a fuller treatment of the theory for the Arnason model for recaptures and tag recoveries (Schwarz et al., 1988, had first addressed estimating movement from tag recoveries), and Brownie et al. (1993) provided the theory for the memory model, as well as relatively user–friendly software, MSSURVIV (Hines, 1994).
The basic MSMR model (without memory), com-monly called the Arnason–Schwarz model, can be viewed as a multi–state extension of the Cormack– Jolly–Seber (CJS) model, where the state an animal occupies changes stochastically from time period to time period (Williams et al., 2002, section 17.3). These states can be geographic (e.g., breeding, wintering, or stopover areas) or phenotypic (e.g., size classes, breeding states, disease states), and are discrete (e.g., weight which is continuous is partitioned into classes). Some geographic and phenotypic states either do not change over time (e.g., sex), or change completely deterministically (e.g., age), and therefore MSMR methods have not been necessary for accounting for them (Pollock, 1981; Lebreton et al., 1992). However, to exploit emerging methods for testing goodness of fit (Pradel et al., 2003; Pradel et al., in press) and new software (Choquet et al., 2004), Lebreton et al. (1999) found it convenient to consider all mark–recapture models as special cases of MSMR models.
Previous Euring proceedings have included re-views of MSMR modeling. Nichols et al. (1993) and Nichols & Kaiser (1999) reviewed their use in esti-mating movement. Nichols & Kendall (1995) and Viallefont et al. (1995) demonstrated their useful-ness in testing hypotheses in evolutionary ecology. Lebreton & Pradel (2002) and Williams et al. (2002, section 7.3) provided more recent thorough reviews. The assumptions of the Arnason–Schwarz model include the following: (1) each animal in state r at time i has the same probability of surviving to time i + 1 (Sir), of transitioning, given it survives, to any
state s just before time i + 1 ( irs), and of being
observed at time i + 1 (ps
i + 1), given it is present; (2) marks do not affect the survival or behavior of the animal, are not lost, and are recorded correctly; (3) each animal is independent with respect to survival, transitions, and detection probability; (4) each ani-mal is available for detection at every capture occasion, and (5) the state of each animal is as-signed without error at each capture occasion. In this paper I will focus on violations of the last two assumptions, reviewing what can be done to adjust for unobservable or mis–classified states.
Discussion in subsequent sections will benefit from a quick review of the structure of MSMR mod-els. Survival and transition among two states from time i to i + 1 is characterized in figure 1. Two sample encounter histories for a three–period study of this population are presented below, along with the probability structure for these histories condi-tional on first release at time 1:
AAA A0A
For the second history the animal could have been in either state at time 2. Whereas with the CJS model an interior zero in a capture history implies the animal was there but not detected, with MSMR models the probability structure must acknowledge uncertainty about where the animal is at that time. This model becomes more complex as the number of time periods or states grows, and its full expres-sion is more easily presented in terms of transition matrices and capture probability vectors (Schwarz et al., 1993; Brownie et al., 1993). Software developed to implement this model includes MSSURVIV (Hines, 1994; also includes the memory model), MARK (White & Burnham, 1999), and M–SURGE (Choquet et al., 2004).
Barker et al. (in review) and Kendall et al. (in review) developed models to combine MSMR data with tag recoveries. The latter paper included esti-mation of movement from capture to recovery states, and found that all parameters are estimable if the number of recovery areas does not exceed the number of capture states, and if recovery occurs shortly after recapture (as is assumed in North American waterfowl studies). Barker’s model is avail-able in program MARK and the Kendall et al. model is available from J. Hines in program MSSRVrcv
(www.mbr-pwrc.usgs.gov/software).
U nobse r va ble st a t e s
probability actually estimates the product of capture probability and the probability the animal is in the study area. In this case estimation of survival prob-ability is unaffected. However, the Jolly–Seber esti-mator for population size actually estimates the size of the super–population, or population that would potentially use the study area in any given time period (Kendall et al., 1997), if unmarked animals including new recruits have the same probability of being available for capture as marked animals (Barker, 1997). When emigration is by definition permanent, then the CJS estimator for survival prob-ability estimates the product of true survival and fidelity to the study area. Kendall et al. (1997) evalu-ated the bias in CJS estimators for the case of Markovian movement to and from the unobservable state for two scenarios ( iAU <
i UU and
i AU >
i UU ).
CJS estimators were (1) negatively biased in each case for piA, and (2) negatively and positively biased,
respectively, for Si A.
The first step to properly account for an unobservable state is to include it in the model. The use of MSMR models in this regard, as in figure 1, is a logical approach, both conceptually and in terms of computing tools (Lebreton et al., 1999; Pradel & Lebreton, 1999; Kendall & Nichols, 2002; Schaub et al., 2004; Choquet et al., 2004). As one might expect, however, the unobservable state causes parameter redundancy problems in estimation. With no additional information it is possible to estimate parameters when (1) some are set equal across time and (2) either there is partial determinism in state transitions (e.g., breed-ers become obligate non–breedbreed-ers for one or two years, Fujiwara & Caswell, 2002a; Kendall & Nichols, 2002) or parameters are set equal across groups (e.g., sex, Schaub et al., 2004).
(Lebreton et al., 1999; Pradel & Lebreton, 1999; Kendall & Nichols, 2002) has an ecologically inter-esting interpretation. For example, in some studies conducted on breeding colonies only breeders are available to capture or sight. By definition an unobservable state implies the detection probability for that state is zero, at least by capture or sighting during the sampling interval. I will briefly discuss the bias induced for demographic parameters asso-ciated with the observable state when this unobservable state is ignored. I will then discuss what can be done to minimize this bias, through study design or modeling.
Single observable state, single unobservable state Most of the work to date in dealing with unable states is for the case where there is one observ-able and one unobservobserv-able state (i.e., where there is a single site, single state study). This scenario is well represented in figure 1 by assuming that state A represents the study area and state U is the unobservable state. Because the unobservable state for marked animals is caused by movement out of the study area, the term "temporary emigration" has often been used to describe this scenario (e.g., Burnham, 1993; Kendall et al., 1997; Schwarz & Stobo, 1997; Barker, 1997; Fujiwara & Caswell, 2002a; Schaub et al., 2004). Alternatively, move-ment out of the study area after capture has some-times been characterized as permanent by defini-tion, such as with natal dispersal.
Burnham (1993) pointed out that when movement in and out of the observable state is completely random (i.e., each individual in the population is equally likely to be available for detection in a given sampling period), the CJS estimator for capture
Fig. 1. Diagram of movements of animals between study areas A and U (e.g., breeding colonies, subpopulations), with associated probabilities of survival (Sr
i) for area r and movement from area r to
area s ( irs) for time period i.
Fig. 1. Diagrama de movimientos de animales entre las áreas de estudio A y U (es decir, colonias de reproducción, subpoblaciones), con probabilidades de supervivencia asociadas (Sr
i) para el área r y de movimiento desde el área r hasta el área s ( irs) para el periodo de tiempo i.
A U
Si A
i
AA S
i U
i UU
SiA i
AU
Si U
Pradel & Lebreton (1999) also used partial deter-minism when they put the model of Clobert et al. (1994) into a MSMR context. In this case hatching– year birds are released and become unobservable until they return to breed. Transition from pre– breeder to breeder was modeled as age–depend-ent, and there was an assumed age at which all birds that had not yet bred would breed with prob-ability 1.0. Once a bird bred, it was assumed to breed each year thereafter.
To be forced to assume a priori that parameters are equal over time or group is unsatisfactory. In fact, testing that hypothesis might be of interest. Of course the most direct way to relax this assumption is to expand the mark–recapture study to eliminate the unobservable state altogether. However, this is often not practical. I will discuss two other basic ways to account for the unobservable state with less restrictive assumptions.
The first involves some kind of sampling in the unobservable state. The best solution here is to use telemetry on a subset of the animals released, and track the animal where it is observable and where it is unobservable by other means such as capture or direct observation.
If detection probability is 1.0 for those animals with a telemetry device, movement probabilities in and out of the study area can be monitored directly. Powell et al. (2000) used this approach in a study of Wood Thrush (Hylocichla mustelina), maintaining a search area for birds with radios that encom-passed the capture study area. In addition, if mortalities can be partitioned from censoring (e.g., if a radio stops moving is it because the animal died or because the radio fell off?), information on survival for the unobservable state can be directly obtained. However, even if mortalities cannot be detected or detection probability for birds with ra-dios is < 1.0, movement probabilities can be esti-mated by conditioning on first and last detection of the bird and modelling its detection history in be-tween.
Another potential source of information for birds and fish, especially when movement out of the study area is permanent by definition, is ring recoveries. Burnham (1993) demonstrated that, assuming there is no unobservable state with respect to recoveries (i.e., no matter where the bird dies it can be found and reported), recoveries provide information on survival, whereas recaptures provide information on apparent survival, the product of survival and fidelity probabilities. Therefore, if and , where A is the observable state, and and are estimates for survival probability computed from ring recovery or recapture data, respectively, then a reasonable estimator for fidelity becomes
A key assumption is that survival probability is independent of state (SiU = S
i A = S
i). This potentially
restrictive assumption will come up again. Barker
(1997) demonstrated that the same approach can be applied when there are incidental observations of marked animals wherever they occur. In this case these observations can be viewed as a recov-ery where the bird is released again. He also showed that these observations can be used to estimate Markovian movement in and out of the study area, but this requires setting parameters equal across time.
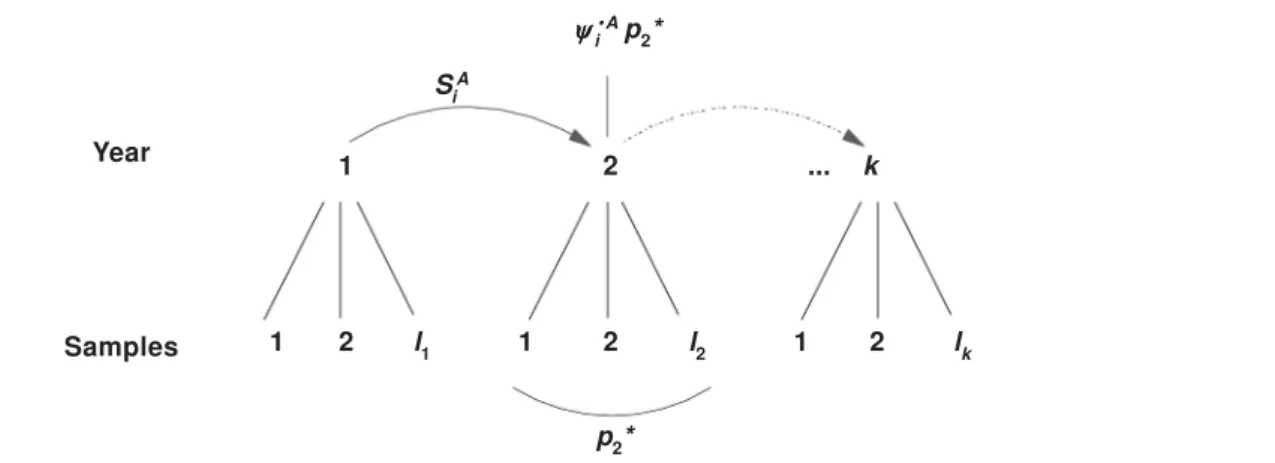
Another source of information for estimating parameters in the face of an unobservable state is subsampling. Each period of interest would con-sist of at least two formal capture occasions (fig. 2), where each animal present in the study area at each occasion is exposed to capture effort. This robust design was first suggested by Pollock (1982). At that time unobservable states had not been considered. Pollock proposed that sub–sam-ples within each primary period i should be suffi-ciently close in time that population closure could be assumed within primary period. In that way the full array of closed population capture–recapture models (see Otis et al., 1978) could be employed to estimate population size robustly, while the CJS model could be used to estimate apparent survival probability. Kendall et al. (1997) demonstrated that under a model of completely random move-ment in and out of the observable state A (i.e.,
i UA =
i AA =
i
.A), the CJS estimator for detection
probability pi* (the probability an animal is cap-tured in at least one subsample within primary period i) actually estimates the product i.A p
i*
(Burnham, 1993). However, closed model analysis yields an unbiased estimate of
where pij = probability of detection in sample j of primary period i, given it is present. From this development algebra yields an ad hoc estimator for transition probability:
This idea is illustrated in figure 2. When transi-tions are Markovian an ad hoc approach is not possible, but Kendall et al. (1997) developed likeli-hood approaches to both models and J. Hines programmed them in RDSURVIV (Kendall & Hines, 1999). Program MARK includes a conditional and unconditional (population size is estimated directly) version of this model. Under this model, all param-eters are estimable except iAA and
i
UA for the last
time interval of the study.
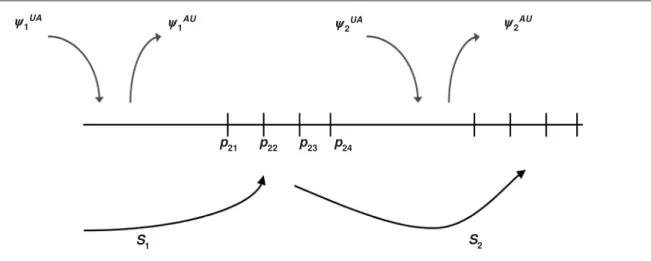
There are two other variations on the robust design, which can be compared against the closed robust design of Pollock (1982) by referring to fig-ures 3, 4, and 5. For the closed robust design (fig. 3) complete demographic and geographic closure with respect to the study area are assumed across sam-pling occasions within each primary period (although Kendall, 1999 identified some exceptions). Figure 4 represents the open robust design (Schwarz & Stobo, 1997; Kendall & Bjorkland, 2001). This design was motivated by breeding seals or sea turtles, where breeders arrive at (before sample j + 1 within primary period i with probability ij) and depart from (after sample j with probability ij) breeding beaches in a staggered fashion. An analogous application for birds would be a staging or stopover area. The statistical model used by Schwarz & Stobo (1997) and Kendall & Bjorkland (2001) within each primary period is the Schwarz & Arnason (1996) parameterization of the Jolly–Seber model. The principal modification is in the interpretation of the recruitment and survival parameters. In this case they represent arrival and departure probabilities. Therefore under this model geographic closure within each primary period is partially relaxed (only one entry and exit is permit-ted), but demographic closure is maintained. Schwarz & Stobo (1997) wrote computer code for their ver-sion of the robust design, and Kendall & Bjorkland (2001) modified RDSURVIV to create ORDSURVIV
(www.mbr-pwrc.usgs.gov/software). Program Mark
can now also run this model.
Figure 5 represents a "gateway" robust design, developed by Bailey et al. (2004). Here animals are
captured as they enter a breeding area, indicating they have decided to breed. They are captured again as they leave the study area at the conclu-sion of their breeding season. The authors applied it to pond–breeding amphibians, where a drift net surrounds the pond and individuals are caught on either side of the fence, and released on the oppo-site side. One can envision at least one other application: spawning fish who enter a river system and pass through one or more dams.
With this design, mortality is permitted to occur between entry and exit, but only one entry and exit is permitted per primary period. As with the other approaches to the robust design, survival probabil-ity for those in the unobservable state must be set equal to its counterpart for the observable state. However, the gateway robust design provides some flexibility, because seasonal survival probabilities are estimated (i.e., SA
i1 for the time spent in the study area and SA
i2 for the rest of the year). For the tiger salamander (Ambystoma tigrinum tigrinum) data set analyzed by Bailey et al. (2004), this was an advantage. When this animal is not breeding it is in terrestrial habitat surrounding the pond. There-fore SA
i2, which is estimable, refers to survival of breeders from the time they leave the pond to the time of entry the next year, during which they are in terrestrial habitat. Therefore it makes sense to con-strain both SU
i1 and S U
i2 equal to SAi2, although to do so for the former requires an adjustment for differences in time scale.
No fully efficient computer software has yet been written for this model. To be fully efficient, when an Fig. 2. Diagram of Pollock’s robust design, where each of k primary occasions consists of li closely spaced capture occasions. As indicated, information on detection probability (pi*) is derived from capture occasions within a primary period, and survival (SiA) and the product of capture and transition
probability ( i·A) is derived across primary periods.
Fig. 2. Diagrama del diseño robusto de Pollock, donde cada una de las principales ocasiones k consiste en ocasiones de captura li próximas. Tal y como se indica, la información relativa a la probabilidad de detección (pi*) se deriva de ocasiones de captura dentro de un periodo principal, mientras que la probabilidad de supervivencia (SiA) y la del producto de la captura y transición (
i
···A) se deriva a partir de
varios periodos principales.
i ···A p
2*
SiA
1 2 ... k
1 2 l1 1 2 l2 1 2 lk
p2*
Year
animal is first captured as it exits the study area, the fact that it entered the study area but was not captured should be modeled. However, Bailey et al. (2004) conditioned on first capture and used pro-gram MSSURVIV. Propro-gram MARK or M–SURGE could also have been used.
The three versions of the robust design pre-sented in figures 3, 4, and 5 are fairly different in the way they model probability structure within each primary period. They vary from an assump-tion of complete geographic and demographic clo-sure, to partial relaxation of geographic closure with respect to the study area, to partial relaxation of demographic closure. However, they share the assumption that state remains static within each primary period. As indicated in each figure, the decision about state transition is made between primary periods. Therefore in each of these de-signs an animal in the observable state in primary period i is exposed to capture effort at least twice within that primary period. It is this feature of the robust design that permits estimation of transition probabilities to and from the unobservable state. This is accomplished via estimation of the effec-tive or pooled capture probability for that primary period (pi*). This value is defined for the closed robust design above. For the open robust design
where i1 = i0, and i,j+1= ij (1 – pij) ij + ij. For the gateway robust design, pi* = pi1 + (1 – pi1) SA
i1 pi2. In conclusion, with some assumptions or addi-tional sources of information, such as the robust
design, demographic parameters can be estimated in the face of an unobservable state. The most biologically restrictive assumption required under most of these approaches is that survival prob-ability is equal for the observable and unobservable states. This might be unrealistic, and impedes the testing of some interesting hypotheses. For exam-ple, in studies of a single breeding population where non–breeders are unobservable, under the robust design a trade–off between current and future breeding could be evaluated, but a trade–off in terms of future survival probability could not. As noted above, the solution to this problem is sim-ple: sample animals in the unobservable state, either through reliable telemetry or through formal capture or resighting periods.
Multiple observable states, one or more unobservable states
In some cases, even where capture effort is applied to multiple states, there still could be one or more unobservable states. A question arises about how directly applicable are the single observable state results derived above to the case of multiple ob-servable states. The level of complexity grows with multiple states, making it difficult to predict estimability or to develop a comprehensive guide-line such as Kendall & Nichols (2002) and Schaub et al. (2004). As with the case of a single observ-able state, the solution to parameter redundancy problems will be telemetry, the robust design, uni-versal recoveries/resightings, and partial determin-ism in transitions.
Fig. 3. Sampling process for the closed robust design. Mortality (1 – Sir) and transitions ( i
rs) occur
between primary periods, whereas geographic and demographic closure are assumed within the set of capture occasions in each primary period.
Fig. 3. Proceso de muestreo correspondiente al diseño robusto cerrado. La mortalidad (1 – Sir) y las transiciones ( irs) se dan entre periodos principales, mientras que la acotación geográfica y demográ-fica se presuponen en el conjunto de ocasiones de captura en cada periodo principal.
1
UA
1
AU
p21 p22 p23 p24
2
AU
2
UA
Fig. 4. Sampling process for the open robust design. Mortality (1 – Si
r) and transitions ( i
rs) occur
between primary periods. Demographic closure is assumed within the set of capture occasions in each primary period, but one entry to ( ij) and one exit from ( ij) the study area is permitted per primary period.
Fig. 4. Proceso de muestreo correspondiente al diseño robusto abierto. La mortalidad (1 – Sir) y las transiciones ( irs) se dan entre periodos principales. La acotación demográfica se presupone en el conjunto de ocasiones de captura en cada periodo principal, pero para cada periodo principal se permite una entrada en ( ij) y una salida de ( ij) del área de estudio.
Fig. 5. Sampling process for the gateway robust design. Transitions ( irs) occur between primary
periods. Geographic closure is assumed within the two capture occasions in each primary period, but mortality is permitted within (1 – Sr
i1) or between (1 – S
r
i2) primary periods.
Fig. 5. Proceso de muestreo para el diseño robusto gateway. Las transiciones ( irs) se dan entre periodos principales. La acotación geográfica se presupone en las dos ocasiones de captura en cada uno de los periodos principales, pero se permite la mortalidad en (1 – Sr
i1) o entre (1 – S r
i2) periodos principales.
1
UO
1
OU
p21 p22 p23 p24
2
OU
2
UO
S1 S2
1
UO
1
OU
p21 p22
2
OU
2
UO
S12 S21
S22
There are several examples of work underway involving > 2 states. Kery & Gregg (in review) con-sider the case of an orchid with two above–ground life stages and a below–ground (unobservable) dor-mant stage, where detection probability is 1.0 for the above–ground states. Forcada et al. (in review) consider a special case of partial determinism for a breeding population of albatross. Breeders are par-titioned into successful and unsuccessful states, and successful breeders are assumed to skip at least one year of breeding with certainty. Kendall et al. (in review) and Barker et al. (in review) consider multiple observable capture states combined with ring recoveries, with permanent or temporary move-ment to an unobservable capture state.
Lebreton et al. (2003) presented a special case of partial determinism that extends Clobert et al. (1994) and Pradel & Lebreton (1999) to multiple observable states. Here a hatching year bird is released in one of three colonies, makes a decision about at which of the three it will eventually breed, and remains in the unobservable pre–breeder state for that colony with some probability. There is no robust design, but there is an age at which breeding probability matches that of the observable adults, and accession to breeding is modelled as age–dependent, whereas survival and detection probability are modeled as time–dependent.
M is–cla ssifie d a nd unk now n st a t e s
When the state of an animal that is captured is mis–classified or unknown the potential for bias in transition probabilities as well as all other parameters arises. Differences in survival be-tween states could be underestimated. As with other biases, those due to mis–classification could certainly bias projections of population change from matrix population models (Caswell, 2001). Lebreton & Pradel (2002) outlined the problem of mis–classified states, and pointed out that with-out additional information parameter redundancy problems would arise. Fujiwara & Caswell (2002b) modeled mis–classification and adjusted for it by incorporating fixed mis–classification probabili-ties derived outside the capture–mark–recapture modeling process.
Kendall et al. (2003) and Kendall et al. (2004) considered a two–state case where mis–classifi-cation can only occur in one direction. The prob-lem was motivated by a study of adult female Florida manatees (Trichechus manatus latirostris) and their calves. A female is determined to have bred by the presence of an attendant young calf. In some cases a calf that is present is not seen by the photographer that documents the cow by scar pattern. By being conservative about assigning a calf to a female, breeders can be mis–classified as non–breeders but not vice versa. The probabil-ity structure for this model can be illustrated with the example capture histories below, where C indicates with calf (breeder) and N indicates with-out calf (non–breeder):
CC CN NC where piC , p
i
C(1 – ) = probability a breeder is de-tected in sampling period i and her calf is or is not detected, respectively, piN = probability a non–
breeder is detected in period i, and i = probability a cow seen without a calf in period i is indeed a non–breeder.
To adjust for mis–classification, Kendall et al. (2003) partitioned the season into two sampling occasions, producing a robust design. Because there were two opportunities to sight each female and determine if she had a calf, the detection probability for a cow (pijC or p
ij
N) and any calf
conditional on detecting its mother ( ijC) could be
estimated. The detection parameters for each pri-mary period (piC , p
i
C(1 – ), and p
i
N)are then
func-tions of these parameters at the sub sample scale. Whereas Kendall et al. (2003) relied on a subset of known non–breeders to estimate parameters, Kendall et al. (2004) did not require this. I present example sighting histories and their probabilities for primary period 2 below:
NN
CC
where and
In this case i = probability that an adult female in the population and available for detection in year i is a breeder.
There is an interesting additional benefit of the structure described above, unrelated to mis–classi-fication. Assuming breeders and non–breeders to be equally likely to be in the study area, i is interpreted as the proportion of females that breed in a given year. This implies that the conditional and unconditional probabilities of breeding are in the same model. More generally, survival or transi-tion probabilities for a given state could be mod-elled as a function of the proportion of the popula-tion currently in that state. This would permit inves-tigators to consider hypotheses about frequency– dependent dynamics while properly accounting for sampling variance and covariance.
Mis–classification certainly arises in disease stud-ies, and in this case misclassification can occur in either direction. Some sick animals do not show clinical signs, and some animals that have recov-ered have residual clinical symptoms. The MSMR probability structure that accounts for mis–classifi-cation is straightforward to write, but the misclassification probabilities must be derived from another source of data.
Nichols et al. (2004) considered the case where a static state is not mis–classified, but is unknown for a given period of time. The motivating problem was that of sexually monomorphic birds, where sex is indeter-minate until they display sex–specific behavior. They showed that naively back–dating sex assignment to the original capture occasion produces positively bi-ased estimates of survival probability for both sexes (because the longer they live the greater the chance their sex will be assigned). Instead they modeled the animals that were never assigned to sex as a mixture of males and females, and also modelled the prob-ability of being assigned to sex at each detection occasion. It is a similar approach to the manatee case of a dynamic state above, with an important distinc-tion. Whereas the robust design was necessary above in order to estimate the probability of assigning state correctly, Nichols et al. (2004) used cross–period information for the same purpose because sex is a static state. Pradel et al. (in press) explored estimability issues where sex is assigned each time but never known with certainty.
Disc ussion
I have reviewed various examples of unobservable and mis–classified states, and shown how the MSMR modelling framework, combined with partial deter-minism or additional sources of data can be used to estimate demographic parameters in the face of these phenomena. These models have performed well in many examples. Although MSMR models require more parameters, the need for this addi-tional structure could outweigh that disadvantage. For a data set of limited size, putting the problem in a MSMR context permits one to use model selec-tion to see where constraints should be imposed. For example, parsimony might dictate that it is better to give up time dependency in survival prob-ability than to ignore the transitions to the unobservable state.
Nevertheless there is a cost to having unobservable or mis–classified states. For the former, one is re-quired to assume a priori that the survival probability for the unobservable state is equal to that for an observable state. The validity of this assumption, and therefore the ability to test it, is of great interest biologically. Mis–classification, even if adjusted for properly, causes reduction in precision. Therefore, as much as possible, design should be used to reduce problems. Unobservable states should be made ob-servable as much as possible. For example, the use of telemetry to supplement capture or resighting
stud-ies where possible. Researchers should look for op-portunities to include multiple sampling occasions per period of interest, so that robust design methods can be utilized. Behavioral cues should be collected each time an animal is detected, to be able to estimate the probability of mis–classification.
A buffer zone around a study area can be useful in minimizing temporary emigration, or to avoid confusing nuisance movements with meaningful ones. For example, in a study of breeding colonies where study plots are inserted in larger groups (e.g., albatross), breeders on the edge of the plot might breed the next year outside the plot. By conventional design these birds become un-observable, as are those that do not breed and are therefore not on any nest. Estimates of transitions to the unobservable state would include both types of movement and therefore bias tests of hypoth-eses about breeding probability. By creating a buffer zone around the plot where marked birds are searched for, this nuisance movement can be reduced or eliminated.
Much work has been done on unobservable and mis–classified states. Nevertheless there is plenty of opportunity for future work. The issue of multiple observable and unobservable states has barely been considered. Given the potential complexity of multi state models, the computer algebra methods of Catchpole et al. (2002), Gimenez et al. (2003), and Gimenez et al. (2004) will be especially useful in evaluating parameter redundancy. I suggest that these methods be used to determine which param-eters are estimable in theory, then simulate data or use expected value methods for reasonable param-eter values and sample sizes to dparam-etermine if these parameters are estimable in practicality.
Goodness of fit issues also deserve attention in the case of unobservable states. A generic Pearson test is conducted by programs MSSURVIV, RDSURVIV, and ORDSURVIV, but no test is avail-able in MARK. Pradel et al. (2003) has provided a more detailed test for fit of multi state models, which has been implemented in program U–CARE. How-ever, this test does not permit the empty cells inher-ent with an unobservable state, although this could be partially remedied (R. Pradel, pers. comm.).
Other future work that is needed is the capacity to combine an arbitrary number of sources of informa-tion (Barker & White, 2004). Mis–classificainforma-tion cor-rection could be incorporated into models that in-volve more than two states, whether or not those additional states involve mis–classification directly. In addition, more work needs to be done on bi– directional mis–classification. Finally, none of what I have reviewed here has involved hierarchical mod-els. This option should be explored.
Ac k now le dgm e nt s
manuscript. The juxtaposition of topics presented here was partly inspired by stimulating discussions with Jim Nichols, Larissa Bailey, and Evan Cooch.
Re fe r e nc e s
Arnason, A. N., 1972. Parameter estimates from mark–recapture experiments on two populations subject to migration and death. Researches on Population Ecology, 13: 97–113.
– 1973. The estimation of population size, migra-tion rates, and survival in a stratified populamigra-tion. Researches in Population Ecology, 15: 1–8. Bailey, L. L., Kendall, W. L., Church, D. R. & Wilbur,
H. M., 2004. Estimating survival and breeding probability for pond–breeding amphibians: a modi-fied robust design. Ecology, 85: 2456–2466. Barker, R. J., 1997. Joint modelling of
live–recap-ture, tag–resight, and tag–recovery data. Bio-metrics, 53: 666–677.
Barker, R. J. & White, G. C., 2004. Towards the mother of all models: customized construction of the mark–recapture likelihood function. Animal Biodiversity and Conservation, 27.1: 177–185. Barker, R. J., White, G. C. & McDougal, M., in
review. Movement of paradise shelducks between molt sites. Journal of Wildlife Management. Brownie, C., Hines, J. E., Nichols, J. D., Pollock, K.
H. & Hestbeck, J. B., 1993. Capture–recapture studies for multiple strata including non–Markovian transitions. Biometrics, 49: 1173–1187.
Burnham, K. P., 1993. A theory for combined analy-sis of ring recovery and recapture data. In: Marked individuals in the study of bird population: 199– 214 (J.–D. Lebreton & P. M. North, Eds.) Birkhäuser–Verlag, Basel, Switzerland.
Cam, E., Cadiou, B., Hines, J. E. & Monnat, J. Y., 2002. Influence of behavioural tactics on recruit-ment and reproductive trajectory in the kittiwake. In: Statistical Analysis of Data from Marked Bird Populations: 163–186 (B. J. T. Morgan & D. L. Thomson, Eds.). Journal of Applied Statistics 29, nos 1–4.
Caswell, H., 2001. Matrix population models, 2 nd
edition. Sinauer, Sunderland, MA, U.S.A. Catchpole, E. A., Morgan, B. J. T. & Viallefont, A.,
2002. Solving problems in parameter redundancy using computer algebra. In: Statistical Analysis of Data from Marked Bird Populations: 625–636 (B. J. T. Morgan & D. L. Thomson, Eds.). Journal of Applied Statistics, 29, nos 1–4.
Choquet, R., Reboulet, A.–M., Pradel, R., Gimenez, O. & Lebreton, J.–D., 2004. M–SURGE: an integrated software for multi state recapture models. Animal Biodiversity and Conservation, 27.1: 207–215.
Clobert, J., Lebreton, J.–D., Allaine, D. & Gaillard, J. M., 1994. The estimation of age–specific breed-ing probabilities from recaptures or resightbreed-ings in vertebrate populations: II. Longitudinal mod-els. Biometrics, 50: 375–387.
Darroch, J. N., 1961. The two–sample capture–
recapture census when tagging and sampling are stratified. Biometrika, 48: 241–260.
Fujiwara, M., & Caswell, H., 2002a. Temporary emigration in mark–recapture analysis. Ecology, 83: 3266–3275.
– 2002b. Estimating population projection matri-ces from multi–stage mark–recapture data. Ecol-ogy, 83: 3257–3265.
Gimenez, O., Choquet, R. & Lebreton, J.–D., 2003. Parameter redundancy in multistate capture–recap-ture models. Biometrical Journal, 45: 704–722. Gimenez, O., Viallefont, A., Catchpole, E. A.,
Choquet, R. & Morgan, B. J. T., 2004. Methods for investigating parameter redundancy. Animal Biodiversity and Conservation, 27.1: 561–572. Hestbeck, J. B., Nichols, J. D. & Malecki, R. A.,
1991. Estimates of movement and site fidelity using mark–resight data of wintering Canada Geese. Ecology, 72: 523–533.
Hines, J. E., 1994. MSSURVIV User’s Manual. USGS Patuxent Wildlife Research Center, Lau-rel, MD 20708–4017.
Kendall, W. L., 1999. Robustness of closed cap-ture–recapture methods to violations of the clo-sure assumption. Ecology, 80: 2517–2525. Kendall, W. L. & Bjorkland, R., 2001. Using open
robust design models to estimate temporary emi-gration from capture–recapture data. Biometrics, 57: 1113–1122.
Kendall, W. L. & Hines, J. E., 1999. Program RDSURVIV: an estimation tool for capture–re-capture data collected under Pollock’s robust design. Bird Study, 46 (supplement): S32–S38. Kendall, W. L., Hines, J. E. & Nichols, J. D., 2003.
Adjusting multi–state capture–recapture models for misclassification bias: manatee breeding pro-portions. Ecology, 84:1058–1066.
Kendall, W. L., Langtimm, C. A., Beck, C. A. & Runge, M. C., 2004. Capture–recapture analysis for estimating manatee reproductive rates. Ma-rine Mammal Science, 20: 424–437.
Kendall, W. L. & Nichols, J. D., 2002. Estimating state–transition probabilities for unobservable states using capture–recapture/resighting data. Ecology, 83: 3276–3284.
Kendall, W. L., Nichols, J. D. & Hines, J. E., 1997. Estimating temporary emigration using capture– recapture data with Pollock’s robust design. Ecol-ogy, 78: 563–578.
Kery, M. & Gregg, K. B., 2004. Demographic esti-mation methods for plants in the presence of dormancy. Oikos, in review.
Lebreton, J.–D., Almeras, T. & Pradel, R., 1999. Competing events, mixtures of information and multi stratum recapture models. Bird Study, 46 (supplement): S39–S46.
Lebreton, J.–D., Burnham, K. P., Clobert, J. & Anderson, D. R., 1992. Modeling survival and testing biological hypotheses using marked ani-mals: a unified approach with case studies. Eco-logical Monographs, 62: 67–118.
simultane-ous estimation by capture–recapture of acces-sion to reproduction and dispersal–fidelity in a multi–site system. Oikos, 101: 253–264. Lebreton, J–D. & Pradel, R., 2002. Multi state
recapture models: modelling incomplete individual histories. In: Statistical Analysis of Data from Marked Bird Populations: 353–370 (B. J. T. Morgan & D. L. Thomson, Eds.). Journal of Applied Statistics 29, nos 1–4.
Lindberg, M. S., Kendall, W. L., Hines, J. E. & Anderson, M. G., 2001. Combining band recov-ery data and Pollock’s robust design to model temporary and permanent emigration. Biomet-rics, 57: 273–282.
Nichols, J. D., Brownie, C., Hines, J. E., Pollock, K. H. & Hestbeck, J. B., 1993. The estimation of exchanges among populations or subpopulations. In: Marked individuals in the study of bird popu-lation: 265–280 (J.–D. Lebreton & P. M. North, Eds.). Birkhäuser–Verlag, Basel, Switzerland. Nichols, J. D., Hines, J. E., Pollock, K. H., Hinz, R.
L. & Link, W. A., 1994. Estimating breeding proportions and testing hypotheses about costs of reproduction with capture–recapture data. Ecol-ogy, 75: 2052–2065.
Nichols, J. D. & Kaiser, A., 1999. Quantitative studies of bird movement: a methodological re-view. Bird Study, 46 (supplement): S289–S298. Nichols, J. D., & Kendall, W. L., 1995. The use of multi–state capture–recapture models to address questions in evolutionary ecology. Journal of Applied Statistics, 22: 835–846.
Nichols, J. D., Kendall, W. L., Hines, J. E. & Spendelow, J. A., 2004. Estimation of sex–specific survival from capture–recapture data when sex is not always known. Ecology, 85.
Nichols, J. D., Sauer, J. R., Pollock, K. H. & Hestbeck, J. B., 1992. Estimating transition prob-abilities for stage–based population projection matrices using capture–recapture data. Ecology, 73: 306–312.
Otis, D. L., Burnham, K. P., White, G. C. & Anderson, D. R., 1978. Statistical inference for capture data on closed animal populations. Wildlife Mono-graphs, No. 62.
Pollock, K. H., 1981. Capture–recapture models for age–dependent survival and capture rates. Bio-metrics, 37: 521–529.
– 1982. A capture–recapture design robust to un-equal probability of capture. Journal of Wildlife Management, 46: 757–760.
Powell, L. A., Conroy, M. J., Hines, J. E., Nichols, J. D. & Krementz, D. G., 2000. Simultaneous use of mark–recapture and radio telemetry to estimate survival, movement and capture rates. Journal of Wildlife Management, 64: 302–313.
Pradel, R., Gimenez, O. & Lebreton, J.–D. (in press). Principles and interest of GOF tests for multi–state models. Animal Biodiversity and Conservation.
Pradel, R. & Lebreton, J.–D., 1999. Comparison of different approaches to the study of local recruit-ment of breeders. Bird Study, 46 (supplerecruit-ment): S74–S81.
Pradel, R., Maurin–Bernier, O. & Gimenez, O. (in press). Determination of sex in Larus audouinii. A model incorporating a possibility of error. Pradel, R., Wintrebert, C. M. A. & Gimenez, O.,
2003. A proposal for a goodness–of–fit test to the Arnason–Schwarz multi–site capture–recap-ture model. Biometrics, 59: 36–42.
Schaub, M., Gimenez, O., Schmidt, B. R. & Pradel, R., 2004. Estimating survival and temporary emigration in the multistate capture–recapture framework. Ecology, 85.
Schwarz, C. J. & Arnason, A. N., 1996. A general methodology for the analysis of capture–recap-ture experiments in open populations. Biomet-rics, 52: 860–873.
Schwarz, C. J., Burnham, K. P. & Arnason, A. N., 1988. Post–release stratification in band–recov-ery models. Biometrics, 44: 765–785.
Schwarz, C. J., Schweigert, J. F. & Arnason, A. N., 1993. Estimating migration rates using tag–re-covery data. Biometrics, 49: 177–193.
Schwarz, C. J. & Stobo, W. T., 1997. Estimating temporary migration using the robust design. Biometrics, 53: 178–194.
Viallefont, A., Cooch, E. G. & Cooke, F., 1995. Estimation of trade–offs with capture– recapture models: a case study on the lesser snow goose. Journal of Applied Statistics, 22: 847–862. White, G. C., 1983. Numerical estimation of survival
rates from band–recovery and biotelemetry data. Journal of Wildlife Management, 47: 716–728. White, G. C. & Burnham, K. P., 1999. Program
MARK for survival estimation. Bird Study, 46 (supplement): 120–139.