Vol.56, n.1: pp. 69-79, January-February 2013
ISSN 1516-8913 Printed in Brazil BRAZILIAN ARCHIVES OF
BIOLOGY AND TECHNOLOGY
A N I N T E R N A T I O N A L J O U R N A L
Demography and Structures Population of
Actinostemon
concolor
(Spreng.) Müll. Arg. (Euphorbiaceae) in Flooded
Areas in Southern Brazil
Edmilson Bianchini
1*, Carla Gomes de Araújo
2, Márcia Green
3and José Antonio Pimenta
1 1Departamento de Biologia Animal e Vegetal; Centro de Ciências Biológicas; Universidade Estadual de Londrina; Caixa Postal 6001, 86051-970 ; Londrina - PR - Brasil. 2Centro de Ciências Biológicas; Universidade Estadual do Norte do Paraná; Caixa-Postal 261, 86360-000; Bandeirantes - PR - Brasil. 3Universidade Federal do Amazonas; Av. General Rodrigo Octávio Jordão Ramos, 3000; 69077-000; Manaus - AM - Brasil
ABSTRACT
The aim of this work was to analyze the size and spatial structures and demography of Actinostemon concolor (Spreng.) Müll. Arg. (Euphorbiaceae) in the flooded areas of Mata dos Godoy State Park. Fifty plots of 100 m2 were established and three surveys were conducted. All the individuals were measured, mapped and divided into categories as seedlings, juveniles and adults. The coefficient of skewness, L-function of Ripley, and the matrix population models were used in the study. The population showed positive coefficient of skewness and the individuals were distributed in groups. The population growth rates (λ) were equal or lower than 1.0 and the adult survival and recruitment of juvenile to adult were the vital rates that most affected the values of λ. Considering these results and the unpredictability of the environment, it could be concluded that the individual numbers of A. concolor would fluctuate over time, but the species would remain as one of the most important in the Park.
Key words: elasticity, matrix models, spatial distribution, structure size, tropical tree
*Author for correspondence: [email protected]
INTRODUCTION
Due to agriculture expansion, the Seasonal Semideciduous Forest in the Southern and Southeast Brazil was deforested (Medri et al. 2002), resulting in a highly fragmented landscape. In this devastated scenario, the Riparian Forests were also degraded, although protected by law (Medri et al. 2002). These degradation processes were harmful to the riparian and water ecosystems. Currently, there are several projects aiming to recover the riparian degraded areas and ecosystem function. However, the riparian forest conservation depends on the knowledge about the tree
population dynamics and structures, as suggested by van Groenendael et al. (1996) for the tropical forest. These studies are considered essential to the understanding of the processes that regulate the dynamics and structure of natural communities and to the management and conservation programs (Santos et al. 1998). However, the life histories are unknown for the majority of tropical species (Wright et al. 2003).
1996; Svenning 2002), by topography (Bianchini et al. 2010), by predators or pathogens (Condit et al. 1996; Bastida and Talavera 2002), by seed dispersal process (Law and Dieckmann 2000; Bleher and Böhning-Gaese 2001) and other sources of environmental variation such as flooding(Appolinárioet al. 2005).
For Geonoma macrostachys Mart., an understory palm, Svenning (2002) detected greater recruitment and fecundity because of canopy openness that increased light availability in the understory. Fonseca et al. (2004) observed that the seedlings of Aspidosperma polyneuron Müll. Arg. tended to be concentrated in one region of the area and not distributed in scattered clumps, as reported in other two studied areas. These authors associated the results with slope and its related edaphic factors.
In this work, the population structures and demography of Actinostemon concolor (Spreng.) Müll. Arg. (Euphorbiaceae), a common understory tree of the Brazilian Seasonal Semideciduous Forest (Smith et al. 1988) and Riparian Forest was studied. This species is more abundant in flooded areas of Riparian Forest (Bianchini et al. 2003). The following aspects were looked into: the size distribution, the population size, the parameters (fecundity, survival or recruitment) that most affect the species demography, the spatial pattern of the population and the abiotic factors related to this spatial pattern.
MATERIAL AND METHODS
This study was carried out in the Mata dos Godoy State Park - MGSP (23º27'S, 51º15'W, visitors center), near Londrina town, Southern Brazil. The MGSP has 680 ha and is surrounded by agricultural fields, pasture and secondary forest (Vicente 2006). The South limit of this Park is the Apertados Stream that in the periods of high precipitation, floods several sites in the riparian forest (Bianchini et al. 2001). At these sites (hereafter referred as flooded areas), some species were very abundant, such as A. concolor (Bianchini et al. 2003). The flooded areas in the MGSP were restricted and discontinuous. These areas showed small microtopographic variations and the vegetation cover was heterogeneous (Bianchini et al. 2001) due to the occurrence of small gaps.
The climate is Cfa according to Köppen’s classification system (Bianchini et al. 2003), with a yearly rainfall of about 1600 mm. The rainfall during the summer is three times higher than in the winter. The average annual temperature is around 21oC, and January (23.9°C) and June (16.3°C) are the hottest and the coldest month, respectively. The climate data for the period 1976-2004 were obtained from the Instituto Agronômico do Paraná. Actinostemon concolor is a small evergreen tree, reaching 10 m in height and 10 cm in diameter at breast height (dbh) (Smith et al., 1988). It is a shade tolerant species and occurs specially in humid soils (Bianchini et al. 2003). In the Riparian Forest of Paraná State, Southern Brazil, A. concolor is among the principal species (Soares-Silva et al. 1992; Dias et al. 1998; Soares-(Soares-Silva et al. 1998; Bianchini et al. 2003) and it can be among the species with great value of importance (IV) in the flooded areas (Silva et al. 1992; Nakagima et al. 1996; Bianchini et al. 2003). Flowering and fruiting occurs from August to September and August to November, respectively (Alberti and Morellato 2008). The fruits are capsules dehiscent and autochoric (Smith et al. 1988; Morellato and Leitão-Filho 1992).
Fifty 10 m x 10 m plots (5000 m2) were established in the flooded sites of the Park. As flooded areas were discontinuous, these plots were divided into three groups (A, B, C), distant at least 20 m from each other. In May 2000, all A. concolor individuals were tagged, mapped to the nearest meter and their height and stem base diameter were measured. The population was grouped into three size categories: seedling – presence of cotyledon; juvenile – without cotyledon and height ≤ 1.50 m; adults – height > 1.5 m. The plots were monitored in January 2003 and January 2004. When individual height was reduced to less than 1.5 m because of break, it was considered that the individual returned from adult to juvenile.
t + 1. In this equation, the population structure at time t + 1 is obtained by multiplying the structure at time t with the transition matrix, which contains information on the demography of the population, assuming environmental factors to be constant in time. Repeated multiplication of the transition matrix with the current population produces the dominant latent root or dominant eigenvalue of the transition matrix (λ), which is equal to the intrinsic population growth rate and the stable stage population structure (the right eigenvector w) (Caswell 2000).
The elements of transition matrix (recruitment, survival and fecundity) were calculated directly from the counts of individuals that grew to the next category or stayed in the same category involved in each transition. Fecundity was expressed as the average number of seedlings produced in the study period per adult in the plots (Alvarez-Buylla 1994).
The intrinsic population growth rate (λ) and stable stage distribution were calculated using the RAMAS Stage Software (Ferson 1990). The confidence interval for λ was calculated using the bootstraps techniques following Caswell (2000). The sensitivity and elasticity analyses were carried out to determine the sensitivity of λ to the changes in different elements of the transition matrix. Sensitivity analysis examines the effect on λ of small changes of fixed size in the demographic parameters (Caswell 1978) while the elasticity analysis shows the proportional contribution of each matrix element to the λ (De Kroon et al. 1986).
Maps were used to analyze the spatial distribution. They were made using the individuals’ Cartesian coordinates sampled in 2004. We used Ripley's L-function, which was based on the variance (second-order analysis) of all point-to-point (plant-to-plant) distances in a two-dimensional space (Ripley 1977) to confirm the spatial distribution patterns of species. When L value is zero, the points are randomly distributed; values less than zero indicate clumping while values greater than zero indicate regular spacing (Dale 1999). All the calculations (L-function, randomization, and edge effect) were performed in the Passage software (Rosenberg 2001).
To evaluate that environmental characteristic could explain the spatial distribution of the individuals, the canopy cover, litter and herbaceous covers in the soil and the plots height in relation to the level of the river in normal
conditions (avoiding the dry and the rainy period) were mensured. The canopy cover was assessed with a spherical densiometer (Lemmon 1956). In January 2003, four readings of canopy cover were made in the centre of each of the 10 m x 10 m plots and the average of the four readings was used as a measure of canopy cover in each plot (Bianchini et al. 2001). The plots were grouped into four categories of canopy cover: >90%, >85-90%, >80-85%, <80%. The litter and herbaceous covers were visually estimated in four categories: low, medium, high and very high. The plot height was determined in the centre of each plot using a transparent water hose and a ruler. The plots were grouped into five height categories: very low, low, medium, high and very high.
The correspondence analysis (CA) was applied to group the plots according to its environmental characteristics. The CA is a technique of multivariate analysis indicated for cases in which data are grouped in categories (Guedes et al. 1999). The CA allows getting a graphical representation through the distribution of the categories score of lines and/or columns in a system of coordinates. The eigenvalues are extracted from the tables of contingencies in which the original values are transformed in order to be interpreted as conditional probabilities. Because of the nature of this transformation, the relations between columns and lines of the transformed table are the same that those of the original matrix of data (Guedes et al. 1999). The CA was performed with PCord (McCune and Mefford 1999), and Statistica 6.0 (StatSoft 2004), softwares.
The CA groups the plots in a bidimensional graphical space, defined for the two most important eigenvectors in accordance with its environmental characteristics. In the figure produced by CA, the 15 plots with the highest (more than 50 individuals) and lowest (0 - 7 individuals) densities were highlighted.
RESULTS
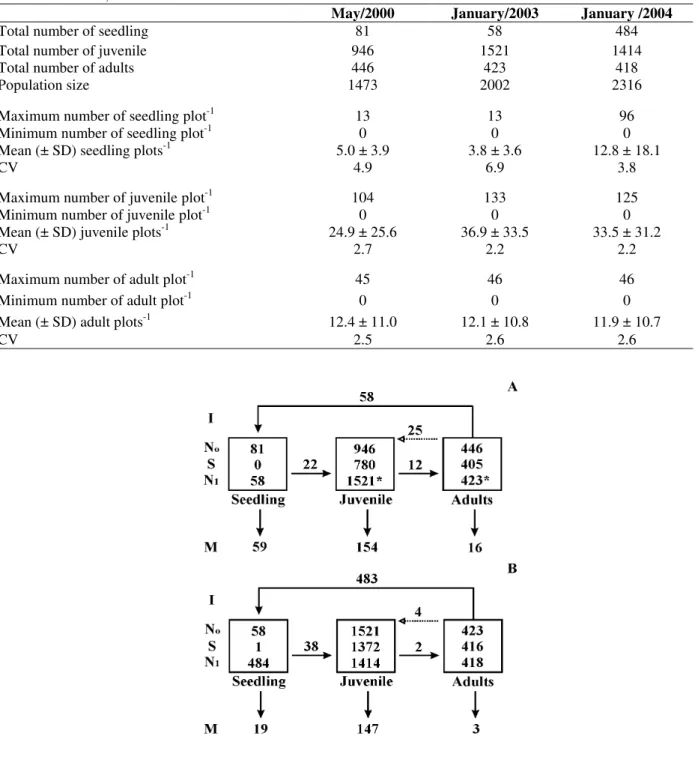
The highest standard deviations were detected for the juvenile (Table 1). The population size varied
with time and this numerical fluctuation must be mainly due to seedling and juvenile (Fig. 1).
Table 1 - Number of Actinostemon concolor individuals sampled in a flooded area (0.5 ha), Southern Brazil. SD - Standard deviation; CV – coefficient of variation.
May/2000 January/2003 January /2004
Total number of seedling 81 58 484
Total number of juvenile 946 1521 1414
Total number of adults 446 423 418
Population size 1473 2002 2316
Maximum number of seedling plot-1 13 13 96
Minimum number of seedling plot-1 0 0 0
Mean (± SD) seedling plots-1 5.0 ± 3.9 3.8 ± 3.6 12.8 ± 18.1
CV 4.9 6.9 3.8
Maximum number of juvenile plot-1 104 133 125
Minimum number of juvenile plot-1 0 0 0
Mean (± SD) juvenile plots-1 24.9 ± 25.6 36.9 ± 33.5 33.5 ± 31.2
CV 2.7 2.2 2.2
Maximum number of adult plot-1 45 46 46
Minimum number of adult plot-1 0 0 0
Mean (± SD) adult plots-1 12.4 ± 11.0 12.1 ± 10.8 11.9 ± 10.7
CV 2.5 2.6 2.6
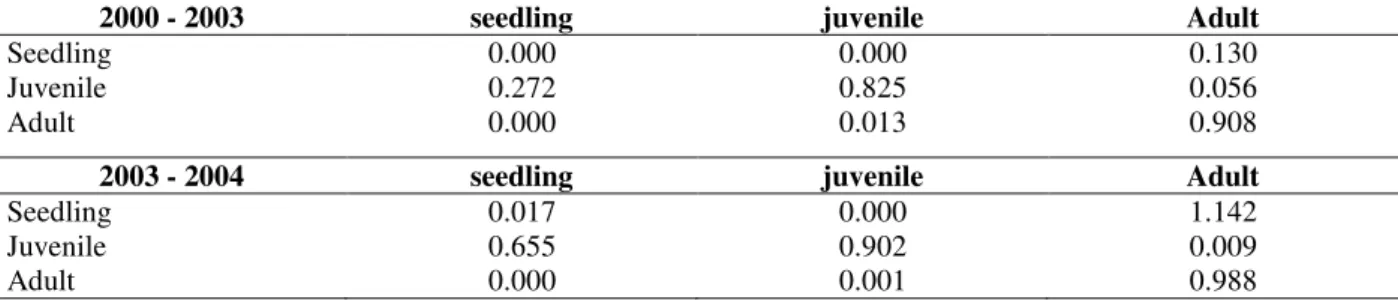
Figure 1 - Life table diagram for Actinostemon concolor population in a flooded area (0.5 ha), Southern Brazil. Data from two period of study: 2000-2003 (A) and 2003-2004 (B). I – number of new seedling recorded in the period; N0 – number of individuals in the first
survey; N1 – number of individuals in the second survey; S – number of survivors that
A. concolor population showed a predominance of small individuals. The skewness coefficient (g1)
for the height and diameter were g1 = 2.3 and g1 =
3.2, respectively, confirming the distribution with a long tail to the right. The individuals grew slowly. The height and diameter mean growth rates were 0.7 ± 8.0 and 0.03 ± 0.16 cm year-1, respectively for all the population.
The population was characterized by very high survival rates and low recruitment rates between the categories. The largest proportional numerical loss in the population was in the seedlings, mainly in 2000/2003 (Fig. 1, Table 2). In this category, there was recruitment for the juvenile, especially in 2003/2004 (Fig. 1, Table 2).
The juvenile presented high survival probability in all the surveys (Table 2, Fig. 1). About 80% of the juvenile that died were 15 cm of height or minus. Although the recruitment of young for adults had occurred, the registered maximum value was only 1.3% (Fig. 1, Table 2).
Adults’ abundance reduction was observed throughout the study. The mortality was higher than the recruitment. But the main cause of numerical reduction was the return to juvenile (Fig. 1, Table 2), due to breaks in the shoots. The reproduction was registered in both time intervals: however, the fecundity was higher in 2003/2004 (Fig. 1, Table 2).
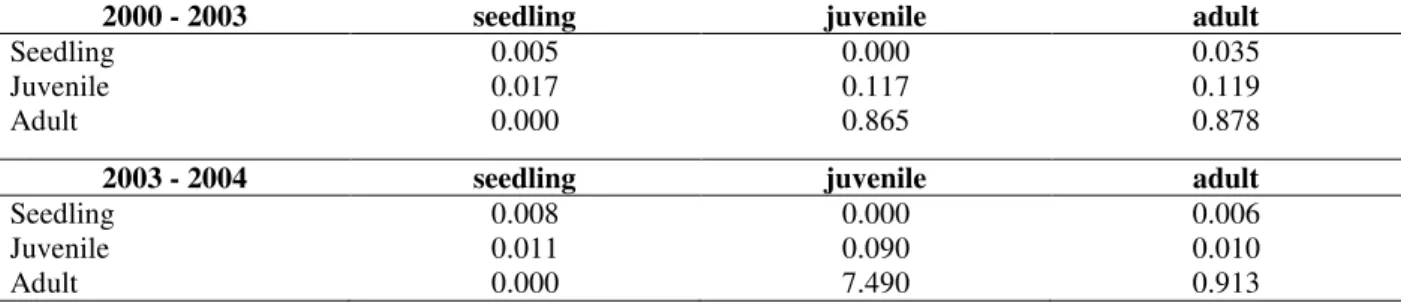
Table 2 - Transition matrices for Actinostemon concolor population in a flooded area (0.5 ha), Southern Brazil.
2000 - 2003 seedling juvenile Adult
Seedling 0.000 0.000 0.130
Juvenile 0.272 0.825 0.056
Adult 0.000 0.013 0.908
2003 - 2004 seedling juvenile Adult
Seedling 0.017 0.000 1.142
Juvenile 0.655 0.902 0.009
Adult 0.000 0.001 0.988
The intrinsic population growth rate (λ) was 0.921 ± 0.026 in 2000/2003 and 0.996 ± 0.028 in 2003/2004. The 2000/2003 λ value indicated that the population of A. concolor would reduce in size. However, 2003/2004 λ value indicated that the population size of A. concolor would remain stable.
The observed stage distribution was different from the stable stage distribution for both time periods considered (2000-2003: χ2-test = 12.1, p = 0.002; 2003-2004: χ2-test = 12.7, p = 0.002). If the observed transition rates were constant in time, the proportion of seedlings would have increased. The greater differences between the observed and stable stage distributions were recorded in adult’s category.
The intrinsic population growth rates were strongly influenced by the survival elements (principal diagonal) (Table 2). The highest elasticity was obtained for the adult survival (Fig. 2). Survival elasticity (0.97) was higher than the
elasticity of recruitment (0.02) and fecundity (0.01), indicating the importance of individual survival, especially adults, for the self-maintenance of the population (Fig. 2).
The highest sensitivity was observed for the recruitment of juvenile to adult (mainly in 2003/2004), followed by the survival of adults (Table 3). Fecundity was less important, considering the impact of numerical changes on λ (Table 3).
Figure 2 - Elasticity of λ to changes in stasis (S) and growth (R - recruitment) for Actinostemon concolor population in a flooded area (0.5 ha), Southern Brazil.
Table 3 - Sensitivity matrices for Actinostemon concolor population in a flooded area (0.5 ha), Southern Brazil.
2000 - 2003 seedling juvenile adult
Seedling 0.005 0.000 0.035
Juvenile 0.017 0.117 0.119
Adult 0.000 0.865 0.878
2003 - 2004 seedling juvenile adult
Seedling 0.008 0.000 0.006
Juvenile 0.011 0.090 0.010
Adult 0.000 7.490 0.913
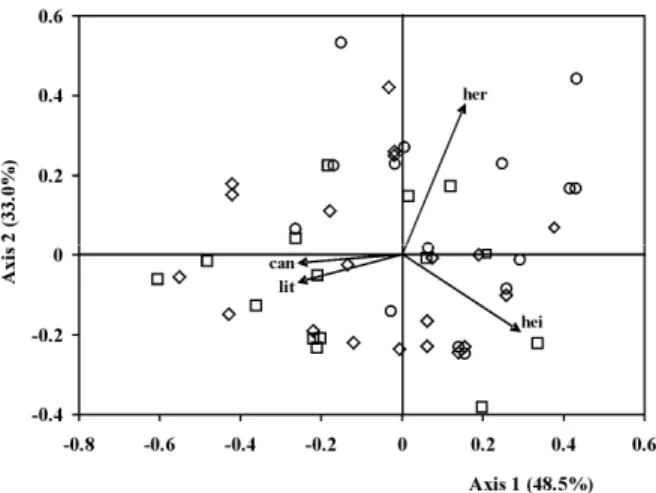
The first two axes of CA explained 81.5% of the total data variance (Fig. 5). The height of plots (r = 0.29), canopy cover (r = -0.26) and litter covers (r = -0.26) were the mainly variables associated to axis one. In relation to axis two, the variables were herbaceous cover (r = 0.38) and plots height (r = -0.20).
Despite not having the separation of groups, the plots of higher and lower densities of A. concolor
had been situated mainly on the left and on the right of axis one, respectively (Fig. 5). The plots with higher densities showed minor height and covering of herbaceous, more closed canopy and dense litter cover. In contrast, the plots with lower densities showed major height and the soil covered by the herbaceous plants, more opened canopy and low covering of litter.
Figure 5 - Correspondence analysis ordination diagram with plots (symbols) and environmental variables (arrow). can – canopy cover; lit – litter; hei – plots height; her – herbaceous cover. Square – plots with higher density; circles - plots with lower density; diamond – other plots.
DISCUSSION
The high density and a juvenile-dominated size structure observed for A. concolor population were expected as for an understorey species. The same trend was observed for the shade-tolerant tree species in temperate Japanese forest (Manabe et al. 2000). De Steven (1994) observed high density and predominance of seedling and sapling for two shade-tolerant canopy tree species in Panama. In Mallotus Lour. species, an understory trees of Bornean rain forests, there were approximately ten times more saplings than the adults (Primack and Lee 1991).
The A. concolor population presented a strong hierarchy among the individuals, with a small number of large individuals that contributed with the majority of biomass population. This size distribution was typical to shade-tolerant species (Wright et al. 2003). Size hierarchy was also observed for the populations of Mallotus species (Primack and Lee 1991), Trichilia tuberculata
juvenile mortality after the overflow in January 2003. Sediment deposition at some sites, soil erosion at other sites and dragging of dead trunks and twigs by the water were the main causes of mortality in this period. These results were also observed for Chrysophyllum gonocarpum (Mart. and Eichler ex Miq.) Engl. in the same area (Bianchini unpublished data). Marques and Joly (2000) found that the burial of smaller individuals by the sediment was the main cause of mortality for Calophyllum brasiliense Cambess population in a swamp forest in the southeastern Brazil. Standing dead adult of A. concolor was not observed and the main cause of mortality of these individuals was branches and tree falls. Deaths provoked by litter fall were observed for Cecropia obtusifolia Bertol. (Alvarez-Buylla and Martínez-Ramos 1992) and Dipteryx panamensis (Pittier) Record and Mell (Clark and Clark 1987).
The individuals of A. concolor grew slowly in the understory. As the probability of death of small individuals is larger (De Steven 1994; Olmsted and Alvarez-Buylla 1995), the slow growth of this species contributes to an increase in the mortality among the seedlings and juveniles. Gomes et al. (2003) related that species with low growth rates could present high mortality.
The low fecundity values observed in this study could be related to the mortality of seedlings after the germination. Changes in the stasis rates of A. concolor among the years promoted by stochastic events such as flooding, could be related to the differences in the fecundity values mentioned. The slow growth of A. concolor was also related to the low adult recruitment and the accumulation of juveniles. According to Gomes et al. (2003), species with low growth rates showed low recruitment of individuals. Gomes et al. (2003) described higher values of λ to understory species of mountain secondary forest than A. concolor. But A. concolor showed larger death probability for the adults than the species studied by Gomes et al. (2003). This result could explain the lower values of λ in A. concolor because its values were very sensitive to the alterations in adults’ survival probabilities.
For A. concolor, the transition probabilities were not constant in time, indicating that the population size changed, mainly because of stochastic factors that acted on the population. The λ elasticity and sensitivity of demographic process followed the pattern described in the literature (Barot et al.
2000; Svenning 2002; Guedje et al. 2003; Pulido et al. 2007; Kouassi et al. 2008). Thus, the model would provide higher values of λ in the years when environmental conditions favored the survival of adults and/or the recruitment from juvenile to adults.
Considering the different vital rates between the periods, the high λ sensitivity for the survival of adults and recruitment from the juvenile to adult, the unpredictability of the environment (flooding for example) and the position of plant species in several phytosociological studies carried out in the region (Silva et al. 1992; Soares-Silva et al. 1992; Nakagima et al. 1996; Dias et al. 1998; Soares-Silva et al. 1998; Bianchini et al. 2003), it could be concluded that the population size of A. concolor could vary over the time, but the species would remain as one of the most important in the community.
A patchy spatial pattern was observed for the A. concolor population in the MGEP’s flooded areas, similar to observed by Bianchini et al. (2010) in other forest fragment in the region. In the MGEP, plots lower in height (longer time of flooding) and with higher canopy cover (lower light intensity) were the main sites of species occurrence. This suggested the occurrence of favorable microenvironmental conditions to the regeneration of A. concolor, as suggested by Manabe et al. (2000) and Miyamoto et al. (2003) for the species studied by them. However, this interpretation required some care because this study was conducted at small scales.
The patchy spatial pattern could be also related to low dispersal seed (Law and Dieckmann 2000). As A. concolor is an autochoric species, the majority of their seeds fall under the parent plant. For the shade-tolerant species, adults crown provide a shaded place suitable for the species establishment (Richards 1997).
ACKNOWLEDGMENTS
REFERENCES
Alberti LF, Morrelato LPC. Influência da abertura de trilhas antrópicas e clareiras naturais na fenologia reprodutiva de Gymnanthes concolor (Spreng.) Müll. Arg. (Euphorbiaceae). Rev bras bot. 2008; 31(1): 53-59.
Alvarez-Buylla ER. Density dependence and patch dynamics in tropical rain forests: matrix models and applications to a tree species. Amer Nat. 1994; 143(1): 155-191.
Alvarez-Buylla ER, Martínez-Ramos M. Demography and allometry of Cecropia obtusifolia, a neotropical pionner tree - an evaluation of the climax - pionner paradigm for tropical rain forests. J Ecol. 1992; 80: 275-290.
Appolinário, V, Oliveira Filho AT, Guilherme FAG. Tree population and community dynamics in a Brazilian tropical semideciduous forest. Rev bras bot. 2005; 28: 347-360.
Barot S, Gignoux J, Vuattoux R, Legendre S. Demography of a savanna palm tree in Ivory Coast (Lamto): population persistence and life-history. J Trop Ecol. 2000; 16: 637-655.
Bastida F, Talavera S. Temporal and spatial patterns of seed dispersal in two Cistus species (Cistaceae). Ann Botany. 2002; 89: 427-434.
Bianchini E, Pimenta JA, Santos FAM. Spatial and temporal variation in the canopy cover in a tropical semi-deciduous forest. Braz arch biol technol. 2001; 44(3): 269-276.
Bianchini E, Garcia CC, Pimenta JA, Torezan JMD. Slope variation and population structure of tree species from different ecological groups in South Brazil. An acad. bras cienc. 2010; 82(3): 643-652. Bianchini E, Popolo RS, Dias MC, Pimenta JA.
Diversidade e estrutura de espécies arbóreas em área alagável do município de Londrina, sul do Brasil. Acta bot bras. 2003; 17(3): 405-419.
Bleher B, Böhning-Gaese K. Consequences of frugivore diversity for seed dispersal, seedling establishment and the spatial pattern of seedlings and trees. Oecol. 2001; 129: 385-394.
Caswell H. A general formula for the sensitivity of population growth rate to changes in life history parameters. Theor pop biol. 1978; 14: 215-230. Caswell H. Matrix population models. Sunderland:
Sinauer; 2000
Cielo-Filho R, Gneri MA, Martins FR. Position on slope, disturbance, and tree species coexistence in a Seasonal Semideciduous Forest in SE Brazil. Plant ecol. 2007; 190: 189-203.
Clark DB, Clark DA. Population ecology and microhabitat distribution of Dipteryx panamensis, a neotropical rain forest emergent tree. Biotropica. 1987; 19(3): 236-244.
Condit R, Hubbel SP, Foster RB. Assessing the response of plant functional types to climatic change in tropical forests. J veg Science. 1996; 7: 405-416. Dale MRT. Spatial Pattern Analysis in Plant Ecology.
Cambirdge: Cambridge University Press; 1999. De Kroon H, Plaisier A, Van Groenendael JM, Caswell
H. Elasticity: the relative contribution of demographic parameters to population growth rate. Ecology. 1986; 67(5): 1427-1431.
De Steven D. Tropical tree seedling dynamics: recruitment patterns and their population consequences for three canopy species in Panama. J trop ecol. 1994; 10: 369-383.
Dias MC, Vieira AOS, Nakagima JN, Pimenta, JA, Lobo PC. Composição florística e fitossociologia do componente arbóreo das florestas ciliares do rio Iapó, na bacia do rio Tibagi, Pr. Rev bras bot. 1998; 21(1): 183-195.
Ferson S. Generalized stage-basead modeling for population dynamics. New York: Exeter software Inc.; 1990.
Fonseca MG, Martini AMZ, Santos FAM. Spatial structure of Aspidosperma polyneuron in two semi-deciduous forests in Southeast Brazil. J veg science. 2004; 15: 41-48
Gomes EPC, Mantovani W, Kageyama PY. Mortality and recruitment of trees in a secondary montane rain Forest in southeastern Brazil. Braz j biol. 2003; 63(1): 47-60.
Guedes TA, Ivanqui IL, Martins ABT, Cochia EBR. Seleção de variáveis categóricas utilizando análise de correspondência e análise procrustes. Acta sci. 1999; 21(4): 861-868.
Guedje NM, Lejoly J, Nkongmeneck B, Jonkers WBJ. Population dynamics of Garcinia lucida (Clusiaceae) in Cameroonian Atlantic Forests. Forest ecol manag. 2003; 177: 231-241.
Kouassi KI, Barot S, Gignoux J, Zoro Bi IA. Demography and life history of two rattan species, Eremospatha macrocarpa and Laccosperma secundiflorum, in Côte d’Ivore. J trop ecol. 2008; 24: 493-503.
Law R, Dieckmann U. A dynamical system for neighborhoods in plant communities. Ecology. 2000; 81(8): 2137-2148.
Lemmon PE. A spherical densiometer for estimating forest overstorey density. Forest sci. 1956; 2: 341-320.
Manabe T, Nishimura N, Miura M, Yamamoto S. Population structure and spatial patterns for trees in a temperate old-growth evergreen broad-leaved Forest in Japan. Plant ecol. 2000; 151: 181-197.
Martínez-Ramos M, Alvarez-Buyla ER, Sarukhán J. Tree demography and gap dynamics in a tropical rain forest. Ecology. 1989; 70: 555-558.
McCune B, Mefford MJ. Multivariate analysis of ecological data, version 4.26. Gleneden Beach: MjM Software Design; 1999.
Medri ME, Bianchini E, Pimenta JA, Colli S, Müller C. Estudos sobre a tolerância ao alagamento em espécies arbóreas nativas da bacia do rio Tibagi. In: Medri ME, Bianchini E, Shibata OA, Pimenta JA, editores. A bacia do rio Tibagi. Londrina: edição dos editores; 2002. p. 133-172.
Miyamoto K, Suzuki E, Kohyama T, Seino T, Mirmanto E, Simbolon H. Habitat differentiation among tree species with small-scale variation of humus depth and topography in a tropical heath Forest of Central Kalimantan, Indonesia. J trop ecol. 2003; 19: 43-54.
Morellato LPC, Leitão-Filho HF. Padrões de frutificação e dispersão na Serra do Japi. In: Morellato LPC, editor. História natural da Serra do Japi: ecologia e preservação de uma área florestal no Sudeste do Brasil. Campinas: Editora da Unicamp; 1992. p. 112-140.
Nakagima JN, Soares-Silva LH, Medri ME, Goldenberg R, Correa GT. Composição florística e fitossociologia do componente arbóreo das florestas ciliares da bacia do rio Tibagi. 6. Fazenda Monte Alegre, município de Telêmaco Borba, Pr. Arq biol tecnol. 1996; 39: 933-948.
Olmsted I, Alvarez-Buylla ER. Sustainable harvesting of tropical trees: demography and matrix models of two palm species in Mexico. Ecol appl. 1995; 5: 484-500.
Primack RB, Lee HS. Population dynamics of pioneer (Macaranga) trees and understorey (Mallotus) trees (Euphorbiaceae) in primary and selectively logged Bornean rain forests. J trop ecol. 1991; 7: 439-458. Pulido MT, Valverde T, Caballero J. Variation in the
population dynamics of the palm Sabal yapa in a landscape shaped by shifting cultivation in the Yucatan Peninsula, Mexico. J trop ecol. 2007; 23: 139-149.
Ramirez N, Arroyo MK. Estructura poblacional de Copaifera pubiflora Benth. (Leguminosae; Caesalpinioideae) en los Altos Llanos Centrales de Venezuela. Biotropica. 1990; 22(2): 124-132.
Richards PW. The tropical rain forest: an ecological study. Cambridge: Cambridge University Press; 1997.
Ripley BD. Modelling spatial patterns. J r statist soc b. 1977; 39: 172-212.
Rosenberg MS. Passage – Pattern Analysis, Spatial Statistics, and Geographic Exegesis. Tempe: Arizona State University; 2001.
Santos FAM, Pedroni F, Alves LF, Sanchez M. Structures and dynamics of tree species of the Atlantic Forest. An acad bras cienc. 1998; 79(4): 873-880.
Silva SM, Silva FC, Vieira AOS, Nakagima JN, Pimenta JA, Colli S. Composição florística e fitossociológica do componente arbóreo das florestas ciliares da Bacia do Rio Tibagi, Paraná: 2. Várzea do Rio Bitumirim, município de Ipiranga-PR. Rev inst flor. 1992; 4: 192-198.
Smith LB, Downs RJ, Reitz R. Euforbiáceas. In: Reitz R, editor. Flora Ilustrada Catarinense. Itajaí: Herbário Barbosa Rodrigues; 1988.
Soares-Silva LH, Kita KK, Silva FC. Fitossociologia de um trecho de floresta de galeria no Parque Estadual Mata dos Godoy, Londrina-PR, Brasil. Bol herb Ezechias Paulo Heringer. 1998; 3: 46-62.
Soares-Silva LH, Bianchini E, Fonseca EP, Dias MC, Medri ME, Zangaro W. Composição florística e fitossociológica do componente arbóreo das florestas ciliares da bacia do rio Tibagi. 1- Fazenda Doralice - Ibiporã-PR. Rev inst flor. 1992; 4: 199-206.
StatSoft. Statistica for Windows. Tulsa: StatSoft Inc; 2004.
Svenning JC. Crown illumination limits the population growth rate of a neotropical understorey palm (Geonoma macrostachys, Arecaceae). Plant ecol. 2002; 159: 185-199.
Van Groenendael JM, Bullock SH, Pérez-Jiménez LA. Aspects of the population biology of the gregarious tree Cordia elaeagnoides in Mexican tropical deciduous forest. J trop ecol. 1996; 12: 11-24
Vicente RF. O Parque Estadual Mata dos Godoy. In: Torezan JMD, editor. Ecologia do Parque Estadual Mata dos Godoy. Londrina: Itedes; 2006. p. 13-18. Wright SJ, Muller-Landau HC, Condit R, Hubbel SP.
Gap-dependent recruitment, realized vital rates, and size distributions of tropical trees. Ecology. 2003; 84(12): 3174-3185.