Effects of Malnutrition on Left Ventricular
Mass in a North-Malagasy Children
Population
Giuseppe Di Gioia1¤*, Antonio Creta1, Mario Fittipaldi2, Riccardo Giorgino1,
Fabio Quintarelli3, Umberto Satriano1, Alessandro Cruciani1, Vincenzo Antinolfi4, Stefano Di Berardino6, Davide Costanzo1, Ranieri Bettini5, Giuseppe Mangiameli6, Marco Caricato6, Giovanni Mottini7
1Department of Medicine and Surgery, Cardiology Unit, UniversitàCampus Bio-Medico di Roma, Rome, Italy,2Paediatric Cardiothoracic Surgery, Starship Greenlane Paediatric and Congenital Heart Service, Auckland, New Zealand,3Department of Medicine and Surgery, Pediatrics Service, UniversitàCampus Bio-Medico di Roma, Rome, Italy,4Department of Heart and Great Vessels“Attilio Reale”, Sapienza University, Rome, Italy,5Cardiology Department, University of Pisa, Pisa, Italy,6Department of Medicine and Surgery, Unit of Geriatric Surgery, UniversitàCampus Bio-Medico di Roma, Rome, Italy,7Department of Medicine and Surgery, Institute of Philosophy of Scientific and Technological Practice (FAST), UniversitàCampus Bio-Medico di Roma, Rome, Italy
¤ Current address: Department of Medicine and Surgery, Cardiology Unit, UniversitàCampus Bio-Medico di Roma, Rome, Italy
Abstract
Background
Malnutrition among children population of less developed countries is a major health prob-lem. Inadequate food intake and infectious diseases are combined to increase further the prevalence. Malnourishment brings to muscle cells loss with development of cardiac com-plications, like arrhythmias, cardiomyopathy and sudden death. In developed countries, malnutrition has generally a different etiology, like chronic diseases. The aim of our study was to investigate the correlation between malnutrition and left ventricular mass in an Afri-can children population.
Methods
313 children were studied, in the region of Antsiranana, Madagascar, with age ranging from 4 to 16 years old (mean 7,8±3 years). A clinical and echocardiographic evaluation was per-formed with annotation of anthropometric and left ventricle parameters. Malnutrition was defined as a body mass index (BMI) value age- and sex-specific of 16, 17 and 18,5 at the age of 18, or under the 15thpercentile. Left ventricle mass was indexed by height2.7(LVMI).
Results
We identified a very high prevalence of children malnutrition: 124 children, according to BMI values, and 100 children under the 15thpercentile. LVMI values have shown to be increased a11111
OPEN ACCESS
Citation:Di Gioia G, Creta A, Fittipaldi M, Giorgino R, Quintarelli F, Satriano U, et al. (2016) Effects of Malnutrition on Left Ventricular Mass in a North-Malagasy Children Population. PLoS ONE 11(5): e0154523. doi:10.1371/journal.pone.0154523
Editor:Massimo Ciccozzi, National Institute of Health, ITALY
Received:February 15, 2016
Accepted:April 14, 2016
Published:May 3, 2016
Copyright:© 2016 Di Gioia et al. This is an open access article distributed under the terms of the
Creative Commons Attribution License, which permits unrestricted use, distribution, and reproduction in any medium, provided the original author and source are credited.
Data Availability Statement:All relevant data are within the paper.
Funding:The authors received no specific funding for this work.
in proportion to BMI percentiles ranging from 29,8±10,8 g/m2.7in the malnutrition group to 45±15,1 g/m2.7in>95thpercentile group. LVMI values in children<15thBMI percentile were significantly lower compared to normal nutritional status (29,8±10,8 g/m2,7vs. 32,9± 12,1 g/m2,7, p = 0.02). Also with BMI values evaluation, malnourished children showed
sta-tistically lower values of LVMI (29,3±10,1 g/m2,7vs. 33,6±12,5 g/m2,7, p = 0.001).
Conclusion
In African children population, the malnourishment status is correlated with cardiac muscle mass decrease, which appears to be reduced in proportion to the decrease in body size.
Introduction
Children malnourishment is a common disease in less-developed countries mostly due to inad-equate food intake, but also political or socioeconomic factors affecting life quality of the popu-lation. It constitutes a major public health problem in the developing world and represents the most important risk factor for the burden of disease. About 5 million children have died world-wide directly or indirectly due to malnutrition and 9 children/minute die as a consequence of malnutrition; World Health Organization (WHO) has identified childhood malnutrition as the most lethal form of malnutrition [1,2]. Globally, it is estimated that there are about 20 million children who are severely malnourished, most of them live in south Asia and in sub-Saharan Africa [3]. In these communities the high prevalence of poor diet and infectious diseases regu-larly gives rise to a vicious cycle [4]. Some chronic clinical conditions, like renal diseases, cystic fibrosis and acquired immunodeficiency syndrome or social problems like parental drug addic-tion or alcoholism, can bring to a deficient nutriaddic-tional status also in advanced countries [5,6]. Malnourished children suffer several alterations in body composition, together with loss of skeletal and cardiac muscle mass, complicated by electrolyte imbalance, mineral and vitamin deficiencies that could bring also to cardiac abnormalities, including hypotension, cardiac arrhythmias, cardiomyopathy, cardiac failure and even sudden death [7,8]. A consensus of expert highlighted muscle mass wasting as the key feature of disease-associated malnutrition [9]. Malnutrition affecting left ventricle mass was previously studied in Western countries, but no data exist regarding less developed countries where malnourishment’s etiology is different. One of the most commonly used and recommended parameters to assess nutritional status in adults is the body mass index (BMI). An adaptation for children has been limited in the past, because BMI is not constant across the pediatric age range [10]. In recent years, several coun-tries added age- and sex-specific BMI values and BMI percentiles to their growth charts. BMI percentile provides a way of comparing a child’s weight, adjusted for height, with a reference group of the same age, but not necessarily the same stature.
The aim of our study was to evaluate the correlation between nutritional status and left ven-tricle mass in an African children population.
Material and Methods
into the“Clinique Médico-Surgicale St. Damien”of Ambanja, we investigated the region of Antsiranana, in the north of Madagascar, visiting the catholic schools of Sekoly Venance Mani-fatra“SE.VE.MA.”and Foyer Mangafaly in Ambanja and the college Sainte Therese de l’Enfant Jesus in Maromandia, during the month of October 2015. In primary and high schools we ran-domly selected a class from each group of age to enroll individuals from 4 to 16 years of age.
At the“Clinique St. Damien”we enrolled children who came for routine visits or screening, or in-patients. All individuals underwent 3 steps. The first one was registration into our data-base with name, surname (when available), date-of-birth and demographical parameters. The second step included the clinical evaluation, it was performed by a pediatrician, with annota-tion of weight, height, subsequent body mass index (BMI) calculaannota-tion, blood pressure, heart rate and cardiac auscultation. The clinical questionnaire was undertaken by a visiting medical student—under the supervision of a medical doctor—aided, when necessary, by a local inter-preter who had been educated in advance. Teachers or their co-workers helped the younger children understanding and answering the questions. Finally, each child was submitted to a transthoracic echocardiogram, performed by two expert cardiologists, with a portable Esaote Mylab Five ecograph (Esaote s.p.a., Italia), equipped with a high-quality S5-1 transducer probe. Subjects were studied in the left lateral recumbent position and all standard echocardiographic views were acquired. Measurements of LV dimensions and volumes were obtained according to current American Society of Echocardiography (ASE) recommendations [11]. The LV inner dimensions were measured at end-diastole and end-systole using M-Mode echocardiography in the parasternal long axis view. End-diastole was defined as the frame following mitral valve closure, end-systole as the frame following mitral valve opening. Modified Simpson‘s biplane method by biapical views was used to calculate LV volumes and ejection fraction (EF). Pre-served LV function was defined as60%. Left ventricle mass (LVM) was calculated based on
Devereux’s formula [12] and indexed by height2.7[13] (LVMI). In particular, LVM results from the formula: LVM = ¼ 0.8 x (1.04 [LVIDd + PWTd + SWTd)3
–(LVIDd)3]) + 0.6 g,
where LVIDd is the left ventricular internal dimension at the end-diastole, PWTd is the poste-rior wall thickness at the end-diastole, and SWTd is the septal wall thickness at the end-diastole [11]. LVH was defined as a LVMI value>51 g/height2.7or above the 95thpercentile age- and
sex-specific [14]. BMI values to define malnutrition in children were adapted according to age and sex [15] and thinness grade 1, 2 and 3 (also called mild, moderate and severe malnutrition) were defined as the value to pass through a BMI of 16, 17 and 18,5 at the age of 18. Regarding BMI percentiles, the malnutrition status was diagnosed if a child was found to be under the 15thpercentile. The BMI 15thpercentile as cut-off value for malnutrition has been previously
validated by studies that used DEXA scan and average skinfold measurements [16]. Mathemat-ically, the 15th percentile corresponds approximately to the -1 standard deviation in a normal-ized distribution. Since widespread population illiteracy, written informed consent was difficult to obtain. So, a verbal informed consent, with teacher’s help to translate into local lan-guage, was obtained from children’s parents, who gave study approval to school’s teachers and our research group. The study was reviewed and approved—before it began—by ethics com-mittees of local hospital“Clinique Médico-Surgicale St. Damien”of Ambanja and University Campus Bio-Medico of Rome.
Statistical analysis
variables was calculated using Pearson’s test. A P value less than 0.05 was considered statisti-cally significant. Statistical analysis was performed with STATA Statistics for Windows (SE, version 13).
Results
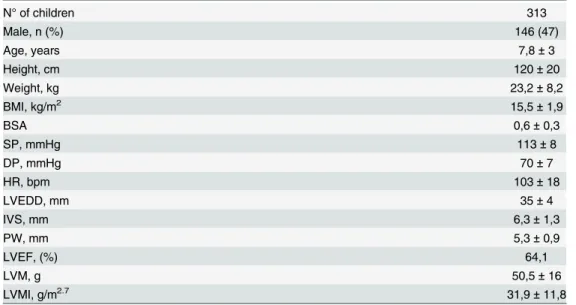
313 children of African race were studied, with a slight prevalence of female sex (53%). Mean age was 7,8 ± 3 years, ranging from 4 to 16 years of age. Clinical and echocardiographic param-eters of the total study population are listed inTable 1. All children had normal arterial blood pressure. At echocardiographic evaluation, a valve disease was diagnosed in 4 children (3 of them having moderate mitral regurgitation and one aortic regurgitation). Two mitral valve prolapses with mild regurgitation were individuated. Five congenital heart defect (1,6%) were diagnosed: two inter-atrial septum defect, one inter-ventricular septum defect, one boy with bicuspid aortic valve and one four-year-old girl affected by cor triatriatum sinister.
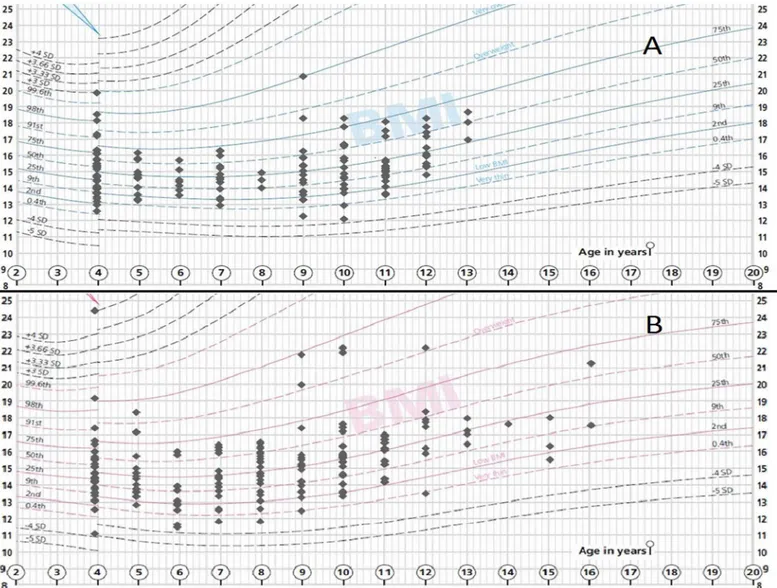
In our study children population, after adjusting BMI values for age and sex [15], we observed a high percentage of malnutrition status (124 children, 40%) with a severe malnutri-tion identified in 13 (4%) children; moderate in 41 (13%) and mild in 70 (22%). Dividing the children population according to BMI percentiles (Fig 1), we observed that more than 85% of children were under 50thpercentile. In the detail, 100 children (32%) were under 15th percen-tile, indicating a pathological nutritional status; 113 children (36%) were between the 15thand 25th; 61 (19%) between 25thand 50th; 21 children (7%) between 50thand 75th; 8 (3%) between 75thand 95th and only 10 (3%) over 95thpercentile.
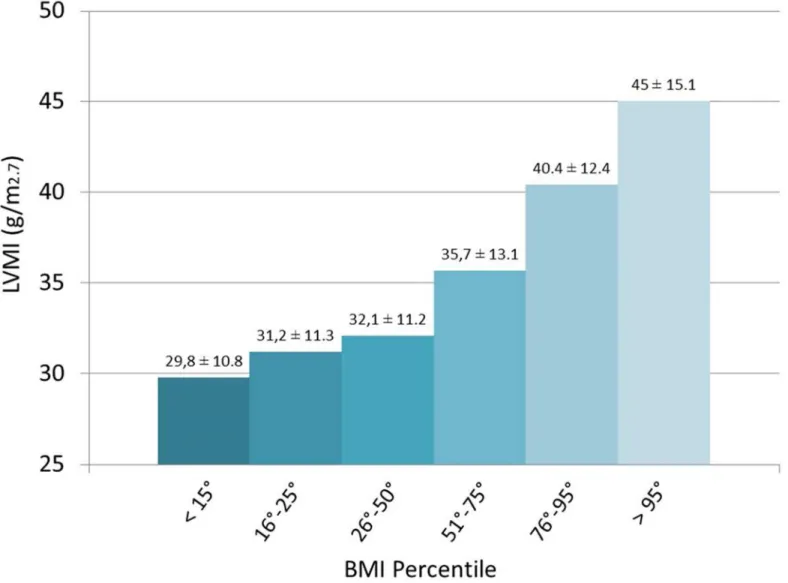
LVMI values were strictly correlated to the BMI percentiles ranging from 29,8 ± 10,8 g/m2.7 in the malnutrition group (<15thpercentile) to LVMI of 45 ± 15,1 g/m2.7in>95thpercentile
group (seeFig 2). Children with a lower BMI, according to their age and sex, entering in a
Table 1. Characteristics of study population.
N° of children 313
Male, n (%) 146 (47)
Age, years 7,8±3
Height, cm 120±20
Weight, kg 23,2±8,2
BMI, kg/m2 15,5±1,9
BSA 0,6±0,3
SP, mmHg 113±8
DP, mmHg 70±7
HR, bpm 103±18
LVEDD, mm 35±4
IVS, mm 6,3±1,3
PW, mm 5,3±0,9
LVEF, (%) 64,1
LVM, g 50,5±16
LVMI, g/m2.7 31,9±11,8
Demographical, clinical and echocardiographic parameters of general population. The numbers are expressed as numerical values (%) or mean±standard deviation.
Abbreviations. BMI: body mass index; BSA: body surface area; DP: diastolic pressure; HR: heart rate; IVS: inter-ventricular septum; LVEDD: left ventricle end-diastolic diameter; LVEF: left ventricle ejection fraction; LVM: left ventricle mass; LVMI: left ventricle mass indexed; PW: posterior wall; SP: systolic pressure.
malnourishment status, had statistically lower value of LVMI compared to children with nor-mal nutrition profile (29,3 ± 10,1 g/m2.7vs. 33,6 ± 12,5 g/m2.7respectively, p = 0.001)
(Table 2). Also dividing the population according to BMI percentiles, the same results were obtained: LVMI values in children<15thpercentile were statistically lower, compared to
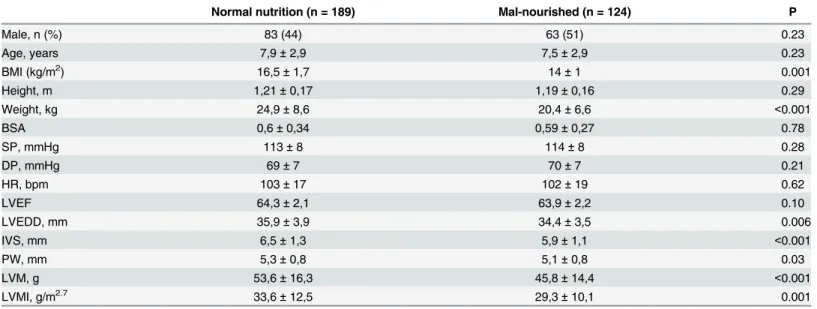
nor-mal nutritional status (29,8 ± 10,8 g/m2.7vs. 32,9 ± 12,1 g/m2.7respectively, p = 0.02). Malnourished children were more frequently male (63/146, 43%), among which 3 children suffering of severe, 22 of moderate and 38 of mild malnutrition. Regarding females, malnutri-tion was diagnosed in 61 of 167 (37%), with 10 children affected by severe, 19 by moderate and 32 by mild malnutrition state. Between malnourished and normal nutrition group (Table 3) there were no differences regarding sex prevalence, age, height, BSA, arterial blood pressure and heart rate, while there was a statistically difference on echocardiographic parameters. Mal-nourished children showed a smaller LV dimension (34,4 ± 3,5 mm vs. 35,9 ± 3,9 mm; p = 0.006) a thinner IVS (5,9 ± 1,1 mm vs. 6,5 ± 1,3 mm; p<0.001) and PW (5,1 ± 0,8 mm vs.
5,3 ± 0,8 mm; p = 0.03) and lower values of LVM (45,8 ± 14,4 g vs. 53,6 ± 16,3 g; p<0.001) and Fig 1. Children distribution according to BMI percentiles.BMI percentile distribution of our children population according to age and sex.A: male sex. B: female sex.(Adapted from Royal College of Paediatrics and Child Health BMI charts).
LVMI (29,3 ± 10,1 g/m2.7vs. 33,6 ± 12,5 g/m2.7; p = 0.001). Although this differences in LV
dimensions, LVEF—that is the most used parameter for the evaluation of ventricular systolic function—showed no significant change in the malnourished group compared to normal weight children (p = 0.107).
Fig 2. Correlation between LVMI and BMI percentiles.LVMI values decrease in proportion to the reduction of BMI percentiles.
doi:10.1371/journal.pone.0154523.g002
Table 2. Correlation between malnutrition state (according to BMI and BMI percentiles) and LVMI.
BMI BMI percentile
Mal-nourished Normal nutrition p Mal-nourished Normal nutrition p
Children, n (%) 124 (40) 189 (60) 100 (41) 213 (59)
LVMI (g/m2.7) 29,3±10,1 33,6±12,5 0.001 29,8±10,8 32,9±12,1 0.02
Mal-nourished children showed statistically significant lower values of LVMI. The numbers are expressed as numerical values (%) or mean±standard deviation.
Abbreviations. BMI: body mass index; LVMI: left ventricle mass indexed.
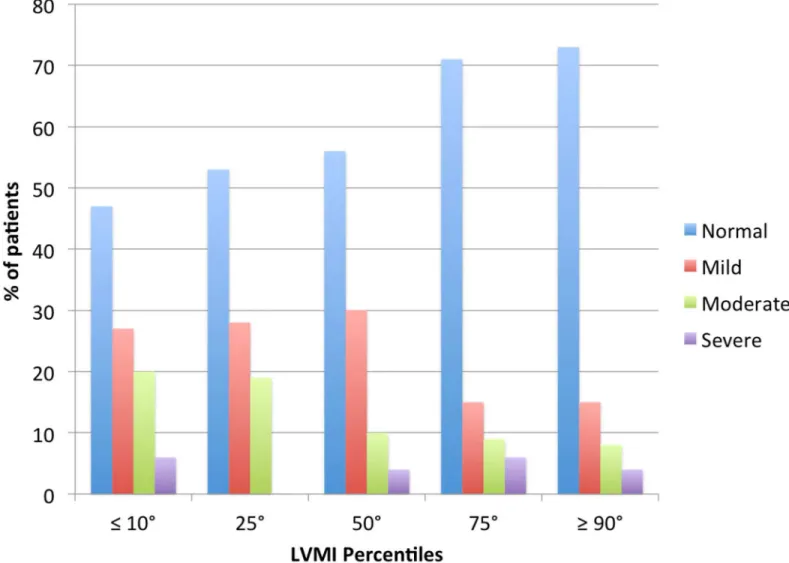
According to the work of Khoury et al. [17] which gave age and sex-specific reference values for children’s LVMI, our study population was divided as follows: 86 children (27%) were in the10thpercentile, 32 (10%) were in the 25th, 57 (18%) in the 50th; 55 (18%) in the 75th, 30
(10%) in the 90th, 13 children (4%) in the 95thand 40 (13%) with values above 95thpercentile. 24 children (8%) had a LVM value>51 g/m2.7(ranging from 52,3 to 82,3 g/m2.7), indicating
LVH. LVMI percentiles were related to BMI. As shown inFig 3, children with normal nutri-tional status increased progressively with the growth of LVMI percentiles (from 47% in chil-dren with LVMI10° percentile to 73% in those with LVMI90° percentile).
Discussion
In less-developed countries, malnutrition is major health problem affecting most of the popula-tion, both children and adults. According to WHO 2008–2012 data, malnutrition prevalence in Madagascar is alarming, affecting 36% of children population, presenting in a moderate to severe underweight status. In our study we found a malnutrition status in 40% of children pop-ulation, according to BMI values, and 32% of children under 15thpercentile. Poor health liter-acy and misconceptions regarding proper nutrition and malnutrition, and insufficient production of adequate food products are at the base of this problem. Nutritional status and heart disease are strictly connected with an important influence on long-term prognosis. Chil-dren affected by malnutrition can exhibit a series of cardiovascular abnormalities, including hypotension, cardiac arrhythmias, cardiomyopathy, cardiac failure and in some cases, sudden death [18–21]. Nowadays, pathogenic mechanisms of morphological and functional cardiac alterations associated with malnutrition have not been still completely elucidated. Necropsy studies have demonstrated myocardial degeneration, myocytolysis, fat infiltration or
Table 3. Normal nutrition status versus mal-nourished children (according to BMI).
Normal nutrition (n = 189) Mal-nourished (n = 124) P
Male, n (%) 83 (44) 63 (51) 0.23
Age, years 7,9±2,9 7,5±2,9 0.23
BMI (kg/m2) 16,5±1,7 14±1 0.001
Height, m 1,21±0,17 1,19±0,16 0.29
Weight, kg 24,9±8,6 20,4±6,6 <0.001
BSA 0,6±0,34 0,59±0,27 0.78
SP, mmHg 113±8 114±8 0.28
DP, mmHg 69±7 70±7 0.21
HR, bpm 103±17 102±19 0.62
LVEF 64,3±2,1 63,9±2,2 0.10
LVEDD, mm 35,9±3,9 34,4±3,5 0.006
IVS, mm 6,5±1,3 5,9±1,1 <0.001
PW, mm 5,3±0,8 5,1±0,8 0.03
LVM, g 53,6±16,3 45,8±14,4 <0.001
LVMI, g/m2.7 33,6±12,5 29,3±10,1 0.001
Comparison of demographical, clinical and echocardiographic data between mal-nourished and normal nutrition status children according to BMI. Mal-nourished children showed statistically lower values of all echocardiographic parameters, except of LVEF. The numbers are expressed as numerical values (%) or mean±standard deviation.
Abbreviations. BMI: body mass index; BSA: body surface area; DP: diastolic pressure; HR: heart rate; IVS: inter-ventricular septum; LVEDD: left ventricle end-diastolic diameter; LVEF: left ventricle ejection fraction; LVM: left ventricle mass; LVMI: left ventricle mass indexed; PW: posterior wall; SP: systolic pressure.
substitution of muscle cells by fat (adipose) tissue. Membrane action potential of myocardic (myocardial or cardiac muscle) cells could be altered in malnourished subjects due to structural muscular changes, variations of blood flow and water content or potassium channel modifica-tion observed in hypotrophic cardiomyocytes [22]. Previous old echocardiographic studies showed a correlation between protein energy malnutrition (PEM) and left ventricle abnormali-ties. Anyway, there are several consistent differences between previous studies and ours. In fact, the work of Bergman et al. [23], was based on only 21 subjects and it was evaluated only the correlation with cardiac dimension, without any study on left ventricular mass. Singh et colleagues [24] studied 46 malnourished children in a different range of age (between 3–48 months), while the study by Kothari et al. [25] was about only 25 malnourished children, also investigating a range of age different from our study (one to five years old children). Moreover, all this studies were conducted in developed countries. More recently, Olivers et al. found that the decrement of LVM and LVMI was proportional to the decrement in the total body mass [7]. Also the study by Faddan et al., found that in children with PEM, echocardiographic evalu-ation revealed a significantly lower IVS thickness, PW thickness and LVM than the control
Fig 3. Nutritional status and LVMI percentiles.Nutritional children status divided as normal or mild, moderate or severe mal-nourishment according to LVMI Percentiles. Number of children with normal nutritional status was higher in greater LVMI percentiles.
group [26]. In our study, we found that children affected by any degree of malnutrition had lower value of LVMI compared to normal nutritional status children. Moreover, LVMI increased in proportion to the increase of BMI also in children with a normal nutritional status. Our findings are concordant with those found in previous studies, which reported that in patients with malnutrition the heart is not capable to escape from atrophy affecting other organs [8,27]. Cunha et al. [28] suggested that the cause of diminished cardiac mass in adult patients with PEM was slow myocardial anabolic rate rather than increased catabolism.
Scientific controversy exists whether malnourished children’s heart has normal or reduced systolic LV function. [23,24,29]. The study by Öcal et al. [8] and Bergman et al. [23] showed that both LV and fractional shortening were not different in the group with PEM compared to control group. On the other side, Phornphatkul et al. [20] demonstrated that children with PEM had associated cardiac muscle wasting and LV dysfunction and, moreover, systolic func-tion was further reduced with a loss in bodyweight of more than 40% [24]. In our study, even if LV mass is reduced in proportion to the decrease of BMI, LVEF was not abnormal. This result shows that LV systolic function is preserved despite the loss of myocardial mass.
An interesting data emerged from our study was the high prevalence of children showing LVH, revealed both from the value of LVMI—adjusted by age and sex (24 children, 8%)–and from LVMI>95thpercentile (40 children, 13%). In fact, the prevalence of LVH in pediatric
hypertensive population has been reported to vary from 8 to 41% depending on the criteria used for determining hypertension and LVMI [30]. Our study population was not affected by arterial hypertension and showed mean lower BMI values than developed countries, so that, seen the strictly connection between BMI and LVMI, we expected a lower percentage of LVH. Moreover, 4 children showing LVH had also a malnutrition status. We don’t know if in these children there was any factor preventing heart muscle cells from wasting during malnutrition, or if there is a concomitant heart comorbidity affecting cardiac mass. Our study is the first to highlight the correlation between malnutrition and cardiac mass in a less-developed country children population, where the main cause of malnutrition is poor diet intake.
Conclusion
Our study showed that, in an African children population, a mal-nourishment status is corre-lated with cardiac muscle mass decrease that appears to be reduced in proportion to the decrease in body size, evaluated through BMI and BMI percentiles.
Author Contributions
Conceived and designed the experiments: GDG GM US. Performed the experiments: GDG AC MF RG FQ SDB. Analyzed the data: MC GM AC VA. Wrote the paper: GDG RB DC.
References
1. Acute Malnutrition—Consortium of Universities for Global Health. Obtainable athttp://www. worldhunger.org/articles/Lear.
2. Collins S.‘Changing the way we address severe malnutrition during famine’Lancet. 2001; 358:498–
501. PMID:11513936
3. Onis D. The world-wide magnitude of protein energy malnutrition: an overview from the WHO Global Database on Child Growth. Bull World Health Organ. 1993;( 71):703–712. PMID:8313488
4. Sachdev HPS. Assessing Child Malnutrition—Some Basic Issues. Nutritional Foundation of India
Archives 156. New Delhi: NFI; 1996.
5. Suskind RM, Lewinter-Suskind L, Murthy KK, Suskind D, Liu D. The Malnourished Child: An Overview. In Suskind RM, Tontisirin K (eds):“Nutrition, Immunity and Infection in Infants and Children.”Nestle’
6. Leung AK, Robson WM, Fagan JE. Assessment of the child with failure to thrive. Am Fam Physician. 1993;( 48):1432–1438. PMID:8249774
7. Olivares JL, Vazquez M, Rodrguez G, Samper P, Fleta J. Electrocardiographic and echocardiographic findings in malnourished children. J Am Coll Nutr. 2005;( 24):38–43. PMID:15670983
8. Öcal B, Ünal S, Zorlu P, Tezi HT, Oguz D. Echocardiographic evaluation of cardiac functions and left ventricular mass in children with malnutrition. J Paediatr Child Health. 2001;( 37):14–7. PMID:
11168862
9. Evans WJ, Morley JE, Argil es J, Bales C, Baracos V, Guttridge D, et al. Cachexia: a new definition. Clin Nutr 2008;( 27):793–9. doi:10.1016/j.clnu.2008.06.013PMID:18718696
10. Fung KP, Lee J, Lau SP, Chow OK, Wong TW, Davis DP. Properties and clinical implications of body mass indices. Arch Dis Child. 1990 May; 65(5):516–9. PMID:2357091
11. Lang RM, Badano LP, Mor-Avi V, Afilalo J, Armstrong A, Ernande L et al. Recommendations for cardiac chamber quantification by echocardiography in adults: an update from the American Society of Echo-cardiography and the European Association of Cardiovascular Imaging. J Am Soc Echocardiogr. 2015 Jan; 28(1):1–39.e14. doi:10.1016/j.echo.2014.10.003PMID:25559473
12. Devereux RB, Alonso DR, Lutas EM, Gottlieb GJ, Campo E, Sachs I, et al. Echocardiographic assess-ment of left ventricular hypertrophy: comparison to necropsy findings. Am J Cardiol 1986;( 57):450–8. PMID:2936235
13. National High Blood Pressure Education ProgramWorking Group on High Blood Pressure in Children and Adolescents. The fourth report on the diagnosis, evaluation, and treatment of high blood pressure in children and adolescents. Pediatrics 2004;( 114):555–76. PMID:15286277
14. Hanevold C, Waller J, Daniels S, Portman R, Sorof J. The effects of obesity, gender, and ethnic group on left ventricular hypertrophy and geometry in hypertensive children: a collaborative study of the Inter-national Pediatric Hypertension Association. Pediatrics 2004;( 113):328–33. PMID:14754945
15. Cole TJ, Flegal KM, Nicholls D, Jackson AA. Body mass index cut offs to define thinness in children and adolescents: international survey. BMJ. 2007 Jul 28; 335(7612):194. Epub 2007 Jun 25. PMID:
17591624
16. Mei Z, Grummer-Strawn LM, Pietrobelli A, Goulding A, Goran MI, Dietz WH. Validity of body mass index compared with other body-composition screening indexes for the assessment of body fatness in children and adolescents. Am J Clin Nutr. 2002 Jun; 75(6):978–85. PMID:12036802
17. Khoury PR, Mitsnefes M, Daniels SR, Kimball TR. Age-specific reference intervals for indexed left ven-tricular mass in children. J Am Soc Echocardiogr. 2009 Jun; 22(6):709–14. doi:10.1016/j.echo.2009. 03.003PMID:19423289
18. McLaren DS. Protein energy malnutrition (PEM): Classification, pathogenesis, prevalance, prevention. In McLaren DS, Burman Deds. Textbook of Pediatric Nutrition. Churchill Livingstone, Edinburgh, 1982;103–13.
19. Figueroa-Colon R. Clinical and laboratory assessment of the malnourished child. In: Suskind RM, Sus-kind LL, eds. Textbook of Pediatric Nutrition. Raven Press Ltd., New York, 1993;191–203.
20. Phornphatkul C, Pongprot Y, Suskind R, George V, Fuchs G. Cardiac function in malnourished chil-dren. Clin. Pediatr. 1994;147–55.
21. Heymsfield SR, Bethel RA, Ansloy JD, Gibbs DM, Felner JM, Nutter DO, et al. Cardiac abnormalities in cachectic patients before and during nutritional repletion. Am. Heart J. 1978; 95: 584–94. PMID:
416704
22. Da Cunha DF, Pedrini CH, Sousa JC, dos Reis MA, Ramos SG, da Cunha SF, et al. Myocardial mor-phometric study in protein energy malnourished adults. Arq. Bras. Cardiol. 1998; 71:677–80. PMID:
10347950
23. Bergman JW, Human DG, De Moor MMA, Schultz JM. Effect of kwashiorkor on the cardiovascular sys-tem. Arch. Dis. Child. 1988; 63:1359–62. PMID:3202643
24. Singh GR, Malathi KE, Kasliwal RR, Ommar A, Padmavati S, Ramji S. An evaluation of cardiac function in malnourished children by non-invasive methods. Ind. Paediatr. 1989; 26:875–80.
25. Kothari SS, Patel TM, Shetalwad AM, Patel TK. Left ventricular mass and function in children with severe protein energy malnutrition. Int. J. Cardiol. 1992; 35:19–25. PMID:1563875
26. Faddan Nagla Hassan Abu et al.“Myocardial Dysfunction in Malnourished Children.”Annals of Pediat-ric Cardiology 3.2 (2010):113–118. PMC. Web. 27 Jan. 2016. doi:10.4103/0974-2069.74036PMID:
21234188
28. Cunha DF, Cunha SF, Reis MA, Teixeira Vde P. Heart weight and heart weight/ body weight coefficient in malnourished adults. Arg Bras Cardiol. 2002; 78:382–7.
29. Chase HP, Kumar V, Caldwell RT, O’Brien D. Kwashiorkor in the United States. Pediatrics 1980; 66:972–6. PMID:7454490