D eterminants of weight and
linear growth deficits in
children under two years of
age
ABSTRACT
OBJECTIVE: To identify determinants of protein-energy malnutrition resulting in weight and linear growth deficits in children.
METHODS: A cross-sectional study was carried out among 1,041 children (under two years of age) from 10 municipalities in Bahia, Northeastern Brazil, during 1999-2000. Both logistic regression and a hierarchical approach were used to identify factors associated with the anthropometric measures.
RESULTS: The basic determinant found in the final model for linear growth retardation was having up to two household appliances (OR=2.9; 95% CI: 1.74-4.90); as an underlying determinant, not attending prenatal visits (OR=2.7; 95% CI: 1.47-4.97); and, among immediate determinants were low birth weight (OR=3.6; 95% CI: 1.72-7.70) and reported hospitalization within 12 months before the interview (OR=2.4; 95% CI: 1.42-4.10). Determinants of weight deficit at the basic, underlying and immediate levels were: per capita monthly income of less than one-fourth of the minimum wage (OR=3.4; 95% CI: 1.41-8.16), not attending prenatal visits (OR=2.1; 95% CI: 1.03-4.35) and low birth weight (OR=4.8; 95% CI: 2.00-11.48) respectively.
CONCLUSIONS: Children’s weight and linear deficits were accounted for the overlapping of poor material living conditions, limited access to health care and disease burden. Interventions aimed at improving living conditions and better access to health care programs are strategies towards equity in children’s health and nutrition.
KEYW O RD S: Protein-energy malnutrition. Infant. Body weights and measures. Risk factors. Social conditions. Cross-sectional studies. Valterlinda Alves de O liveiraI
Ana M arlúcia O liveira AssisI
Sandra M aria Conceição PinheiroI
M auricio Lima BarretoII
I Escola de Nutrição. Universidade Federal
da Bahia (UFBA). Salvador, BA, Brasil
I I Instituto de Saúde Coletiva. UFBA.
Salvador, BA, Brasil
Correspondence:
Valterlinda Alves de Oliveira Escola de Nutrição
Universidade Federal da Bahia R. Araújo Pinho, 32 Canela 40110-150 Salvador, BA, Brasil E-mail: valterlinda@terra.com.br
INTRODUCTION
The first years of life constitute the most dynamic phase in the process of growth during childhood and are highly vulnerable to social, economic and envi-ronment conditions.18 Malnutrition during childhood is a major health concern in developing countries.
It is estimated that 38.1% of children under five have severe deficit in the height-to-age anthropometric measure and 31% have severe deficit of the weight-to-age measure.21
A few countries show now a declining trend in the prevalence of protein-energy malnutrition during childhood,21 including Brazil.16 Brazilian population has now a 5.7% weight deficit and 10.5% linear growth deficit16 showing different geographic distri-butions. The prevalences of weight-to-age and height-to-age deficits in the Northeastern region are 8.3% and 17.9%, respectively, while in the Southern re-gion are 2% and 5.1%, respectively. The gaps in an-thropometric measures of Brazilian children between country regions have been explained by different lev-els of social and economic development as well as investments in sanitation, health care and education.11
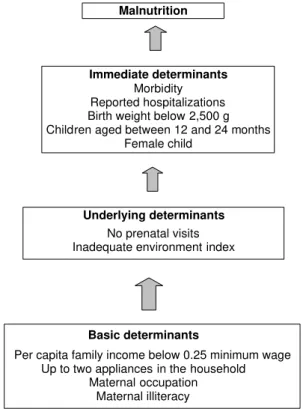
The United Nations Fund for Childhood5 (Unicef) categorizes the causes of protein-energy malnutrition during childhood into hierarchical levels. For better understanding this event, Unicef recommends a model based on three explanatory levels including basic, underlying, and immediate determinants.
In this model, structural or basic determinants are rep-resented by indicators of access to the resources needed for survival available in the community, re-flected in the population’s socioeconomic condi-tions.2 This set of determinants interfaces with inter-mediate or underlying determinants, which are in-cluded in the second hierarchical level of the model and relate to the number and quality of care services provided by the government and to the ability of fami-lies to use them. In the third level of the hierarchical model immediate determinants are included, reflect-ing children’s health and nutritional status. These determinants are conditioned, on one hand, by basic causes directly expressed by the family’s economic condition and, on the other hand, by the extent to which children’s health care needs are met and care is provided by the family and by primary care services available in the community.20
The four determinants of malnutrition in Brazil, es-pecially in the Northeastern region, are well-known but they have not often been studied using a hierar-chical approach. Thus, the present study aimed at describing determinants of weight and linear growth deficits in children based on a hierarchical approach with different explanatory levels for determining health and nutritional status during childhood.
M ETH O D S
A cross-sectional study comprising a sample of 1,041 children under two years of age, originally selected for a larger study, was carried out between March 1999 and 2000. The study aimed at assessing health and nutritional status of preschool children living in 10 municipalities of the state of Bahia, Northeastern Brazil.*
The sample size estimate was based on the number of children under five years of age living in rural and urban areas of the municipalities sampled in the 1996 Brazilian Census Survey,** and on the prevalence of child malnutrition in the Northeastern region (8.3% for weight-to-age measure) estimated in the National Demographic and Health Survey (PNDS).16 Hence, a sample size of 2,733 preschool children was estimated and those 1,041 children under two years of age were included in the study.
Taking into account the most significant associations of basic determinants of malnutrition, the sample of 1,041 children under two included in the study had 84% power to identify the association between an-thropometric deficit according to weight-to-age meas-ure and per capita family income, and 98% power to assess the relationship between height-to-age meas-ure and the number of household appliances. A 0.05 statistical significance level (α) was set.
The 10 municipalities studied were randomly se-lected among those with a population between 10,000 and 15,000 inhabitants, a criterion established to meet procedural requirements of the study. Systematic sam-pling was conducted by conglomerate and in multi-ple stage and all children under five living in the households selected were included in the study.
Anthropometric, socioeconomic, demographic and environment information and data related to fami-lies, mothers and their children were collected by trained interviewers visiting the households.
Stand-*Assis AMO, Barreto ML, Neves RBB, Castro RF, Costa LCC, Mercês CF, et al. Indicadores socioeconômicos no diagnóstico e planejamento em saúde e nutrição. Salvador: UFBa/Escola de Nutrição/Instituto de Saúde Coletiva; 2000.
ard and pre-coded questionnaires were administered to the child’s mother or caregiver.
Weight was measured using a 100-g precision port-able microelectronic scale (Fillizola, Model E-150/ 3P). Height was measured using a wood measure-ment scale for children, especially built for this pur-pose. Measures were taken in duplicate and final measures were estimated as the average of the two measures taken. It was accepted 100-g and 0.1-cm error for weight and height measures, respectively. Measures were taken according to established tech-nical requirements.10 Anthropometric measures such as weight to age and height to age were included as dependent variables. Children whose anthropomet-ric measures (in z-scores) fell below -2 standard de-viations (SD) of the average for the reference popu-lation were classified as malnourished and anthro-pometric measures equal to or above -2 SD were clas-sified as eutrophic.
Variables related to basic determinants of malnutri-tion were as follows: per capita family income, cat-egorized as <0.25 (considered a risk factor), 0.25-0.49, and ≥0.50 minimum wages; household appliances (including the following items: stove, refrigerator, ra-dio, and television set), categorized as 4, 3 and ≤2 (considered a risk factor); maternal schooling, cat-egorized as illiterate (considered a risk factor), el-ementary, middle, high school, and university edu-cation; and maternal occupation, categorized as yes (considered a risk factor) and no (Figure).
Variables related to underlying determinants were designated by the environment index, adapted from Issler & Giugliani9 study, and constructed based on 11 items properly weighed indicating physical and environment conditions of the household and its sur-roundings. The higher the score the better the living environment for a child and his/her family. The envi-ronment index was classified in terciles. As for study-ing the mothers, the selected variables were: number of prenatal visits, categorized as zero, 1-5 and ≥6 (con-sidered a protection factor) (Figure).
Immediate determinants included child-related fac-tors as follows: age, categorized as <6, 6-12 and 12-24 months (higher susceptibility to malnutrition); gender, categorized as male and female (considered a risk factor), birth weight (<2,500 g was considered a risk factor), presence of any health condition in the 15 days prior to the interview (based on mother’s re-porting of diarrhea, fever, vomiting, coughing, loss of appetite, discharge of worms, ear or throat aches and weariness or sadness) and history of hospitaliza-tion in the 12 months prior to the interview (Figure).
Prevalence was used to describe the population ac-cording to relevant variables. Multiple logistic re-gression analysis was conducted to identify determi-nants of malnutrition.
Colinearity was assessed using the variance inflation factor (VIF), and VIF values below 10 indicated no colinearity.8 A significance level of less than 0.05 was established to accept the associations studied.
The model was first constructed including variables related to basic determinants of malnutrition. Those statistically significant (p<0.05) variables were in-cluded as basic determinants and contributed to ad-justing the subsequent blocks of analysis. A second model consisted of variables of underlying causes. First it was constructed a model including all variables of this block. Then those variables showing statistical sig-nificance (p<0.05) were subsequently adjusted to ba-sic determinants. In a third step of the analysis, vari-ables of the immediate determinant block were in-cluded. Those variables statistically signif icant (p<0.05) were then adjusted to basic and underlying determinants and to immediate variables of this block. The variables of each step of the analysis were included in the construction of the final model. It should be noted that the variable child’s gender was not excluded in this step of the analysis though it was not statisti-cally significant (p<0.05) because of its role as a po-tential confounder of the association studied.
Malnutrition
Immediate determinants
Morbidity Reported hospitalizations Birth weight below 2,500 g Children aged between 12 and 24 months
Female child
Underlying determinants
No prenatal visits Inadequate environment index
Basic determinants
Per capita family income below 0.25 minimum wage Up to two appliances in the household
Maternal occupation Maternal illiteracy
Variable H ei ght-to-age W ei ght-to-age
N % OR crude (95% CI) OR crude (95% CI)
Basic causes
Per capita income (MW)
≥0.50 186 54.9 1.0 1.0
0.25-0.49 269 26.0 1.9 (0.8-4.3) 1.1 (0.4-3.2)
<0.25 586 19.1 3.2 (1.6-6.6) 3.4 (1.4-8.2)
Household appliances
4 353 36.0 1.0 1.0
3 270 26.8 2.1 (1.2-3.8) 2.1 (1.0-4.2)
≤2 416 37.2 2.9 (1.7-4.9) 2.6 (1.4-4.8)
M aternal schooling
High school and university 193 19.8 1.0 1.0
Middle school (compl/incompl) 265 27.0 1.4 (0.7-3.0) 1.3 (0.5-3.2) Elementary school (compl/incompl) 467 43.3 2.5 (1.3-4.7) 2.0 (0.9-4.4)
Illiterate 117 9.9 4.2 (2.0-8.9) 4.3 (1.8-10.2)
M aternal job
N o 843 81.4 1.0 1.0
Yes 198 18.6 1.1 (0.7-1.8) 1.9 (0.9-4.0)
U nderlying causes Environment index
Adequate 352 33.9 1.0 1.0
Semi -adequate 353 33.9 1.8 (1.0-3.1) 1.6 (0.8-3.3)
Inadequate 335 32.2 3.0 (1.8-5.0) 3.1 (1.6-5.8)
Prenatal care visits
Yes 780 77.4 1.0 1.0
N o 259 22.6 2.4 (1.6-3.5) 2.6 (1.6-4.3)
Number of prenatal care visits
≥6 355 35.1 1.0 1.0
1–5 397 39.3 2.2 (1.3-3.8) 1.4(0.7-2.7)
N one 259 25.6 3.7(2.1-6.4) 3.1(1.7-5.9)
Immediate causes Health condition*
N o 357 65.6 1.0 1.0
Yes 681 34.4 1.0(0.7-1.6) 2.0(1.1-3.7)
H ospitalization**
N o 896 86.3 1.0 1.0
Yes 142 13.7 2.1(1.2-3.1) 2.0(1.1-3.5)
Birth w eight***
≥2,500 g 897 94.9 1.0 1.0
<2,500 g 44 5.1 3.8(1.8-8.0) 5.0(2.3-11.0)
Age (months)
< 6 256 23.6 1.0 1.0
6| —12 253 24.4 1.1(0.6-2.0) 2.5(0.9-7.2)
12| —| 24 532 5.1 1.7(1.0-2.8) 5.9(2.4-14.5)
Gender
M al e 523 50.2 1.0 1.0
Femal e 518 48.8 0.8 (0.6-1.2) 1.2 (0.74-1.9)
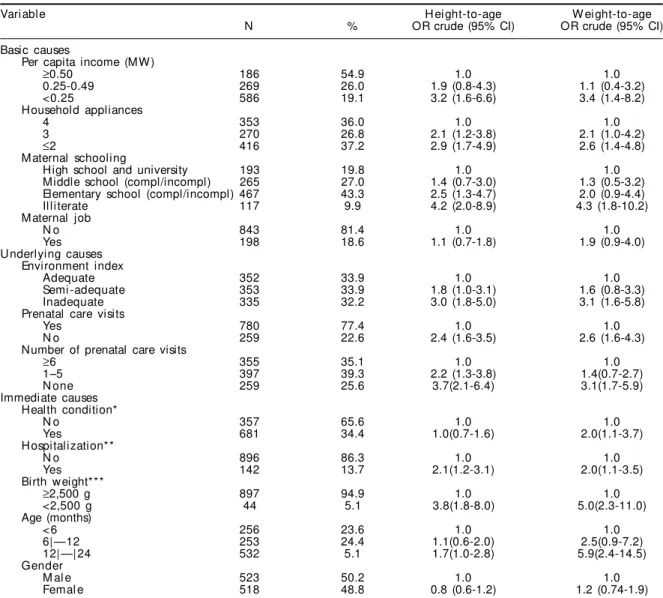
Some variables do not total N=1,041 due to missing information or data inconsistencies. *In the 12 months prior to the study
**In the 15 days prior to the study ***As per mother’s reporting
Table 2 - Crude odds ratio for determinants of height-to-age and w eight-to-age deficits in children under tw o living in municipalities of the state of Bahia. Northeastern Brazil, 1999-2000. (N=1,041)
As a multiple stage design was used in the study, the conglomerate effect on inferences about standard er-ror of estimates was taken into consideration in the statistical analysis.
Data was doubled entered using Epi Info 6.0 software program. Anthropometric status was evaluated using
ANTHRO program. Stata package was used in the analysis as it includes the conglomerate effect on standard error of estimates.
The study ethical appropriateness was approved by the Research Ethics Committee of the Instituto de Saúde Coletiva of Universidade Federal da Bahia. Fol-lowing the ethical principles regulating human re-search, those children diagnosed as malnourished were referred to health services for required medical care.
RESU LTS
The anthropometric status assessment for height-to-age measure indicated that 12.4% of children had deficits below -2 SD of the mean for the reference population. Similarly, the prevalence of the
anthro-Variable N %
H ei ght-to-age
Malnutrition (<-2DP) 132 12.4
Eutrophy (≥-2DP) 909 87.6
W ei ght-to-age
Malnutrition (<-2DP) 81 7.8
Eutrophy (≥-2DP) 960 92.2
pometric deficit for the weight-to-age measure was 7.8% (Table 1).
Simple logistic regression analysis showed that per capita monthly family income below 0.25 minimum wages, a basic determinant of malnutrition, was sig-nificantly associated to height-to-age and weight-to-age deficits compared to a reference of more than 0.5 minimum wages. Increasing statistically signifi-cant associations for both weight-to-age and height-to-age deficits were seen for children living in house-holds with up to three appliances when compared to those living in households with four or more appli-ances. Also, as part of basic determinants, lower ma-ternal schooling was associated to weight and linear growth deficits in the children studied (Table 2).
Of the underlying determinants, inadequate envi-ronment conditions were a limiting factor for weight and linear growth in the children studied. Children whose mothers did not attend prenatal visits were more likely to have height-to-age and weight-to-age deficits when compared to those whose mothers attended prenatal care.
It was also found that children whose mothers did not attend any prenatal visit had higher risk for height-to-age and weight-height-to-age deficits than those whose mothers attended six or more visits (Table 2).
In regard to immediate determinants, having a health
condition in the 15 days prior to the interview was associated to weight-to-age deficit. Reported hospi-talization in the 12 months prior to the interview was associated to weight and height deficit in the chil-dren studied. In this same block, low birth weight was significantly associated to height-to-age and weight-to-age deficits when compared to adequate birth weight. In addition, odds ratio for both height-to-age and weight-to-age deficits were higher in children aged 12-24 months compared to those aged zero to six months (Table 2).
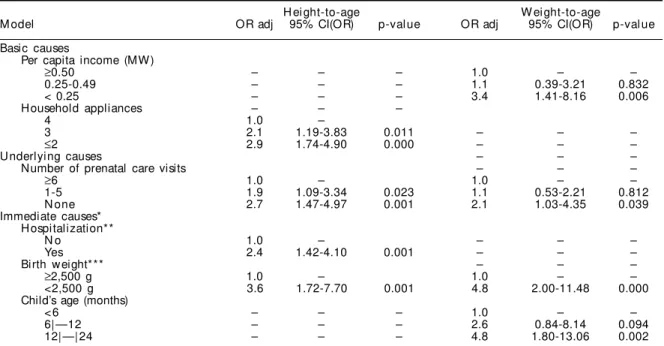
The f inal models including the determinants of height-to-age and weight-to-age deficits are presented in Table 3. The number of appliances in a household, representative of the basic hierarchical level, was found to be associated to linear growth deficit. Chil-dren living in households where there were three ap-pliances were 2.1 (95% CI: 1.19-3.83) more likely to have linear growth deficit; this likelihood increased to 2.9 (95% CI: 1.74-4.90) when the number of appli-ances in a household dropped to two or less (Table 3).
As for the underlying determinants, it was verified that children whose mothers did not attend any pre-natal care visits were 2.7 (95% CI: 1.47-4.97) more likely to have linear growth deficit, and this likeli-hood fell to 1.9 (95% CI:1.09-3.34) when mothers attended one to five visits. Children who were hospi-talized in the 12 months prior to the interview, an immediate determinant, were 2.4 (95% CI: 1.42-4.10)
H ei ght-to-age W ei ght-to-age
M odel OR adj 95% CI(OR) p-val ue OR adj 95% CI(OR) p-val ue
Basic causes
Per capita income (MW)
≥0.50 – – – 1.0 – –
0.25-0.49 – – – 1.1 0.39-3.21 0.832
< 0.25 – – – 3.4 1.41-8.16 0.006
Household appliances – – –
4 1.0 –
3 2.1 1.19-3.83 0.011 – – –
≤2 2.9 1.74-4.90 0.000 – – –
U nderlying causes – – –
Number of prenatal care visits – – –
≥6 1.0 – 1.0 – –
1-5 1.9 1.09-3.34 0.023 1.1 0.53-2.21 0.812
N one 2.7 1.47-4.97 0.001 2.1 1.03-4.35 0.039
Immediate causes* H ospitalization**
N o 1.0 – – – –
Yes 2.4 1.42-4.10 0.001 – – –
Birth w eight*** – – –
≥2,500 g 1.0 – 1.0 – –
<2,500 g 3.6 1.72-7.70 0.001 4.8 2.00-11.48 0.000
Child’s age (months)
< 6 – – – 1.0 – –
6| —12 – – – 2.6 0.84-8.14 0.094
12| —| 24 – – – 4.8 1.80-13.06 0.002
Some variables do not total N=1,041 due to missing information or data inconsistencies. *Adjusted by the variable gender
**In the 12 months prior to the study ***As per mother’s reporting
more likely to have linear growth deficit compared to those who were not hospitalized. Besides, it was found that low birth weight remained highly associ-ated with linear growth deficit (OR=3.6; 95% CI: 1.72-7.70) compared to adequate weight at birth (≥2,500 g) (Table 3).
For assessing weight growth deficit, per capita fam-ily income was included in the final model as a ba-sic determinant. It was noted that weight deficit was 3.4 (95% CI: 1.41-8.16) more likely in children of families with an income below 0.25 minimum wage than in those of families with an income ≥0.5 mini-mum wage.
In the hierarchical block of underlying determinants, children whose mothers did not attend any prenatal care visits were 2.1 (95% CI: 1.03-4.35) more likely to have inadequate weight-to-age compared to chil-dren whose mothers attended six or more visits dur-ing pregnancy (Table 3).
Immediate determinants of children’s weight deficit are birth weight and age ≥12 months. Those with low birth weight were 4.8 (95% CI: 2.00-11.48) more likely to have weight growth deficit compared to those with adequate weight and those having between 12 and 24 months were 4.8 (95% CI:1.80-13.06) more likely to have weight deficit than those under six months of age (Table 3).
D ISCU SSIO N
Growth is a life event highly sensitive to the social, economic, and environment conditions of children and their family, pointing out to the epidemiological relevance of basic determinants in the hierarchical level in determining health and nutritional status during childhood. Poverty, assessed through family income of children participating in the study, was associated to weight-to-age deficit in the first two years of life. Hence, per capita family income below 0.25 minimum wages certainly limits these families’ purchase power and prevents them from meeting their material needs, making children living at this level of poverty highly vulnerable to weight deficits.
This level of family income also reduces their access to household appliances and, thus, explains the asso-ciation found between the number of appliances in a household and children’s height-to-age deficit in this study as well as in other studies.7 The number of ap-pliances in a household may provide a stronger ex-planatory implication for these children’s linear growth deficit than income per se. Having some ap-pliances at home makes a difference to the material
life condition of these children and their families. Therefore, having no appliances or a limited number of appliances at home can limit the maintenance of their hygiene conditions and restrict their access to information, playing an adverse role and compromis-ing health and nutritional status durcompromis-ing childhood.4
Poor life conditions, included in the basic hierarchi-cal level for explaining malnutrition, interact with factors in the underlying level and determine a fami-ly’s ability to use health services available.
This scenario is illustrated by the number of prenatal care visits during pregnancy and having adequate weight-to-age and height-to-age. The interaction re-sulting from these factors is reflected in the immedi-ate determinants and can explain the association found between low birth weight and weight and lin-ear growth deficits. And it reveals that the quality of prenatal care and follow-up provided to the mothers in this study do not incorporate the comprehensive dimensions of care proposed by the Brazilian Minis-try of Health.
Low birth weight seen in the present study (5.1%, Table 2) was lower than that recently found nation-wide (9.2%)16 and similar to that seen in developed countries (5% to 6%).21 However, it is epidemiologi-cally relevant as a strong predictor of post-natal growth, especially because linear growth deficit can arise early in the intrauterine life.3
Also in regard to immediate determinants, it should be underlined the role of prior hospitalization as an adverse factor for adequate linear growth during child-hood. In the first two years of life, children are mostly hospitalized due to infectious diseases, especially diarrhea and respiratory infections. The synergistic effect between malnutrition and infection is trans-lated into the highest disease burden and mortality rates among malnourished children.13 Bearing in mind the potential bidirectionality between disease bur-den and child malnutrition, and also taking into ac-count that the design of the present study does not allow to establishing a relationship between them, the study results indicate that health conditions re-quiring hospitalization prevents adequate linear growth during childhood. Similar findings were re-ported by other authors in cohort studies, a design that is more adequate to explore this relationship.1,17
months of extra-uterine life, among them early wean-ing, inadequate consumption of supplementary food, and low coverage and low quality of public health actions provided to this population.1
Despite anthropometric surveys in Brazil have re-vealed substantial improvement of Brazilian children anthropometric status, such improvement has not been either even or widespread in this population.11 There still can be noted higher weight deficits in pre-school children in the Northern (7.7%) and North-eastern regions (8.3%) than in the Southern region (2%). A similar trend can also be observed for height-to-age deficit in the Northern (16.2%) and Northeast-ern regions (17.9%) compared to that seen in the Southern region (5.1%). Clearly, these higher rates reflect local conditions in these regions, where chil-dren are living in a situation of social and economic insecurity, which is also reflected by their limited chances of survival.19
The hierarchical approach used in the present study is also limited regarding determinants of health events during childhood, since they have different levels of interdependency.15 Yet the study has already incor-porated advances compared to the traditional mod-els of multiple logistic regression analysis. In this context, the study results indicate there are social gaps and heath and nutritional inequalities for most children under two in the municipalities studied. They also evidenced the large gap to be bridged in the quest for social, economic and nutritional security for an expressive share of the Brazilian population, especially those living in the Northeastern region.
Although the statistical model constructed was ad-justed to most factors that could potentially interfere
with the anthropometric status of children studied, the cross-sectional design has intrinsically important limitations. For instance, it does not allow any tem-poral assumptions, which are particularly relevant in determining the length of time of variable exposure on the outcome,14 commonly seen in the study of malnutrition determinants. And so a cross-sectional design does not allow to establish a cause-effect rela-tionship between the events studied but only to ob-serve associations between events. Thus, the positive or negative association seen in the present study should not be understood as a risk or protection fac-tor for malnutrition.
Although the study cross-sectional design has been carefully developed and a robust statistical method has been applied, the results obtained have limited application for children living in municipalities with different social, economic and demographic charac-teristics, where different life conditions favor distinct growth curves during childhood.
Regardless of the study limitations, the study re-sults provoke thought on the concerns of interna-tional organizations to retake the discussion about measuring social and economic inequalities in de-veloping countries and their impacts on health and nutrition.6 In this sense, it should be stressed the need for implementing specif ic action in health and nutrition for preventing malnutrition and re-ducing disease burden during childhood. It is also highlighted the need for interventions targeted to reduce poverty and the gap between the poor and well-off populations, by providing them a level of social and economic security that could culminate in health and nutrition equity for Brazilian chil-dren and their families.
REFEREN CES
1. Black RE, Brown KH, Becker S. Effects of diarrhoea associated with specific enteropathogens on the growth of children in rural Blangladesh. Pediatrics. 1984;73:799-805.
2. Drachler M L, Arsersson M CS, Leite JCC, M arshall T, Aerts DRGC, Freitas PF, et al. Desigualdade social e outros determinantes da altura em crianças: uma análise multinível. Cad Saúde Pública.
2003;19:1815-25.
3. Frongillo Jr EA. Symposium: causes and etiology of stunting. J Nutr. 1999;129(2S Suppl):S529-30. 4. Fundo das Nações Unidas para Infância. Saúde e
nutrição da criança nordestina: pesquisas estaduais, 1987-1992. Brasília (DF); 1995.
5. Fundo das Nações Unidas para Infância. Situação mundial da infância. Desnutrição: causas, conseqü-ências e soluções. Brasília (DF), 1998.
6. Gakidou EE, Murray CJL, Frenk J. Defining and measuring health inequality: an approach based on the distribution of health expectancy. Bull World Health Organ. 2000;78:42-54.
7. Guimarães LV, Latorre MRDO, Barros MBA. Fatores de risco para a ocorrência de déficit estatural em pré-escolares. Cad Saúde Pública. 1999;15:605-15. 8. Hosner DW, Lemeshow S. Applied logistic regression.
Supported by Studies and Projects Financing Agency (FINEP - Process n. 64.96.0564.00); Ministry of Health (MS - Process n. 567/99).
Based on a Master’s dissertation presented at the Federal University of Bahia School of Nutrition, in 2001. 9. Issler RM S, Giugliani ERJ. Identificação de grupos
mais vulneráveis a desnutrição infantil pela medição do nível de pobreza. J Pediatr (Rio de J).
1997;73:101-5.
10. Lohman TG, Roche AF, Martorell R, editors. Anthropometric standardization reference manual. Champaign (IL): Human Kinects Books; 1988. 11. M onteiro CA, Benício M H D, Iunes RF, Gouveia
N C, Cardoso M AA. In: M onteiro CA, organizador. Velhos e novos males da saúde no Brasil: a evolu-ção da desnutrievolu-ção infantil. São Paulo: H ucitec; 1995. p. 93-114.
12. Olinto MTA, Victora CG, Barros FC, Tomasi E. Determinantes da desnutrição infantil em uma população de baixa renda: um modelo hierarquiza-do. Cad Saúde Pública. 1993;9 Supl 1:14-27.
13. Rice AL, Sacco L, Hyder A, Black RR. Malnutrition as an underlying cause of childhood deaths associated with infections diseases in developing countries. Bull Wolrd Health Organ. 2000;78:1207-21.
14. Rothman KJ, Greenland S. Modern epidemiology. Philadelphia (PA): Lippincott-Raven; 1998.
15. Roux AVD. Multilevel analysis in public health. Annu Rev Public Health. 2000;21:171-92.
16. Sociedade Civil Bem-Estar Familiar no Brasil, Progra-ma de Demografia e Saúde. Pesquisa nacional sobre demografia e saúde 1996. 2ª ed. Rio de Janeiro; 1999. 17. Victora CG, Barros FC, Kirkwood BR, Vaughan JP.
Pneumonia, diarrhea and growth in the first 4 y of life: a longitudinal study of 5914 urban Brazilian children. Am J Clin Nutr. 1990;52:391-6.
18. United Nations, Administrative Committee on Coordination/Sub-Committee on Nutrition. Third report on the world nutrition situation. Geneva; 1997. 19. Wagstaff A. Socioeconomic inequalities in child
mortality: comparisons across nine developing countries. Bull World Health Organ. 2000;78:19-28. 20. W aterlow JC. Causes and mechanisms of linear
growth retardation (stunting). Eur J Clin Nutr. 1994;48 Suppl 1:S1-4.