Implicates Salience Processing during a Modified Beads
Task
Christine Esslinger1*¤, Urs Braun1, Frederike Schirmbeck1, Andreia Santos1, Andreas Meyer-Lindenberg1, Mathias Zink1, Peter Kirsch1,2
1Department of Psychiatry and Psychotherapy, Central Institute of Mental Health, Medical Faculty Mannheim, University of Heidelberg, Mannheim, Germany, 2Department of Clinical Psychology, Central Institute of Mental Health, Medical Faculty Mannheim, University of Heidelberg, Mannheim, Germany
Abstract
Introduction:Metacognition, i.e. critically reflecting on and monitoring one’s own reasoning, has been linked behaviorally to the emergence of delusions and is a focus of cognitive therapy in patients with schizophrenia. However, little is known about the neural processing underlying metacognitive function. To address this issue, we studied brain activity during a modified beads task which has been used to measure a ‘‘Jumping to Conclusions’’ (JTC) bias in schizophrenia patients.
Methods:We used functional magnetic resonance imaging to identify neural systems active in twenty-five healthy subjects when solving a modified version of the ‘‘beads task’’, which requires a probabilistic decision after a variable amount of data has been requested by the participants. We assessed brain activation over the duration of a trial and at the time point of decision making.
Results:Analysis of activation during the whole process of probabilistic reasoning showed an extended network including the prefronto-parietal executive functioning network as well as medial parieto-occipital regions. During the decision process alone, activity in midbrain and ventral striatum was detected, as well as in thalamus, medial occipital cortex and anterior insula.
Conclusions:Our data show that probabilistic reasoning shares neural substrates with executive functions. In addition, our finding that brain regions commonly associated with salience processing are active during probabilistic reasoning identifies a candidate mechanism that could underlie the behavioral link between dopamine-dependent aberrant salience and JTC in schizophrenia. Further studies with delusional schizophrenia patients will have to be performed to substantiate this link.
Citation:Esslinger C, Braun U, Schirmbeck F, Santos A, Meyer-Lindenberg A, et al. (2013) Activation of Midbrain and Ventral Striatal Regions Implicates Salience Processing during a Modified Beads Task. PLoS ONE 8(3): e58536. doi:10.1371/journal.pone.0058536
Editor:Ben J. Harrison, The University of Melbourne, Australia
ReceivedMarch 11, 2012;AcceptedFebruary 7, 2013;PublishedMarch 6, 2013
Copyright:ß2013 Esslinger et al. This is an open-access article distributed under the terms of the Creative Commons Attribution License, which permits unrestricted use, distribution, and reproduction in any medium, provided the original author and source are credited.
Funding:C.E. was funded by the Deutsche Forschungsgesellschaft (DFG, http://www.dfg.de, Sonderforschungsbereich (SFB) 636, subproject B7). A.S. was supported by the Fyssen foundation (France www.fondationfyssen.fr). M.Z., A.M.-L., and P.K. were funded by the Deutsche Forschungsgesellschaft (DFG, http:// www.dfg.de, project 1253/3-1). The funders had no role in study design, data collection and analysis, decision to publish, or preparation of the manuscript. Competing Interests:The authors have declared that no competing interests exist.
* E-mail: [email protected]
¤ Current address: Department of Neurology, Otto-von-Guericke-University, Magdeburg, Germany
Introduction
Metacognition, or ‘‘thinking about one’s thinking’’, comprises cognitive processes that monitor and control the subject’s own cognition [1]. In practice, metacognitive capacities involve the ability to select appropriate responses, to appraise and weigh information effectively and to cope with cognitive limitations. Patients with schizophrenia show deficits in several metacognitive abilities, which correlate with psychotic symptoms [2–4], and limited psychosocial function [5,6]. Furthermore, in the last years, several aspects of metacognition have been implemented into therapies for schizophrenia [7]. In this context, a specific probabilistic reasoning bias known as the ‘‘Jumping to Conclu-sions’’ (JTC) bias has been associated to deficits in metacognition. This bias is characterized by the tendency to make hasty decisions and to rapidly accept beliefs, even when there is limited evidence
evaluated in two imaging studies so far [13,14]. The first study [13] reported an involvement of mainly cerebellar, parietal and occipital regions during probabilistic reasoning. However, this study involved only eight healthy subjects and applied a block design, which might not have been sensitive enough to differen-tiate higher metacognitive processes. The authors further used a fixed effect model, precluding generalization of the results. The second study [14] used a modified version of the beads task in the context of reward-related decision making. In this case subjects were able to win money if they chose the correct color and feedback was given after each decision. Behavioral data were investigated by comparing decision making behavior of the participant with that of an ‘‘ideal observer’’ as defined by a Bayesian model. Interestingly, under this reward condition, participants used less draws until decision than predicted by the model which could be described, although not mentioned by the authors, as hasty decision making or JTC bias. Brain imaging data were analyzed using an event related design comparing brain activation during decision with that during preceding draws. This analysis revealed a network comprising parietal, insular, anterior cingulate and striatal regions being more activated during the decision than during preceding draws. However, since jar choices were associated with reward feedback, the activation during decision making cannot be distinguished from reward anticipation processes activating a comparable network [15,16]. Interestingly, when looking for increased activation during draws compared to jar choices, prefrontal (Brodmann Area 6, 8) areas were found. In addition dorsolateral prefrontal activation during decision making was positively correlated with the number of draws implicating more activation in those participants showing less hasty decision making behavior.
In the present study, we designed an fMRI-task on probabilistic reasoning according to the JTC paradigm to unravel its underlying neural networks. We tried to disentangle transient and sustained processes involved in probabilistic reasoning. Therefore we analyzed the task with a mixed model using a block design approach to identify neural networks that are related to the processing and maintaining of information before the participants draw their final conclusion, and applying additional event-related regressors to identify activity during the final evaluation of gathered data that leads to the decision.
It has been proposed that stimuli of the beads task elicit a salience signal [17,18] Salience is meant as the feature of a particular stimulus in the environment that attaches attention, in doing so interrupts other cognitive foci and that potentially provides information to guide adaptive behavior. It has been proposed that such a reallocation of cognitive resources is driven by the ventral striatum and its dopaminergic inputs from midbrain regions [19]. In line with the information integration theory of probabilistic reasoning [20], as well as with the idea of a salience signal being elicited by stimuli in the beads task [17,18], we hypothesize that regions related to salience processing, i.e. the ventral striatum and midbrain areas including the ventral tegmental area, should be activated during the task. This activation was expected to be most prominent during the last critical moments of reasoning just before arriving at a decision.
Methods
1. Ethics Statement
After receiving written and oral instructions of the procedures, participants gave informed written consent. The study was approved by the local ethic committee of the Medical Faculty
Mannheim of the University of Heidelberg (AZ 2009-296N-MA) and performed in accordance with the Declaration of Helsinki.
2. Participants
A group of 26 healthy volunteers (13 women, mean age: 28; range: 21–41 years; all right handed) participated in the study. Participants with neurological or psychiatric illness as well as history of substance dependence except nicotine were excluded. Data of one subject had to be excluded from analysis because of methodological reasons (see below).
3. Experimental Design
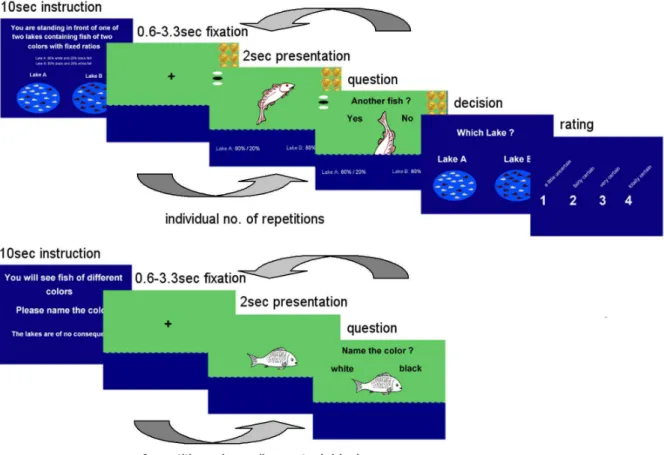
same as in the task block, but subjects only had to indicate the color of the fish and there was no decision and no rating stimulus. The timing of all questions, namely whether the subjects chose another fish or not, the decisions for one or the other lake, the confidence ratings and the questions regarding the color of the control stimuli were self-paced by the subjects, i.e. the questions were presented until the subject pressed a button. To control for block length, the unequal lengths of the experimental blocks due to the different numbers of fish drawn by different subjects and different reaction times were counterbalanced by the number of repetitions of control trials in the following control block. As a result, subjects who drew less fish in the experimental block were presented with more trials in the control block and vice versa. Subjects were not made aware of this manipulation in advance of the experiment, but a monetary incentive was introduced to half of the sample (see below) to make sure that premature decisions made in order to shorten the experiment did not influence the decision process. Altogether, each round consisting of one JTC block and one control block lasted 2.2 minutes, adding up to 17.5 minutes for the whole experiment. JTC blocks lasted on average 16.2 sec (2.1–43.4 sec) and control bocks on average 39.2 sec (9.4–49.5 sec).
Half of the subjects were randomly assigned to a group that completed a monetary incentive version of the paradigm, in which subjects lost 20 cent from a stack of 2 euro for every additionally drawn fish, earning the rest of the money if they chose correctly in the end of a JTC test. No monetary manipulation was included in the control blocks. Neither group received feedback about the correctness of their decisions or the amount of money they won during the scanning session. Figure 1 displays the experimental design.
After scanning, data of one subject (female, 23 years, non monetary incentive version of the task) had to be excluded because she viewed all 10 fish during five of the eight blocks. No other subject decided to view more than nine fish in any block.
4. Data Acquisition and Data Analysis
Blood oxygen level-dependent (BOLD) fMRI was performed on a 3T Siemens Trio by using gradient echo, echo-planar imaging (28 axial slices, coplanar with a line through the anterior and posterior commissures; sequential order of acquisition; 4-mm thickness; 1-mm gap; TR/TE 2,000/28 ms; flip angle 80u; field of view 19.2 cm; matrix 64664). Altogether, 526 scans were acquired
and the first 4 volumes were discarded to account for saturation effects.
FMRI data was analyzed using SPM8 (www.fil.ion.ucl.ac.uk/ spm/software/spm8/). Preprocessing steps included realignment to the first volume to correct for head motion, slice time correction to the middle slice, and normalization to a standard EPI template volume of the Montreal Neurological Institute (MNI) as provided with SPM8. Finally, a 9 mm full-width half-maximum Gaussian filter was applied to smooth the images.
All first level-analyses were performed using the general linear model approach of SPM. Task regressors were folded with SPM’s canonical difference of gammas HRF. Prior to analysis, regressors and data were high pass filtered at 128 s and an autocorrelation model AR(1) was used. Data were analyzed in mixed or hybrid design fashion combining a block design and an event related design within one model [25]. Blocks were defined as starting with the first appearance of a fish stimulus and ending with the last decision about a stimulus in each condition (JTC blocks and control blocks). To further specify the decision process itself, event-related regressors were added to the model. One regressor contained stimulus onsets of all but the last fish and one regressor contained stimulus onsets of all eight last fish of the JTC blocks. Stimulus onsets in the control condition were modeled as regressors of no interest as were the onsets of decision making and confidence ratings. Reaction times to all stimuli were modeled as durations of the events.
Contrast images of task blocks minus control blocks were entered into a second level random effects one-sample T-test to identify general activation associated with the task. Contrast images of all last fish minus all preceding fish were then entered into the same type of second level analysis to identify activation associated with the decision.
In all first-level models, movement parameters from the realignement step of data preprocessing were included as covariates.
To test for the influence of motivation, second level random effects two sample t-tests between the classical and the monetary incentive version were performed with both the block design and the event related first level contrast images. Correlation of brain activation with behavioral measures was studied using random effects second level correlation analyses with the number of fish needed to come to a decision (draws to decision, DTD) and confidence ratings.
For statistical inference, a threshold of p,0.05 with FWE (family wise error) correction for multiple testing across all voxels of the brain was applied. To specifically study activation in the ventral striatum (VS) and ventral tegmental area (VTA), region of interest (ROI) analyses within these regions were performed for all contrasts of interest. Statistical threshold for ROI analyses was p,.05, FWE corrected within a combined mask of VTA and bilateral VS. For VS we used masks from the Harvard-Oxford atlas comprising the right and the left nucleus accumbens, thresholded at a probability of 50% (distributed with the FSL software package; http://fsl.fmrib.ox.ac.uk/fsl/). For the VTA, a region of interest was drawn on MRI-based anatomy of the VTA region using an anatomical atlas [26], see Figure 2. Behavioral data were analyzed using SPSS version 16 (SPSS, Inc., Chicago, Illinois, USA). DTD and confidence ratings were analyzed using two-way ANOVA with the factors task version (classical versus monetary incentive) and block number (1–8).
Results
1. Behavioral Data
Mean DTD was 3.69 (SD = 1.03) and depended significantly on the sequence in which fish were presented (main effect of block Table 1.Sequence of the color of fish in each block.
block
#
1 T T T O T T T T O T
2 T T O T T T T O T T
3 O T T T T O T T T O
4 T T T O T T T T O T
5 T T T T O T T T O T
6 T O T T T T O T T T
7 T T T O T T T T O T
8 O T T T T O T T T O
T = color of the target lake, O = color of the other lake. To introduce variety, colors changed in each block.
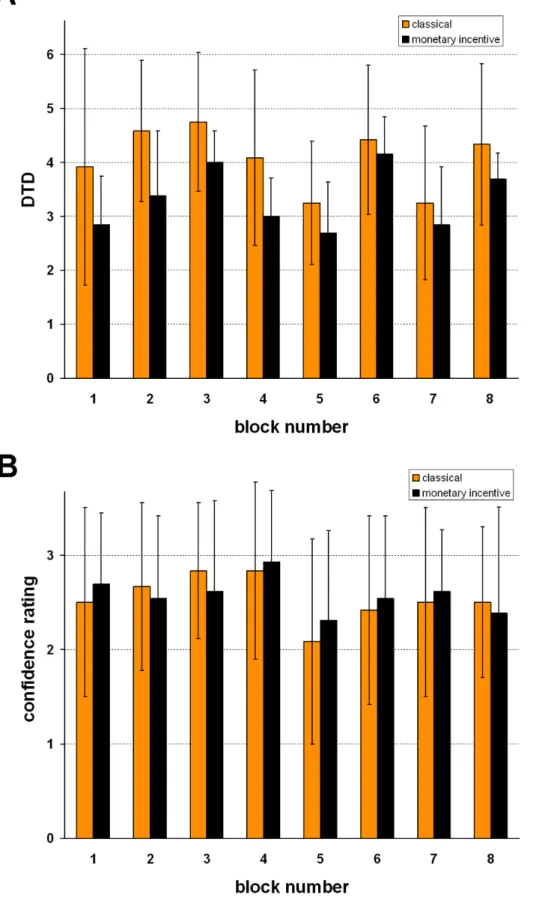
number: F(7,161) = 12.3, p = 3.7E-08). Mean DTD in each block is depicted separately for the classical and the monetary incentive version in Figure 3A.
In the monetary incentive version, in which subjects lost money with each draw, they tended to draw fewer fish (M = 3.33 in the
monetary incentive vs. M = 4.07 in the classical version; main effect of task version: F(1/23) = 3.7, p = .069). The interaction between task version and block number was not found significant. Confidence ratings were on average 2.56 (fairly certain to very certain, SD = 0.63) and did not differ between the task versions Figure 1. Jumping To Conclusions Paradigm, schematic of one of 8 task blocks: The schematic depicts the monetary incentive version where subjects saw the amount of money left for them to win in case they chose the right lake.For more detailed description of the task see the Methods section.
doi:10.1371/journal.pone.0058536.g001
Figure 2. Mask for the ventral tegmental area (VTA): The region of interest was drawn manually on MRI-based anatomy using an anatomical atlas (Duvernoy HM (1995)).
Figure 3. Means and standard deviations. A:Number of fish viewed per block before the decision was taken (draws to decision = DTD).B: Confidence ratings per block. (grey = classical version, black = monetary incentive version of the task).
(M = 2.58 in the monetary incentive vs. M = 2.54 in the classical version, F(1/23) = .002, p = .89). There was a tendency towards different ratings in the different blocks (one way ANOVA including block number as single within-subjects factor: F(7/ 161) = 2.16, p = .065) and no significant interaction between task version (classical/monetary incentive) and block number (see Figure 3B). DTD and confidence ratings did not correlate across blocks or across subjects.
2. Functional Imaging Data
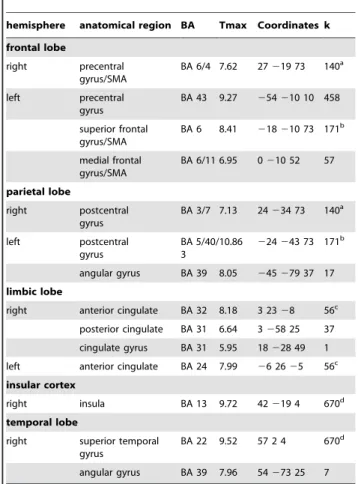
2.1. Activation during the modified beads task versus control condition. Comparisons of the task blocks with the control blocks showed that during the task subjects activated the cerebellum, and superior parietal lobule stronger than during control blocks. In addition, we found significant activation in bilateral dorsolateral prefrontal gyrus, left insula, posterior cingulate, lingual gyrus, fusiform gyrus, supplementary motor area (SMA), bilateral thalamus and right brainstem. (Table 2, Figure 4A). Areas with greater activation in the control task than during the JTC task were right posterior insula (BA13), bilateral pre- and postcentral gyrus and right superior temporal gyrus (BA 22) (Table 3). ROI analyses of activation during the JTC versus the control condition revealed activation in the VTA (peak MNI coordinates [3 225 211], Tmax = 6.20, p = .00014, cluster size = 94). In the comparison classical against the monetary incentive version of the test, no significant activation differences could be detected in whole brain or in ROI analyses.
Correlation analyses revealed one cluster in the left middle temporal gyrus (BA22) that showed increased activation during the JTC task versus the control task with increased confidence rating (MNI coordinates [263222216], Tmax = 6.25, p = .028, cluster size = 9) Activation in no other regions correlated positively or negatively with DTD or confidence ratings as assessed with whole brain or ROI analyses.
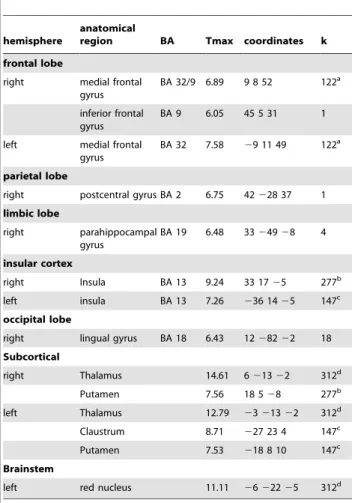
2.2. Activation during the moment of decision making. Comparing all last fish vs. all preceding fish we found significantly increased activation during presentation of the last fish compared to the preceding ones in right ventrolateral prefrontal cortex, right parahippocampal gyrus, lingual gyrus, bilateral putamen, bilateral thalamus and bilateral insula and left brainstem (Table 4, Figure 4B). ROI analyses showed activation in the VTA ([6 213 25], Tmax = 10.5, p = 3.8E-8, cluster size = 129) and right VS ([12 828], Tmax = 4.23, p = .01, cluster size = 4). No significant activation in grey matter in the opposite contrast: all previous.last stimulus was revealed in the whole brain or the ROI analyses.
When testing this contrast in the monetary incentive versus the standard version, neither whole brain analysis nor ROI analysis revealed any significant differences between conditions.
To determine whether activation during presentation of the last versus all previous fish depended on the number of fish drawn (DTD) or on confidence of the subsequent decisions, we performed voxelwise correlation analyses of activation in the contrast last versus all previous fish with mean DTD and mean confidence ratings over the 8 blocks. None of the analyses showed correlation between brain activation and DTD or confidence ratings at an FWE corrected significance level for the whole brain or within the ROIs.
Discussion
We investigated the neural networks involved in decision making under uncertainty during the so-called ‘‘Jumping to Conclusions’’ (JTC) paradigm. Functional imaging showed an
extended executive cognition network of sustained activation during reasoning, while ventral striatal regions, which have been associated with saliency [27–29], were activated more strongly during the final stage of the particular decision as compared to its initiation.
In a behavioral perspective, participants asked for a comparable amount of evidence before coming to a conclusion to what has been observed in healthy subjects in previous studies [10,21,30]. As expected, DTD depended strongly on the order of stimulus presentation. There was a trend towards fewer DTD in the monetary incentive version possibly due to the fact that subjects had to ‘‘pay’’ for each additional fish drawn, but the difference to subjects performing the classical version of the test was not significant. Together with the absence of group differences in confidence ratings, this pattern of performance supports the assumption that subjects did not ‘‘jump to conclusions’’ out of lack of motivation and to shorten the experiment. Furthermore, it may indicate that incentive motivation contributes only marginally to the activation patterns.
The task-specific recruitment of neural structures involved an extended network associated with executive functioning: right ventrolateral and bilateral dorsolateral prefrontal cortex, superior and inferior parietal lobule and precuneus, premotor regions and pre-SMA [31] Although it cannot be excluded that the network activated also reflects other processes that differ between the beads task and the control task but is independent of the decision making process (e.g. increased visual processing of additional information, increased attentional demands or reading of the lake proportions etc. ), it is interesting that these regions were also found to be involved in the rewarded beads task used by Furl and Averbek [14]. However some of these regions (ventrolateral prefrontal cortex, precuneus, pre–SMA were found to be more activated during draws than during decision in this study while others were found to be more activated during decision (posterior regions, insula). In addition, we confirmed activation in regions previously described by Blackwood and colleagues [13], medial occipital cortex and cerebellum. This previous study might have masked activation in the executive functioning network, in particular the DLPFC, because of differences in the control condition, where Blackwood and colleagues required participants to monitor the frequencies of stimuli and remember them during the whole block. This introduced a working memory component not present in our control condition which was to reach a decision under certainty (color of each stimulus) after each stimulus separately. Even if all information about previously collected data is visible at all times during the reasoning process, our data therefore support executive functions and working memory as a core component of this specific probabilistic reasoning test. The fact that none of these main regions of the executive functioning network were differen-tially activated at the time of the last versus all other stimuli indicates that executive control is required throughout the process of reaching a decision. Our findings show that differentiating between sustained and transient processes during the beads reveals an important network involved in the problem solving part of the task which cannot be clearly assigned to a particular process when using a block or event related design exclusively.
in reward related brain regions such as ventral striatum and orbitofrontal cortex in the monetary incentive versus the nonincentive version of the task [14]. The reason why we did not see such activation might be that participants did not receive feedback regarding the correctness of their decisions and therefore did not experience anticipation of reward during the presentation of task stimuli. In addition, differences might be covered by the reduced group size. Therefore it might have been preferable to expose all subjects to all conditions in a fully factorized design increasing the chance to detect effects of this manipulation.
In our second analysis, aimed at investigating activation at the moment of decision making, we found activation in structures linked to salience and dopaminergic neurotransmission nicely replicating the findings reported by Furls and Averbek using their
rewarded version of the beads task [14]. Regions that were more activated during the last stimulus that led to a decision compared to all preceding stimuli were bilateral striatum and midbrain including the ventral tegmental area, brain areas that are reliably activated in salience processing [27,29,32–35]. This finding is in line with our hypothesis that salience processing might play a prominent role in decisions under uncertainty. The ventral striatal regions found here, were not only associated with salience but also with other processes like reward anticipation 1(e.g. [15,16]). However, since we could not find differences between our rewarded and our unrewarded version in these regions, we conclude that the increased activation to the last fish is mainly driven by the acquired salience of this stimulus rather than its rewarding value. This conclusion is also in accordance with studies Figure 4. Brain activation. A:during Jumping to Conclusions (JTC) versus control blocks.B:at the time of last stimuli versus all preceding stimuli (event related regressors). Statistical significance family wise error (FWE) corrected: p,.05, cluster size.= 10 contiguous voxels).
demonstrating the modulation of ventral striatal activation by salience, even in the context of monetary reward [33] or aversive context conditioning [28].
Additionally, we found right VLPFC, pre-SMA, bilateral insula, medial occipital regions and bilateral thalamus to be transiently active. Interestingly and further supporting our conclusion of the role of saliency in our task, anterior insula is also implicated in the salience network [36], and seems to play a role in encoding uncertainty [37,38]. Thalamic, especially medial regions (dorso-medial nucleus) have tight connections with prefrontal cortex and are relevant for the dopaminergic control of processing of sensory information [39].
Taken together, the increased activation in brain regions known to support dopaminergic and salience related cognitive functions, we speculate that the last fish before decision might constitute a highly salient signal with a marked subjective importance attributed to the provided color information, which would then ultimately trigger the a response to stop gathering evidence an come to a conclusion. In contrast, the block design analysis would capture activation related to the preparation of the decision during the whole block by a more cognitive process that recruits the executive functions network. The decision for on or the other lake would then not exclusively be based on ongoing cognitive calculations of probabilities as represented by prefrontal activa-tion, but would at least partly be driven by a salience signal from the ventral striatum preceding the actual decision.
Menon and colleagues [17] failed to see the typical behavioral JTC response pattern in schizophrenia patients in a version of the task where they showed a memory aid and postulated a possible influence of memory load on the distortion of the stimulus salience, although other authors have seen JTC bias even with no memory load [23,24]. Here, he we found salience regions clearly activated at decisions without memory load. We found no significant correlations between brain activation and probabilistic reasoning styles, assessed by numbers of stimuli viewed before reaching a decision (DTD) and confidence ratings. Again this might be Table 2.Activation and deactivation during JTC versus
control blocks: JTC.control.
hemisphere
anatomical
region BA Tmax Coordinates k
frontal lobe
right middle frontal gyrus
BA 11/6 10.79 24 47211 1535a
inferior frontal gyrus
BA 47 10.17 30 2625 1535a
med. frontal gyrus/SMA
BA 6/8 9.57 6 32 43 236
left inferior frontal gyrus
BA 47 10.43 230 2025 91b
precentral gyrus
BA 9 8.58 242 5 34 132c
middle frontal gyrus/SMA
BA 6/11 /10/9
7.91 245 8 52 132c
insular cortex
left insula BA 13 7.58 233 17 7 91b
limbic lobe
right cingulate gyrus BA 23 7.47 6225 31 29 temporal lobe
right fusiform gyrus BA 37 15.24 3625828 6658d parietal lobe
right superior parietal lobule
BA 7 15.62 27267 52 6658d
occipital lobe
left lingual gyrus BA 19 14.44 23326428 6658d Cerebellum
right cerebellar tonsil 6.20 27240247 2 inferior semi-lunar
lobule
6.42 36264250 11
left cerebellar tonsil 6.58 221237
250 6
culmen 6.11 26228217 5
Subcortical
right thalamus 7.76 2722822 26
left thalamus 7.24 22723122 19
Brainstem
right red nucleus 6.72 6225214 14
Significance threshold: p,.05, FWE (family wise error) corrected for the whole brain. BA = Brodmann area, Tmax = maximal t-value in the cluster,
coordinates = MNI (Montreal Neurological Institute) coordinates of the peak voxel in the cluster. k = cluster-size, superscript letters indicate joint clusters. doi:10.1371/journal.pone.0058536.t002
Table 3.Activation and deactivation during JTC versus control blocks: control.JTC.
hemisphere anatomical region BA Tmax Coordinates k
frontal lobe
right precentral gyrus/SMA
BA 6/4 7.62 27219 73 140a
left precentral gyrus
BA 43 9.27 254210 10 458
superior frontal gyrus/SMA
BA 6 8.41 218210 73 171b
medial frontal gyrus/SMA
BA 6/11 6.95 0210 52 57
parietal lobe
right postcentral gyrus
BA 3/7 7.13 24234 73 140a
left postcentral gyrus
BA 5/40/ 3
10.86 224243 73 171b
angular gyrus BA 39 8.05 245279 37 17 limbic lobe
right anterior cingulate BA 32 8.18 3 2328 56c posterior cingulate BA 31 6.64 3258 25 37 cingulate gyrus BA 31 5.95 18228 49 1 left anterior cingulate BA 24 7.99 26 2625 56c insular cortex
right insula BA 13 9.72 42219 4 670d
temporal lobe
right superior temporal gyrus
BA 22 9.52 57 2 4 670d
angular gyrus BA 39 7.96 54273 25 7
Significance threshold: p,.05, FWE (family wise error) corrected for the whole brain. BA = Brodmann area, Tmax = maximal t-value in the cluster,
because we studied only healthy subjects without a broad enough range of behavioral differences.
When comparing the two versions of the task in the event-related analysis, we found more activation in the VTA in the classical version. Because at the moment of decision, the participants did not receive feedback about whether they actually gained or lost money, it cannot be excluded that this finding reflects relatively reduced importance of the salience system at the moment of decision in the monetary incentive version because of a
sustained elevated level of reward-related activation of this system during the whole block of the JTC condition.
Our data show that, at least in healthy individuals, the JTC test activates regions implicated in salience processing and might provide a neural mechanism that could form a link between aberrant salience processing and the formation of metacognitive biases such as the JTC bias [17,18]. To speculate further, aberrant and untimely spiking dopaminergic neurons might be a neurobi-ological correlate of false attribution of salience to stimuli relevant for decisions. In schizophrenia, because the dopamine system is dysregulated [40], this process might be chaotically upregulated which could be inferred from the altered activation of the dopaminergic midbrain and striatum during reward learning found in psychosis [41], and which might explain both the tendency for JTC and the marked heterogeneity of patients’ performance in the JTC test.
Our data leave the question open whether the metacognitive bias in JTC is a cognitive link from aberrant salience processing in schizophrenia to delusion formation [42–44]. Behavioral evidence showing higher rates of JTC bias in delusional schizophrenia patients than in patients without delusions [23,45] indicate that delusions and the JTC bias share variance. In addition, since our block design analysis found a tonic activation of prefrontal cortex during the decision process, it is possible that impairments in executive functioning and working memory, commonly found in schizophrenia, contribute to the JTC bias in this disorder, either independently or interacting with aberrant salience processing. Behaviorally, it has been shown that the JTC bias in schizophrenia is related to, but not completely dependent on, executive functioning, in particular mental flexibility [21,46,47]. To test these relationships, additional studies with schizophrenia patients before and during antipsychotic treatment will have to be performed. The proposed mechanism might be specifically important in at-risk-mental states (ARMS), when first delusional symptoms are reported. The JTC neuroimaging paradigm and the differentiated analysis reported here should be an appropriate experimental approach to further our knowledge about the neurobiological underpinnings of this specific metacognitive deficit in schizophrenia.
Acknowledgments
We are grateful to all participants, to Steffen Moritz for his valuable help in designing the JTC paradigm and to Dagmar Gass for help with data acquisition.
Author Contributions
Revised the article critically for important intellectual content: AS AML. Contributed in the interpretation of the data: FS AML MZ. Conceived and designed the experiments: CE MZ PK. Performed the experiments: UB AS. Analyzed the data: CE UB PK. Wrote the paper: CE UB MZ PK.
References
1. Flavell JH (1970) Developmental studies of mediated memory. Advances in Child Development and Behavior 5: 181–211.
2. Baker CA, Morrison AP (1998) Cognitive processes in auditory hallucinations: attributional biases and metacognition. Psychological Medicine 28: 1199–1208. 3. Moritz S, Woodward TS (2006) Metacognitive control over false memories: a key determinant of delusional thinking. Current Psychiatry Reports 8: 184–190. 4. Bell V, Halligan PW, Ellis HD (2006) Explaining delusions: a cognitive
perspective. Trends in Cognitive Sciences 10: 219–226.
5. Lysaker PH, Dimaggio G, Carcione A, Procacci M, Buck KD, et al. (2009) Metacognition and schizophrenia: The capacity for self-reflectivity as a predictor for prospective assessments of work performance over six months. Schizophrenia Research.
6. Stratta P, Daneluzzo E, Riccardi I, Bustini M, Rossi A (2009) Metacognitive ability and social functioning are related in persons with schizophrenic disorder. Schizophrenia Research 108: 301–302.
7. Moritz S, Woodward TS (2007) Metacognitive training in schizophrenia: from basic research to knowledge translation and intervention. Current Opinion in Psychiatry 20: 619–625.
8. Ziegler M, Rief W, Werner SM, Mehl S, Lincoln TM (2008) Hasty decision-making in a variety of tasks: does it contribute to the development of delusions? Psychology and Psychotherapy: Theory, Research and Practice 81: 237–245. 9. Hemsley DR, Garety PA (1986) The formation of maintenance of delusions: a
Bayesian analysis. British Journal of Psychiatry 149: 51–56.
10. Huq SF, Garety PA, Hemsley DR (1988) Probabilistic judgements in deluded and non-deluded subjects. Quarterly Journal of Experimental Psychology A, Human Experimental Psychology 40: 801–812.
Table 4.Activation during presentation of the last versus all preceding fish (event related regressors): last.preceding fish.
hemisphere
anatomical
region BA Tmax coordinates k
frontal lobe
right medial frontal gyrus
BA 32/9 6.89 9 8 52 122a
inferior frontal gyrus
BA 9 6.05 45 5 31 1
left medial frontal gyrus
BA 32 7.58 29 11 49 122a
parietal lobe
right postcentral gyrus BA 2 6.75 42228 37 1 limbic lobe
right parahippocampal gyrus
BA 19 6.48 3324928 4
insular cortex
right Insula BA 13 9.24 33 1725 277b
left insula BA 13 7.26 236 1425 147c occipital lobe
right lingual gyrus BA 18 6.43 1228222 18 Subcortical
right Thalamus 14.61 621322 312d
Putamen 7.56 18 528 277b
left Thalamus 12.79 2321322 312d
Claustrum 8.71 227 23 4 147c
Putamen 7.53 218 8 10 147c
Brainstem
left red nucleus 11.11 2622225 312d
Significance threshold: p,.05, FWE (family wise error) corrected for the whole brain. BA = Brodmann area, Tmax = maximal t-value in the cluster,
11. Buck KD, Warman DM, Huddy V, Lysaker PH (2012) The Relationship of Metacognition with Jumping to Conclusions among Persons with Schizophrenia Spectrum Disorders. Psychopathology.45: 271–275.
12. Moritz S, Woodward T, Burlon M, Braus D, Andresen B (2007) Attributional Style in Schizophrenia: Evidence for a Decreased Sense of Self-Causation in Currently Paranoid Patients. Cognitive Therapy and Research 31: 371–383. 13. Blackwood N, Ffytche D, Simmons A, Bentall R, Murray R, et al. (2004) The
cerebellum and decision making under uncertainty. Brain Research Cognitive Brain Research 20: 46–53.
14. Furl N, Averbeck BB (2011) Parietal cortex and insula relate to evidence seeking relevant to reward-related decisions. The Journal of Neuroscience 31: 17572– 17582.
15. Kirsch P, Schienle A, Stark R, Sammer G, Blecker C, et al. (2003) Anticipation of reward in a nonaversive differential conditioning paradigm and the brain reward system: an event-related fMRI study. Neuroimage 20: 1086–1095. 16. Knutson B, Adams CM, Fong GW, Hommer D (2001) Anticipation of
increasing monetary reward selectively recruits nucleus accumbens. The Journal of Neuroscience 21: RC159.
17. Menon M, Pomarol-Clotet E, McKenna PJ, McCarthy RA (2006) Probabilistic reasoning in schizophrenia: a comparison of the performance of deluded and nondeluded schizophrenic patients and exploration of possible cognitive underpinnings. Cognitive Neuropsychiatry 11: 521–536.
18. Speechley WJ, Whitman JC, Woodward TS (2010) The contribution of hypersalience to the ‘‘jumping to conclusions’’ bias associated with delusions in schizophrenia. Journal of Psychiatry & Neuroscience 35: 7–17.
19. Redgrave P, Prescott TJ, Gurney K (1999) Is the short-latency dopamine response too short to signal reward error? Trends Neurosci 22: 146–151. 20. Fine C, Gardner M, Craigie J, Gold I (2007) Hopping, skipping or jumping to
conclusions? Clarifying the role of the JTC bias in delusions. Cognitive Neuropsychiatry 12: 46–77.
21. Lincoln TM, Lange J, Burau J, Exner C, Moritz S (2010) The effect of state anxiety on paranoid ideation and jumping to conclusions. An experimental investigation. Schizophrenia Bulletin 36: 1140–1148.
22. Woodward TS, Munz M, LeClerc C, Lecomte T (2009) Change in delusions is associated with change in ‘‘jumping to conclusions’’. Psychiatry Research 170: 124–127.
23. Moritz S, Woodward TS (2005) Jumping to conclusions in delusional and non-delusional schizophrenic patients. British Journal of Clinical Psychology 44: 193–207.
24. Dudley RE, John CH, Young AW, Over DE (1997) Normal and abnormal reasoning in people with delusions. British Journal of Clinical Psychology 36 (Pt 2): 243–258.
25. Visscher KM, Miezin FM, Kelly JE, Buckner RL, Donaldson DI, et al. (2003) Mixed blocked/event-related designs separate transient and sustained activity in fMRI. Neuroimage 19: 1694–1708.
26. Duvernoy HM (1995) The Human Brainstem and Cerebellum. Surface, Structure, Vascularization and Three Dimensional Sectional Anatomy with MRI. Wien, New York: Springer-Verlag.
27. Jensen J, Smith AJ, Willeit M, Crawley AP, Mikulis DJ, et al. (2007) Separate brain regions code for salience vs. valence during reward prediction in humans. Human Brain Mapping 28: 294–302.
28. Pohlack ST, Nees F, Ruttorf M, Schad LR, Flor H (2012) Activation of the ventral striatum during aversive contextual conditioning in humans. Biol Psychol 91: 74–80.
29. Zink CF, Pagnoni G, Chappelow J, Martin-Skurski M, Berns GS (2006) Human striatal activation reflects degree of stimulus saliency. Neuroimage 29: 977–983. 30. Averbeck BB, Evans S, Chouhan V, Bristow E, Shergill SS (2011) Probabilistic learning and inference in schizophrenia. Schizophrenia Research 127: 115–122. 31. Owen AM, McMillan KM, Laird AR, Bullmore E (2005) N-back working memory paradigm: a meta-analysis of normative functional neuroimaging studies. Human Brain Mapping 25: 46–59.
32. Phan KL, Taylor SF, Welsh RC, Ho SH, Britton JC, et al. (2004) Neural correlates of individual ratings of emotional salience: a trial-related fMRI study. Neuroimage 21: 768–780.
33. Zink CF, Pagnoni G, Martin-Skurski ME, Chappelow JC, Berns GS (2004) Human striatal responses to monetary reward depend on saliency. Neuron 42: 509–517.
34. Zink CF, Pagnoni G, Martin ME, Dhamala M, Berns GS (2003) Human striatal response to salient nonrewarding stimuli. The Journal of Neuroscience 23: 8092–8097.
35. Guitart-Masip M, Bunzeck N, Stephan KE, Dolan RJ, Duzel E (2010) Contextual novelty changes reward representations in the striatum. The Journal of Neuroscience 30: 1721–1726.
36. Seeley WW, Menon V, Schatzberg AF, Keller J, Glover GH, et al. (2007) Dissociable intrinsic connectivity networks for salience processing and executive control. The Journal of Neuroscience 27: 2349–2356.
37. Preuschoff K, Quartz SR, Bossaerts P (2008) Human insula activation reflects risk prediction errors as well as risk. The Journal of Neuroscience 28: 2745– 2752.
38. Singer T, Critchley HD, Preuschoff K (2009) A common role of insula in feelings, empathy and uncertainty. Trends in Cognitive Sciences 13: 334–340. 39. Haber SN, Calzavara R (2009) The cortico-basal ganglia integrative network:
the role of the thalamus. Brain Research Bulletin 78: 69–74.
40. Meyer-Lindenberg A, Miletich RS, Kohn PD, Esposito G, Carson RE, et al. (2002) Reduced prefrontal activity predicts exaggerated striatal dopaminergic function in schizophrenia. Nature Neuroscience 5: 267–271.
41. Murray GK, Corlett PR, Clark L, Pessiglione M, Blackwell AD, et al. (2008) Substantia nigra/ventral tegmental reward prediction error disruption in psychosis. Molecular Psychiatry 13: 239, 267–276.
42. Jensen J, Kapur S (2009) Salience and psychosis: moving from theory to practise. Psychological Medicine 39: 197–198.
43. Kapur S (2003) Psychosis as a state of aberrant salience: a framework linking biology, phenomenology, and pharmacology in schizophrenia. American Journal of Psychiatry 160: 13–23.
44. Kapur S, Mizrahi R, Li M (2005) From dopamine to salience to psychosis– linking biology, pharmacology and phenomenology of psychosis. Schizophrenia Research 79: 59–68.
45. Garety PA, Freeman D, Jolley S, Dunn G, Bebbington PE, et al. (2005) Reasoning, emotions, and delusional conviction in psychosis. Journal of Abnormal Psychology 114: 373–384.
46. Lysaker PH, Warman DM, Dimaggio G, Procacci M, Larocco VA, et al. (2008) Metacognition in schizophrenia: associations with multiple assessments of executive function. Journal of Nervous and Mental Disease 196: 384–389. 47. Woodward TS, Mizrahi R, Menon M, Christensen BK (2009) Correspondences