BGD
3, 449–474, 2006Ammonium photoproduction
V. Kitidis et al.
Title Page
Abstract Introduction
Conclusions References
Tables Figures
◭ ◮
◭ ◮
Back Close
Full Screen / Esc
Printer-friendly Version
Interactive Discussion
EGU
Biogeosciences Discuss., 3, 449–474, 2006 www.biogeosciences-discuss.net/3/449/2006/ © Author(s) 2006. This work is licensed under a Creative Commons License.
Biogeosciences Discussions
Biogeosciences Discussionsis the access reviewed discussion forum ofBiogeosciences
Photochemical production of ammonium
in the oligotrophic Cyprus Gyre (Eastern
Mediterranean)
V. Kitidis1,2, G. Uher1, R. C. Upstill-Goddard1, R. F. C. Mantoura2,*, G. Spyres2, and E. M. S. Woodward2
1
Ocean Research Group, School of Marine Science and Technology, University of Newcastle upon Tyne, Newcastle upon Tyne, NE7 7RU, UK
2
Plymouth Marine Laboratory, Plymouth, PL1 3DH, UK
*
now at: International Atomic Energy Authority Marine Ecology Laboratory, Monaco
BGD
3, 449–474, 2006Ammonium photoproduction
V. Kitidis et al.
Title Page
Abstract Introduction
Conclusions References
Tables Figures
◭ ◮
◭ ◮
Back Close
Full Screen / Esc
Printer-friendly Version
Interactive Discussion
EGU Abstract
We investigated the photoproduction of ammonium (NH+4) in surface waters of the Cyprus gyre in the central Eastern Mediterranean in May 2002, in 8 on deck irradiations with freshly collected, filtered samples. NH+4 photoproduction (photoammonification) increased with time-integrated irradiance during the course of irradiations.
Photoam-5
monification rates around local noon were 0.4–2.9 nmol L−1h−1. Normalised to time integrated irradiance, these rates were 0.9–3.8 pmol L−1h−1/(W m−2) and were signif-icantly correlated with Chromophoric Dissolved Organic Matter (CDOM) absorbance at 300 nm normalised to Dissolved Organic Carbon (DOC). These results are consis-tent with the notion that successive CDOM photobleaching in the surface mixed layer
10
results in decreased DOC-normalised light absorbance concurrent with decreased dis-solved organic matter reactivity with regard to photochemical NH+4 release. Combin-ing our experimental data with estimates of annual solar irradiance and water column light attenuation yields an annual photoammonification rate for the Cyprus Gyre of 40±17 mmol m−2a−1, equivalent to∼12±5% of the previously estimated annual
nitro-15
gen requirement of new production in this region. Based on this analysis, NH+4 pho-toproduction makes a small, but significant contribution to the nitrogen budget of the euphotic zone in the oligotrophic Cyprus Gyre.
1 Introduction
Photoproduction of ammonium (NH+4) via the photodegradation of chromophoric
dis-20
solved organic matter (CDOM) can significantly modify the inorganic nutrient budgets of aquatic ecosystems (Bushaw et al., 1996). However, recent evidence indicates that the impacts of photochemical NH+4 release may vary considerably between distinct biogeo-graphic settings. Bushaw et al. (1996) estimated photoproduction of NH+4 (photoam-monification) on the Southeastern US continental shelf to contribute an additional 20%
25
BGD
3, 449–474, 2006Ammonium photoproduction
V. Kitidis et al.
Title Page
Abstract Introduction
Conclusions References
Tables Figures
◭ ◮
◭ ◮
Back Close
Full Screen / Esc
Printer-friendly Version
Interactive Discussion
EGU
the contribution of NH+4 photoproduction to the phytoplankton nitrogen (N) demand of the eastern Caribbean Sea at∼50%. In contrast, Buffam and McGlathery (2003) found that the contribution of photoammonification to the N sources of a coastal lagoon was small compared to other inputs. These observations seem to suggest that the potential impact of photoammonification is highest in shelf waters and marginal seas. However,
5
the role of photochemistry in open ocean nutrient budgets has received little attention, even though NH+4 photoproduction may represent a significant source of N for primary producers in N-depleted surface waters of the open ocean.
Recent work provides growing evidence for significant photoammonification rates particularly in inland, estuarine and coastal waters with elevated DOM levels.
Photoam-10
monification rates of up to 220 nmol L−1h−1 were observed in estuarine and coastal seawater (Bushaw et al., 1996; Gardner et al., 1998; Bushaw-Newton and Moran, 1999; Morell and Corredor, 2001; Koopmans and Bronk, 2002; Buffam and McGlathery, 2003), while rates of up to 4700 nmol L−1h−1 (corrected for dilution during ultrafiltra-tion), were observed in freshwaters (Bushaw et al., 1996; Gao and Zepp, 1998; Wang
15
et al., 2000; Koopmans and Bronk, 2002; Buffam and McGlathery, 2003; V ¨ah ¨atalo et al., 2003). In addition to ammonium, photoproduction of nitrite (NO−2) and low molec-ular weight organic nitrogen compounds such as dissolved primary amines and dis-solved free amino acids were also observed (Spokes and Liss, 1996; Bushaw-Newton and Moran, 1999; Kieber et al., 1999; Tarr et al., 2001; Wiegner and Seitzinger, 2001;
20
Koopmans and Bronk, 2002; Buffam and McGlathery, 2003). However, the associated photoproduction rates of these N compounds are generally one order of magnitude lower than corresponding rates of photoammonification. Net NH+4 photoproduction is nevertheless not ubiquitous. Several studies were unable to detect photoammonifica-tion during irradiaphotoammonifica-tions of lake and river waters (Jørgensen et al., 1998; Bertilsson et
25
al., 1999; Wiegner and Seitzinger, 2001). Photoammonification rates must therefore be considered in their regional context and in comparison with other N sources in order to asses their importance.
BGD
3, 449–474, 2006Ammonium photoproduction
V. Kitidis et al.
Title Page
Abstract Introduction
Conclusions References
Tables Figures
◭ ◮
◭ ◮
Back Close
Full Screen / Esc
Printer-friendly Version
Interactive Discussion
EGU
as compared to low or undetectable rates in others most likely reflect not only regional variability in DOM reactivity, but also the effects of various environmental controls that are not well understood. For example, Wang et al. (2000) report pH control of pho-toammonification in river and estuarine waters, and Gao and Zepp (1998) observed that the presence of dissolved iron (Fe) enhanced photoammonification rates in river
5
water. Net photochemical uptake of NH+4 by DOM has also been observed both in C18 extracted dissolved organic matter (DOM) of marine- (Kieber et al., 1997) and in filtered brackish- (Gardner et al., 1998) and ground-waters (Koopmans and Bronk, 2002). Additional controls of photoammonification suggested in published work include intrinsic DOM properties, ambient oxygen levels, and prior radiation exposure
(Koop-10
mans and Bronk, 2002; Buffam and McGlathery, 2003). While some of the variability in photochemical NH+4 production rates may be plausibly explained by combinations of these aforementioned controls, regional extrapolations of NH+4 photoproduction re-mains challenging, nonetheless because of significant gaps in data coverage.
Currently published data on photoammonification are heavily biased towards
fresh-15
water, estuarine and coastal studies and consequently data from open ocean areas characterised by low ambient inorganic N levels under stratified conditions are lack-ing. To our knowledge there exists only one report of oceanic photoammonification rates from the Eastern Tropical Pacific (Bronk, 2002). Although the rates reported by Bronk (2002) indicate a potentially important role for this process in the open ocean,
20
they are lacking further information such as details on local hydrography, productivity regime, and CDOM, which are needed to assess their potential importance. Additional oceanic estimates are therefore required, especially in view of the difficulties associ-ated with extrapolating data from freshwaters or coastal seas, such as the possibility of photoammonification inhibition at typical seawater pH (Buffam and McGlathery, 2003),
25
and modification of the photoammonification potential of CDOM through prior radiation exposure in clear open ocean waters.
ambi-BGD
3, 449–474, 2006Ammonium photoproduction
V. Kitidis et al.
Title Page
Abstract Introduction
Conclusions References
Tables Figures
◭ ◮
◭ ◮
Back Close
Full Screen / Esc
Printer-friendly Version
Interactive Discussion
EGU
ent inorganic N levels, typical of oligotrophic waters (Rees and Woodward, 1999) and unique in showing proximate P-limitation (Krom et al., 1991, 1992, 2004). Recent work in the Cyprus Gyre of the central Eastern Mediterranean has shown that while the het-erotrophic microbial community remains P limited during summer, phytoplankton are N and P co-limited (Krom et al., 2005a; Thingstad et al., 2005). Hence photoproduction
5
of N in the Eastern Mediterranean could have significant implications for regional net productivity.
In this study we conducted a series of sunlight irradiations in surface waters of the Cyprus Gyre. We determined photoproduction rates of NH4and combined these with
estimates of annual solar irradiance and light attenuation in order to assess the
photo-10
chemical contribution to the annual nutrient budget of this region.
2 Methods
2.1 Study area
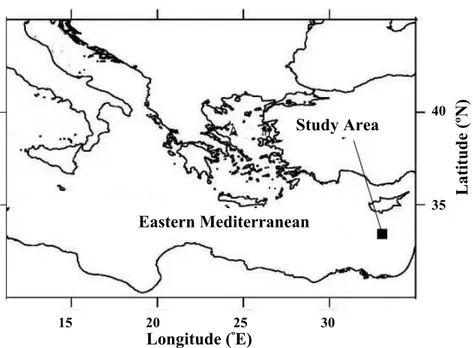
On-deck irradiation experiments were carried out during cruise CYC2 of RV “Aegaio”, in the Cyprus gyre during May 2002 (Fig. 1). The central cruise objective was to carry out
15
a Lagrangian experiment involving a dual PO34−–SF6tracer release (Law et al., 2005), an integral component of the EU-CYCLOPS program (http://www.earth.leeds.ac.uk/ cyclops/). In brief a 4×4 km patch of surface water located in the core of an anticyclonic eddy centred on 33.3◦N, 32.3◦E, was infused with PO34− and SF6. The patch was released on the 17 May 2002 and subsequent changes in a range of biogeochemical
20
parameters were followed over a 9 day period at IN-patch stations and compared to pre-release and OUT-patch stations at a minimum distance of 15 km from the patch centre. An overview of procedural details and results was published elsewhere (Krom et al., 2005a).
The hydrography and N-biogeochemistry of the study area is described in detail by
25
BGD
3, 449–474, 2006Ammonium photoproduction
V. Kitidis et al.
Title Page
Abstract Introduction
Conclusions References
Tables Figures
◭ ◮
◭ ◮
Back Close
Full Screen / Esc
Printer-friendly Version
Interactive Discussion
EGU
surface mixed layer was found with a further, shallow (seasonal) thermocline at ap-proximately 20 m depth. The mixed layer salinity was∼39.1 and its temperature was 17–20◦C. Surface mixed layer chlorophyllalevels were in the range of 20–50 ng L−1. A deep chlorophyllamaximum (DCM) of 200 ng L−1was located at approximately 110 m. The primary NO−2 maximum was observed between 130–160 m and was associated
5
with the pycnocline. Dissolved Organic Nitrogen (DON) in the surface mixed layer was in the range of 5–10µmol L−1. Urea, determined according to Goyens et al. (1998) for only one in-patch station (2 days post release, station 2CYC27), showed a concen-tration maximum of 140 nmol L−1at∼120–140 m depth and otherwise remained below analytical detection limits (<100 nmol L−1).
10
2.2 Sampling and sunlight irradiations
In total, 8 irradiation experiments (IREX) were carried out with water samples from the DCM, surface IN-patch and surface OUT-patch. Sample details are listed in Ta-ble 1. Water samples for irradiation experiments (∼10 L) were collected daily between 08:00 a.m. and 10:00 a.m. local time using a CTD-rosette sampler and filtered
imme-15
diately (0.1µm, Whatman, Polycap 75TF). Filtrates were collected in 20 L polyethylene carbuoys, pre-cleaned with dilute HCl and analytical grade water (Millipore, model Milli-Q 185, hereinafter referred to as Milli-Milli-Q). Samples were stored in the dark at room temperature until irradiation the following day. Each sample was used to completely fill a series of cylindrical quartz irradiation flasks with an internal volume of 430 mL.
20
These were then immediately capped with Nylon compression fittings (Swagelok™) and placed in a shallow deck incubator, which was continuously flushed with ambient surface seawater. The irradiations ran for≤3 h around local solar noon, with sequen-tial sampling for dissolved NH+4. Dark control flasks were treated identically, except that they were wrapped in double aluminium foil to exclude light. All irradiations were carried
25
BGD
3, 449–474, 2006Ammonium photoproduction
V. Kitidis et al.
Title Page
Abstract Introduction
Conclusions References
Tables Figures
◭ ◮
◭ ◮
Back Close
Full Screen / Esc
Printer-friendly Version
Interactive Discussion
EGU
did not affect subsequent rates of NH+4 photoproduction (Morell and Corredor, 2001). Flow cytometry of selected samples confirmed the removal of>99.5% of bacteria and picoplankton by our filtration protocol (M. Zubkov, personal communication).
Samples for dissolved organic carbon (DOC) and nitrogen (DON) were collected daily from the CTD-rosette sampler. Polythene (powder-free) gloves were worn
5
throughout handling procedures. Pre-cleaned all-glass syringe systems with Teflon tubing and an on-line stainless-steel unit containing 0.7µm glass fibre filter (Whatman, GF/F) were used to collect the water samples directly from the CTD bottle. Filters were pre-combusted in an oven at 450◦C for at least 4 h. The samples were transferred to pre-combusted 10 mL glass ampoules, acidified with high-grade phosphoric acid and
10
flame sealed. The glass ampoules containing the sample were stored cold (∼4◦C) in the dark and transferred for analysis on-shore.
Global solar irradiance was measured continuously with the ship’s solar radiation sensors (Aandera Instruments, Solar Radiation Sensor model 2770) and recorded as 10 min averages throughout the entire cruise. Mean global solar irradiance during the
15
experiments was 842±95 Wm−2. In one irradiation experiment a sample subset was screened with a clear acrylic sheet (10% transmission at 360 nm) in order to investigate the broadband wavelength dependence of NH+4 photoproduction. A broadband UV sensor (Delta-T, model UV-AB) showed that approximately 50 % of the ambient UV light (<400 nm) passed through the acrylic filter.
20
2.3 Sample analysis
Nanomolar NH+4 was determined by flow injection analysis with fluorometric detection, following preconcentration by diffusion across a microporous hydrophobic membrane and derivatisation with o-phthal-dialdehyde (OPA) (Jones, 1991). Fresh standards were prepared daily in low nutrient seawater, which was collected previously in the
25
surface central North Atlantic, filtered through a 0.2µm filter and aged in the dark for
BGD
3, 449–474, 2006Ammonium photoproduction
V. Kitidis et al.
Title Page
Abstract Introduction
Conclusions References
Tables Figures
◭ ◮
◭ ◮
Back Close
Full Screen / Esc
Printer-friendly Version
Interactive Discussion
EGU
n=6).
For DOC and DON, samples were analysed by high temperature catalytic oxidation with infrared detection for C (Shimadzu TOC-5000A) and chemiluminescence detec-tion for N (Antek 7000) (Alvarez-Saldago and Miller, 1998; Spyres et al., 2000). The acidified samples were purged with high purity N2 gas (BOC gases Ltd.) immediately
5
prior to analysis for approximately 10 min to remove the inorganic carbon. Deep Sar-gasso seawater samples with a certified DOC concentration of 44.0±1.5µmol L−1were used daily as a check on instrument performance and accuracy. Blank correction was applied daily to the DOC measurements.
2.4 CDOM
10
CDOM absorbance spectra were recorded on a double beam UV-visible spectropho-tometer (Shimadzu, model UV 240) at 10 nm intervals between 250 and 800 nm, using 100 mm pathlength quartz cells. Samples were referenced against Milli-Q water and absorbance spectra were corrected for instrument drift by subtracting the mean ab-sorbance for the 650–700 nm wavelength interval (Green and Blough, 1994). This
15
wavelength range was chosen in order to avoid temperature effects on sample ab-sorbance which are confined to slightly longer wavelengths (700–775 nm) (e.g. Pe-gau and Zaneveld, 1993; Kitidis, 2002). Absorption coefficients were calculated from Eq. (1):
aλ= 2.303×Aλ
l (1)
20
whereaλ is the absorption coefficient (m−1) at wavelengthλ, Aλ is the absorbance at wavelength λ and l is the cell pathlength (m). The absorption coefficient at 300 nm (a300) was used as a proxy for CDOM. Given the detection limit of the spectrophotome-ter (0.001 absorbance units) and a optical cell pathlength of 0.1 m, the detection limit for CDOM was 0.04 m−1.
BGD
3, 449–474, 2006Ammonium photoproduction
V. Kitidis et al.
Title Page
Abstract Introduction
Conclusions References
Tables Figures
◭ ◮
◭ ◮
Back Close
Full Screen / Esc
Printer-friendly Version
Interactive Discussion
EGU
2.5 Statistical analysis and precision
All statistical analyses were carried out with Minitab (Minitab Inc., version 13.1). A paired t-test was carried out to explore the significance of differences between the mean a300 values and DOC concentrations in surface waters (<30 m) and at depth (>30 m). Both a300 and DOC data were normally distributed. Pearson’s correlation
5
analysis was used to investigate relationships between photoammonification rate and various environmental parameters. Irradiation of one IN-patch sample was repeated on two consecutive days (IREX 6 and 7) in order to asses the overall precision of our experimentally derived rate data.
3 Results 10
3.1 Initial sample properties
An initial survey of the study area established the mixed layer distributions of CDOM (a300), DOC and DON. CDOM was the main UV absorbing chromophore in surface wa-ters of the Cyprus Gyre due to low ambient concentrations of NO−3 and NO−2 (<10 nmol L−1, Krom et al., 2005b). The near-surface (0–30 m) mean a300 (± standard
devia-15
tion) was 0.25±0.04 m−1 (range: 0.14–0.36 m−1,n=46) and the respective meana300 (±standard deviation) in deeper water (30–1600 m) was 0.29±0.06 m−1(range: 0.16– 0.45 m−1,n=22). These means were significantly different (t-test,p <0.01, degrees of freedom: 30), with lower CDOM absorbance in near-surface waters.
The near-surface (0–30 m) mean DOC (±standard deviation) was 88±16µmol L−1
20
(range: 60–123µmol L−1, n=66) and the respective mean DOC (± standard devi-ation) in deeper water (30–2600 m) was 76±23µmol L−1 (range: 37–126µmol L−1, n=90). The respective means were significantly different (t-test,p <0.001, degrees of freedom: 152), with higher DOC concentrations in near-surface waters. Near surface (<30 m) DOM therefore had lower absorbance per unit carbon than DOM in deeper
BGD
3, 449–474, 2006Ammonium photoproduction
V. Kitidis et al.
Title Page
Abstract Introduction
Conclusions References
Tables Figures
◭ ◮
◭ ◮
Back Close
Full Screen / Esc
Printer-friendly Version
Interactive Discussion
EGU
water (>30 m).
The near-surface (0–30 m) mean DON (±standard deviation) was 4.7±1.9µmol L−1 (range: 1.2–11.1µmol L−1, n=89) and the respective mean DON (±standard devia-tion) in deeper water (30–2600 m) was 4.2±2.1µmol L−1 (range: 0.3–12.3µmol L−1, n=97). In contrast to the observed differences in CDOM and DOC, the respective DON
5
means over the two depth intervals were not significantly different (t-test,p=0.152, de-grees of freedom: 179). These findings would indicate that DOC and DON did not co vary with each other over the depth range investigated. The mean DOC:DON ratio in near-surface water (0–30 m) was 18.7 and only slightly above that of deeper water (30–2600 m), which was 18.1. Our data therefore indicate only small differences in
10
DON concentrations and DOC:DON ratios between surface and depth. It is, however, possible that the high variability of DON concentrations within each depth interval may have masked statistically significant compositional differences.
All samples subsequently used in irradiation experiments had initiala300 and DOC values within the respective ranges of surface and deep water (Table 1). Hence we
15
considered the irradiated samples to be representative of the study area.
3.2 Irradiations
Figure 2 shows changes in NH+4 concentration against time-integrated light intensity during individual irradiation experiments. Dark controls are also shown. In all irradia-tions NH+4 increased with time or time-integrated irradiance, while the NH+4
concentra-20
tion in dark controls showed little variability, remained largely unchanged within analyt-ical precision, and always lower than corresponding NH+4 concentrations in irradiated samples (Fig. 2). Irradiance normalised photoproduction rates were determined from the slope of the linear regression of NH+4 concentration against time-integrated irradi-ance over the course of each experiment for light treated samples. In order to correct
25
BGD
3, 449–474, 2006Ammonium photoproduction
V. Kitidis et al.
Title Page
Abstract Introduction
Conclusions References
Tables Figures
◭ ◮
◭ ◮
Back Close
Full Screen / Esc
Printer-friendly Version
Interactive Discussion
EGU
deviation) of photoammonification rates normalised to light intensity was 2.1±0.9 pmol L−1h−1/(W m−2). The precision of these rate data, defined as the standard deviation of the rates calculated from replicate rate determinations (IREX 6 and 7) was 0.4 pmol L−1h−1/(W m−2). During IREX 1, the fate of photoproduced NH+4 following irradiation was studied by analysing the NH+4 concentration in an irradiated flask 2 h after the
5
end of a 2.5 h irradiation period. We found no discernible NH+4 concentration change post-irradiation and therefore concluded that NH+4 released during this experiment was not reincorporated into dissolved organic nitrogen (DON) or otherwise removed. In IREX 6, the photoammonification rate in the sample subset exposed to light>360 nm was only 0.5 pmol L−1h−1/(W m−2) compared to 2.1 pmol L−1h−1/(W m−2) for the
sub-10
set exposed to the full solar spectrum. This indicated that UV light of wavelengths below 360 nm accounted for 76% of NH+4 photoproduction during this irradiation.
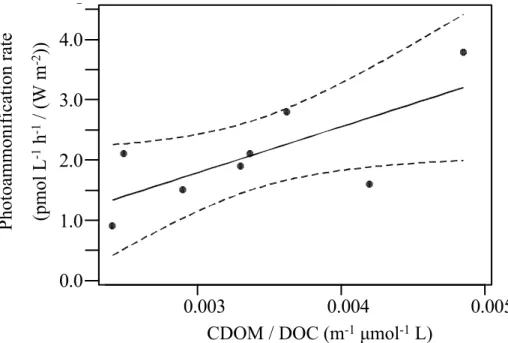
Overall, photoammonification rates were not correlated with either CDOM (a300)
or DOC alone, but were significantly correlated with CDOM normalised DOC (Pear-son correlation coefficient R2=0.52, p <0.05, n=8) (Fig. 3). There was no apparent
15
change with time in the photoammonification rate of surface IN-patch samples follow-ing the release of the PO34−/SF6patch. Furthermore, photoammonification rates were 1.8±0.4 pmol L−1h−1/(W m−2) in IN-patch water 5.5 days after the patch release and 2.1 pmol L−1h−1/(W m−2) in OUT-patch water 6.5 days after release. Therefore, we concluded that the addition of PO34− to surface waters of the Cyprus Gyre had no effect
20
on photoammonification rates over the short period studied.
4 Discussion
4.1 Photoammonification
Table 2 compares photoammonification rates from the present study (not normalised for time-integrated irradiance in order to facilitate comparison) with previously published
25
BGD
3, 449–474, 2006Ammonium photoproduction
V. Kitidis et al.
Title Page
Abstract Introduction
Conclusions References
Tables Figures
◭ ◮
◭ ◮
Back Close
Full Screen / Esc
Printer-friendly Version
Interactive Discussion
EGU
orders of magnitude, presumably reflecting differences in DOM concentration and com-position. Our photoammonification rate data from the oligotrophic Cyprus Gyre in the Eastern Mediterranean fall towards the low end of published rate data and are similar to those observed in other marine waters from the eastern tropical Pacific (Bronk, 2002). Other previous studies in coastal waters also found similar photoammonification rates
5
for experimental procedures and light intensities comparable to those experienced in the Eastern Mediterranean during our work (e.g. Bushaw-Newton and Moran, 1999; Buffam and McGlathery, 2003). Freshwaters generally show up to 2 orders of magni-tude higher rates of NH+4 photoproduction than do saline waters (Table 2). This finding may be attributed to the high DOM levels present in freshwaters, although other
en-10
vironmental variables including pH, iron and initial NH+4 concentration have also been shown to affect photoammonification. For example, photoammonification rates were shown to be correlated with photo-labile Fe concentration (Gao and Zepp, 1998) and inversely correlated with pH (Wang et al., 2000) and initial NH+4 (Koopmans and Bronk, 2002). The occurrence of comparatively low photoammonification rates in the Cyprus
15
gyre is therefore not unexpected given the low ambient DOM, Fe and NH+4 levels com-pared to those of typical freshwaters.
Our data from IREX 6 (Table 1) suggest that approximately 76% of total NH+4 photo-production is attributable to UV light of wavelength<360 nm, in broad agreement with previous work. By way of comparison, for irradiated freshwaters 47–83% of
photoam-20
monification was due to wavelengths<360 nm (Bushaw et al., 1996).
We found no evidence for light or dark NH+4 incorporation into DON during or after our irradiations, in contrast to the results of some other studies (Thorn and Mikita, 1992; Gardner et al., 1998; Koopmans and Bronk, 2002). Net photoconsumption of NH+4 has on occasion, been identified in both fresh and saline waters (Gardner et al., 1998;
25
BGD
3, 449–474, 2006Ammonium photoproduction
V. Kitidis et al.
Title Page
Abstract Introduction
Conclusions References
Tables Figures
◭ ◮
◭ ◮
Back Close
Full Screen / Esc
Printer-friendly Version
Interactive Discussion
EGU
inversely proportional to initial NH+4 concentration, consistent with the incorporation of NH+4-N into DON as observed by Thorn and Mikita (1992) and Kieber et al. (1997). The contrast between these previous studies and consistent NH+4 photoproduction in all our samples presumably reflected DOM compositional variability related to DOM source, transformation history or differences in DOM and NH+4 concentrations.
5
Based on the notion that photochemical processes are largely affected by CDOM as indicated by its UV absorbance, photoammonification rates were frequently nor-malised toa350 (Bushaw et al., 1996; Bushaw-Newton and Moran, 1999; Wang et al., 2000). Nevertheless, a recent compilation of available data on NH+4 photoproduction concluded that the variability in NH+4 photoproduction rates could not be attributed to
10
variability in CDOM levels (Grzybowski, 2003). For our data from the Cyprus Gyre, we used the CDOM absorption coefficient at 300 nm,a300, to test for possible CDOM-photoammonification relationships. In low CDOM oligotrophic marine waters, such as those in the Cyprus Gyre, the use ofa300is appropriate because the higher absorbance in the UV-B provides a better signal to noise ratio than that in the mid-UV (Kitidis et al.,
15
2006). In agreement with Grzybowski (2003) our data did not support a direct correla-tion between photoammonificacorrela-tion rates and CDOM (a350ora300). In addition no signif-icant correlations were found between NH+4 photoproduction rates and other ancillary parameters such as DOC, DON, DOC:DON and initial NH+4 concentration. However, we found a significant correlation with DOC normalised CDOM absorbance,a300(Pearson
20
correlation coefficient R2=0.52, p<0.05, n=8), i.e. higher photoammonification rates may be expected from more coloured ambient DOC. This may reflect prior sunlight exposure history and photobleaching of the ambient CDOM pool, in agreement with Buffam and McGlathery (2003) who reported that photoammonification rates in coastal seawater were correlated with rates of CDOM absorbance photobleaching at 280 nm.
25
BGD
3, 449–474, 2006Ammonium photoproduction
V. Kitidis et al.
Title Page
Abstract Introduction
Conclusions References
Tables Figures
◭ ◮
◭ ◮
Back Close
Full Screen / Esc
Printer-friendly Version
Interactive Discussion
EGU
with both photobleaching rates (Buffam and McGlathery, 2003) and DOC-normalised CDOM (this study), intrinsically link NH+4 photoproduction with prior radiation exposure. CDOM photobleaching is likely responsible for the variations in DOC-normalised CDOM in our samples from the surface layer of the Cyprus Gyre. This contention is further corroborated by our finding that the distribution of DOC anda300 in our survey
5
of the Cyprus Gyre clearly showed lower absorbance per unit carbon in near surface DOM, presumably due to a photochemical CDOM sink in near surface waters. Similar findings were reported from the BATS station in the oligotrophic North Atlantic where the observed summer decrease in CDOM absorbance in the mixed layer was attributed to CDOM photo-oxidation (Siegel and Michaels, 1996). Decreasing CDOM:DOC
ra-10
tios with distance offshore in the Mid Atlantic Bight were also ascribed to progressive CDOM photodegradation of terrestrial CDOM (Del Vecchio and Blough, 2004). Our data therefore suggest that regional differences in CDOM:DOC ratios may be of value in extrapolating photoammonification rates, although additional rate data on regional scales are needed to test this supposition.
15
4.2 Photochemical ammonium in the Cyprus Gyre
In order to estimate the annual rate of photoammonification in the Cyprus gyre, we scaled our apparent photoproduction rate estimates to take account of seasonal changes in solar irradiance, light attenuation by CDOM and surface mixed layer depth. Daily sea surface photoammonification (po) was first derived from our experimental
20
photoproduction rate estimates and the proportion of daily irradiance received during the course of the irradiations from Eq. (2):
p0=(r ×δ(ti r.ex.))× R
It d(t)
R
It d(ti r.ex.) (2)
wherer is the mean photoammonification rate, uncorrected for light intensity (1.6 nmol L−1h−1), δ(ti r.ex.) is the average duration of our irradiations,∫Itd(t) is the daily (t=0–
25
av-BGD
3, 449–474, 2006Ammonium photoproduction
V. Kitidis et al.
Title Page
Abstract Introduction
Conclusions References
Tables Figures
◭ ◮
◭ ◮
Back Close
Full Screen / Esc
Printer-friendly Version
Interactive Discussion
EGU
erage duration of the irradiation experiment. We used the rate obtained with Eq. (2) (po=14.6 nmol L−1d−1) to calculate the average photoammonification rate (pz) in a wa-ter column of depthZ according to Eq. (3) as suggested by Moran and Zepp (2000):
pz =
p0×1−e−kd(λ)×Z
Z×Kd(λ) (3)
whereKd(λ) is the light attenuation coefficient at wavelength λ. We calculated Kd(λ)
5
from the CDOM absorption coefficient according to Preisendorfer (1976),
Kd(λ) ≈4
3 ×(a(λ)+a(λ)w) (4)
wherea(λ) anda(λ)w are the absorption coefficients of CDOM and pure water at wave-lengthλ respectively. Values for a(λ)w were obtained from Smith and Baker (1981). A small error is undoubtedly introduced by not measuring Kd(λ) directly. However,
10
recent work by Farmer et al. (1993) showed favourable agreement between Kd(λ) observed in-situ and Kd(λ) estimated from Eq. (4). Therefore, the major uncertain-ties in the calculations outlined above are the variability in photoammonification rates and the wavelength chosen to estimate the light attenuation coefficient. Wavelength dependence data for photoammonification are unavailable so far, but our data and
15
those of Bushaw et al. (1996) show photoammonification to be dominated by wave-lengths <360 nm. We therefore used λ=300 nm and λ=350 nm in order to define likely upper and lower constraints for Kd. The values derived from Eq. (4) were Kd(300)=0.47 m−1 and Kd(350)=0.16 m−1. Integrated over the euphotic layer (140 m deep), this yields correspondingpz values of 174µmol m−2d−1and 302µmol m−2d−1
20
BGD
3, 449–474, 2006Ammonium photoproduction
V. Kitidis et al.
Title Page
Abstract Introduction
Conclusions References
Tables Figures
◭ ◮
◭ ◮
Back Close
Full Screen / Esc
Printer-friendly Version
Interactive Discussion
EGU
Assuming our estimate ofpz to be typical for the Cyprus gyre in summer, we applied further seasonal corrections based on seasonal clear sky solar irradiance at 40◦ lati-tude (Leifer, 1988) averaged over the wavelength range from 300 to 800 nm. Dividing seasonal irradiance data by summer irradiance (Leifer, 1988) gave seasonal correction factors of 0.25, 75 and 0.43 for winter, spring, and autumn respectively (summer=1). A
5
further correction factor for globally averaged cloud cover of 0.77 (Wayne, 2000) was applied. Annual photoammonification rate was then calculated from the sum of the respective seasonal contributions. The photochemical supply of NH+4 to the Cyprus gyre determined with this procedure is 40±17 mmol N m−2a−1 (based on the mean photoammonification rate ±standard deviation from our experiments). This value is
10
of the same order of magnitude as the estimated inorganic N supply to the eastern Mediterranean through atmospheric deposition, 71 mmol N m−2a−1(Herut et al., 1999, 2002), and corresponds to 12±5% of the annual nitrogen demand for new production in the Cyprus Gyre (Krom et al., 1992). Therefore, our preliminary estimate of water-column photoammonification clearly indicates a potentially significant contribution of
15
photochemical NH+4 release to the N budget of the Cyprus Gyre region. As the Cyprus Gyre undergoes episodes of P-limitation the overall impact of photochemical NH+4 re-lease on primary production may in part be controlled by the availability of P. Onboard microcosm experiments during which NH+4 was added to IN-patch water samples after P-release showed increased bacterial activity and a 4–80 fold increase in chlorophyll
20
compared to OUT-patch control treatments and IN-patch samples without added P (Zo-hary et al., 2005). These results indicate that, under similar situations, photochemically released NH+4 is likely to stimulate phytoplankton production. Further studies of photo-chemical NH+4 release in the open ocean will help to constrain more tightly, the role of photoammonification in oligotrophic marine ecosystems.
25
num-BGD
3, 449–474, 2006Ammonium photoproduction
V. Kitidis et al.
Title Page
Abstract Introduction
Conclusions References
Tables Figures
◭ ◮
◭ ◮
Back Close
Full Screen / Esc
Printer-friendly Version
Interactive Discussion
EGU
ber: NER/B/S/2001/00913).
References
Alvarez-Salgado, X. A. and Miller, A. E. J.: Simultaneous determination of dissolved organic carbon and total dissolved nitrogen in seawater by high temperature catalytic oxidation: con-ditions for precise shipboard measurements, Mar. Chem., 62(3–4), 325–333, 1998.
5
Bertilsson, S., Stepanauskas, R., Cuadros-Hansson, R., Graneli, W., Wikner, J., and Tranvik, L.: Photochemically induced changes in bioavailable carbon and nitrogen pools in a boreal watershed, Aquatic Microbial Ecology, 19, 47–56, 1999.
Bronk, D. A.: Dynamics of DON, in: Biogeochemistry of Marine Dissolved Organic Matter, edited by: Hansell, D. A. and Carlson, C. A., Academic Press, London, 2002.
10
Buffam, I. and McGlathery, K. J.: Effect of ultraviolet light on dissolved nitrogen transformations in coastal lagoon water, Limnol. Oceanogr., 48(2), 723–734, 2003.
Bushaw, K. L., Zepp, R. G., Tarr, M. A., Shulz-Jander, D., Bourbonniere, R. A., Hodson, R. E., Miller, W. L., Bronk, D. A., and Moran, M. A.: Photochemical release of biologically available nitrogen from aquatic dissolved organic matter, Nature, 381, 404–407, 1996.
15
Bushaw-Newton, K. L. and Moran, M. A.: Photochemical formation of biologically available ni-trogen from dissolved humic substances in coastal marine systems, Aquatic Microbial Ecol-ogy, 18, 285–292, 1999.
Del Vecchio, R. and Blough, N. V.: Spatial and seasonal distribution of chromophoric dissolved organic matter and dissolved organic carbon in the Middle Atlantic Bight, Mar. Chem., 89,
20
169–187, 2004.
Farmer, C. T., Moore, C. A., Zika, R. G., and Sikorski, R. J.: Effects of Low and High Orinoco River Flow on the Underwater Light Field of the Eastern Caribbean Basin, J. Geophys. Res., 98, 2279–2288, 1993.
Gao, H. and Zepp, R. G.: Factors Influencing Photoreactions of Dissolved Organic Matter in
25
a Coastal River of the Southeastern United States, Environ. Sci. Technol., 32, 2940–2946, 1998.
Gardner, W. S., Cavaletto, J. F., Bootsma, H. A., Lavrentyev, P. J., and Troncone, F.: Nitrogen cycling rates and light effects in tropical Lake Maracaibo, Venezuela, Limnol. Oceanogr., 43(8), 1814–1825, 1998.
BGD
3, 449–474, 2006Ammonium photoproduction
V. Kitidis et al.
Title Page
Abstract Introduction
Conclusions References
Tables Figures
◭ ◮
◭ ◮
Back Close
Full Screen / Esc
Printer-friendly Version
Interactive Discussion
EGU
Goeyens, L., Kindermans, N., Yusuf, M. A., and Elskens, M.: A Room Temperature Procedure for the Manual Determination of Urea in Seawater, Estuarine Coastal Shelf Sci,, 47, 415– 418, 1998.
Green, S. A. and Blough, N. V.: Optical absorption and fluorescence properties of chromophoric dissolved organic matter in natural waters, Limnol. Oceanogr., 39(8), 1903–1916, 1994.
5
Grzybowski, W.: Are data on light-induced ammonium release from dissolved organic matter consistent?, Chemosphere, 52, 933–936, 2003.
Herut, B., Krom, M. D., Pan, G., and Mortimer, R.: Atmospheric input of nitrogen and phos-phorus to the Southeast Mediterranean: Sources, fluxes and possible impact, Limnol. Oceanogr., 44(7), 1683–1692, 1999.
10
Herut, B., Collier, R., and Krom, M. D.: The role of dust in supplying nitrogen and phosphorus to the southeast Mediterranean, Limnol. Oceanogr., 47(3), 870–878, 2002.
Jones, R. D.: An improved fluorescence method for the determination of nanomolar concentra-tions of ammonium in natural waters, Limnol. Oceanogr., 36(4), 814–819, 1991.
Jørgensen, N. O. G., Tranvik, L., Edling, H., Graneli, W., and Lindell, M.: Effects of sunlight on
15
occurence and bacterial turnover of specific carbon and nitrogen compounds in lake water, FEMS Microbiol. Ecol., 25, 217–227, 1998.
Kieber, R. J., Hydro, L. H., and Seaton, P. J.: Potooxidation of triglycerides and fatty acids in seawater: Implications toward the formation of marine humic substances, Limnol. Oceanogr., 42(6), 1454–1462, 1997.
20
Kieber, R. J., Li, A., and Seaton, P. J.: Production of Nitrite from the Photodegradation of Dissolved Organic Matter in Natural Waters, Environ. Sci. Technol., 33, 993–998, 1999. Kitidis, V.: CDOM dynamics and photoammonification in the marine environment, Ph.-D.
The-sis, University of Newcastle, p. 182, 2002.
Kitidis, V., Stubbins, A. P., Uher, G., Upstill-Goddard, R., Law, C. S., and Woodward, E. M. S.:
25
Variability of Chromophoric Organic Matter in surface waters of the Atlantic Ocean, Deep Sea Res. II, in press, 2006.
Koopmans, D. J. and Bronk, D. A.: Photochemical production of dissolved inorganic nitrogen and primary amines from dissolved organic nitrogen in waters of two estuaries and adjacent surficial groundwaters, Aquatic Microbial Ecology, 26, 295–304, 2002.
30
BGD
3, 449–474, 2006Ammonium photoproduction
V. Kitidis et al.
Title Page
Abstract Introduction
Conclusions References
Tables Figures
◭ ◮
◭ ◮
Back Close
Full Screen / Esc
Printer-friendly Version
Interactive Discussion
EGU
production in a warm-core eddy from the Eastern Mediterranean Sea, Deep Sea Res. I, 39(3/4), 467–480, 1992.
Krom, M. D., Herut, B. and Mantoura, R. F. C.: Nutrient budget for the Eastern Mediterranean: Implications for phosphorus limitation, Limnol. Oceanogr., 49(5), 1582–1592, 2004.
Krom, M. D., Thingstad, T. F., Brenner, S., Carbo, P., Drakopoulos, P., Fileman, T. W., Flaten,
5
G. A. F., Groom, S., Herut, B., Kitidis, V., Kress, N., Law, C. S., Liddicoat, M. I., Mantoura, R. F. C., Pasternak, A., Pitta, P., Polychronaki, T., Psarra, S., Rassoulzadegan, F., Skjoldal, E. F., Spyres, G., Tanaka, T., Tselepides, A., Wassmann, P., Riser, C. W., Woodward, E. M. S., Zodiatis, G., and Zohary, T.: Summary and overview of the CYCLOPS P addition Lagrangian experiment in the Eastern Mediterranean, Deep Sea Res. II, 52, 3090–3108, 2005a.
10
Krom, M. D., Woodward, E. M. S., Herut, B., Kress, N., Carbo, P., Mantoura, R. F. C., Spyres, G., Thingstad, T. F., Wassmann, P., Wexels-Riser, C., Kitidis, V., Law, C. S., and Zodiatis, G.: Nutrient cycling in the south east Levantine basin of the eastern Mediterranean: Results from a phosphorus starved system, Deep Sea Res. II, 52, 2879–2896, 2005b.
Law, C. S., Abraham, E. R., Woodward, E. M. S., Liddicoat, M. I., Fileman, T. W., Thingstad, T.
15
F., Kitidis, V., and Zohary, T.: The fate of Phosphate in a Lagrangian enrichment experiment in the Eastern Mediterranean, Deep Sea Res. II, 52, 2911–2927, 2005.
Leifer, A.: The kinetics of environmental aquatic photochemistry: Theory and Practice, Ameri-can Chemical Society, 1988.
Moran, M. A., Sheldon, W. M., and Zepp, R. G.: Carbon loss and optical property changes
20
during long-term photochemical and biological degradation of estuarine dissolved organic matter, Limnol. Oceanogr., 45, 1254–1264, 2000.
Moran, M. A. and Zepp, R. G.: UV radiation effects on microbes and microbial processes, in: Microbial Ecology of the Oceans, edited by: Kirchman D. L., John Wiley & Sons Ltd., New York, 2000.
25
Morell, J. M. and Corredor, J. E.: Photomineralization of fluorescent organic matter in the Orinoco River plume: Estimation of ammonium release, J. Geophys. Res.-Oceans, 106(C8), 16 807–16 813, 2001.
Pegau, W. S. and Zaneveld, J. R. V.: Temperature-Dependent Absorption of Water in the Red and near- Infrared Portions of the Spectrum, Limnol. Oceanogr., 38, 188–192, 1993.
30
Preisendorfer, R. W.: Hydrologic Optics, Vol. 5, U.S. Department of Commerce, NOAA Envi-ronmental Research Laboratory, Washington D.C., 1976.
ambi-BGD
3, 449–474, 2006Ammonium photoproduction
V. Kitidis et al.
Title Page
Abstract Introduction
Conclusions References
Tables Figures
◭ ◮
◭ ◮
Back Close
Full Screen / Esc
Printer-friendly Version
Interactive Discussion
EGU
ent concentrations in oligotrophic waters of the North-East Atlantic Ocean, Marine Ecology Progress Series, 187, 295–300, 1999.
Siegel, D. A. and Michaels, A. F.: Quantification of non-algal light attenuation in the Sargasso Sea: Implications for biogeochemistry and remote sensing, Deep Sea Res. II, 43, 321–345, 1996.
5
Smith, R. C. and Baker, K. S.: Optical properties of the clearest natural waters (200–800 nm), Appl. Opt., 20, 177–184, 1981.
Spokes, L. J. and Liss, P. S.: Photochemically induced redox reactions in seawater, II. Nitrogen and iodine, Mar. Chem., 54, 1–10, 1996.
Spyres, G., Nimmo, M., Worsfold, P. J., Achterberg, E. P., and Miller, A. E. J.: Determination of
10
dissolved organic carbon in seawater using high temperature catalytic oxidation techniques, Trac-Trends in Analytical Chemistry, 19, 498–506, 2000.
Tarr, M., Wang, W., Bianchi, T. S., and Engelhaupt, E.: Mechanisms of ammonia and amino acid photoproduction from aquatic humic and colloidal matter, Water Res., 35(15), 3688– 3696, 2001.
15
Thingstad, T. F., Krom, M. D., Mantoura, R. F. C., Flaten, G. A. F., Groom, S., Herut, B., Kress, N., Law, C. S., Pasternak, A., Pitta, P., Psarra, S., Rassoulzadegan, F., Tanaka, T., Tse-lepides, A., Wassmann, P., Woodward, E. M. S., Riser, C. W., Zodiatis, G., and Zohary, T.: Nature of phosphorus limitation in the ultraoligotrophic eastern Mediterranean, Science, 309, 1068–1071, 2005.
20
Thorn, K. A. and Mikita, M. A.: Ammonia fixation by humic substances: a nitrogen-15 and carbon-13 NMR study, Sci. Total Environ., 113, 67–87, 1992.
V ¨ah ¨atalo, A. V., Salonen, K., Muenster, U., Jarvinen, M., and Wetzel, R. G.: Photochemical transformation of allochthonous organic matter provides bioavailable nutrients in a humic lake, Archiv f ¨ur Hydrobiologie, 156(3), 287–314, 2003.
25
Wayne, R. P.: Chemistry of Atmospheres, Oxford University Press, Oxford, 2000.
Wang, W., Tarr, M. A., Bianchi, T. S., and Engelhaupt, E.: Ammonium Photoproduction from Aquatic Humic and Colloidal Matter, Aquatic Geochemistry, 6, 275–292, 2000.
Wiegner, T. N. and Seitzinger, S. P.: Photochemical and microbial degradation of external dissolved organic matter inputs to rivers, Aquatic Microbial Ecology, 24, 27–40, 2001.
30
BGD
3, 449–474, 2006Ammonium photoproduction
V. Kitidis et al.
Title Page
Abstract Introduction
Conclusions References
Tables Figures
◭ ◮
◭ ◮
Back Close
Full Screen / Esc
Printer-friendly Version
Interactive Discussion
EGU
BGD
3, 449–474, 2006Ammonium photoproduction
V. Kitidis et al.
Title Page
Abstract Introduction
Conclusions References
Tables Figures
◭ ◮
◭ ◮
Back Close
Full Screen / Esc
Printer-friendly Version
Interactive Discussion
EGU
Table 1.Initial properties of irradiated samples; a300(m−1), DOC (µmol L−1) and
photoammoni-fication rate (pmol L−1h−1/(W m−2)) normalised to time-integrated irradiance (non-normalised rate in brackets, nmol L−1h−1). Samples were classified according to their origin into: a) Deep Chlorophyll Maximum (DCM) and b) IN- and c) OUT- stations in relation to the PO34−/SF6patch. Time refers to days pre- (negative) and post-release (positive) of the PO34−/SF6patch.
IREX Time Station a300 DOC Photoammonification
1 −1.5 DCM 0.25 51 3.8 (2.9) 2 0.5 DCM 0.36 109 1.9 (1.5) 3 1.5 IN-20 m 0.26 110 0.9 (0.7) 4 3.5 IN-20 m 0.22 62 2.8 (2.2) 5 3.5 IN-30 m 0.26 62 1.6 (1.2) 6 5.5 IN-20 m 0.26 77 2.1 (1.6) (>360 nm) 0.5 (0.4) 7 5.5 IN-20 m 0.22 77 1.5 (1.2) 8 6.5 OUT-20 m 0.19 77 2.1 (1.6)
BGD
3, 449–474, 2006Ammonium photoproduction
V. Kitidis et al.
Title Page
Abstract Introduction
Conclusions References
Tables Figures
◭ ◮
◭ ◮
Back Close
Full Screen / Esc
Printer-friendly Version
Interactive Discussion
EGU
Table 2.Published NH+4 production rates (nmol L−1h−1) in freshwater, estuarine (salinity<30)
and marine aquatic environments listing sample origin and publication. (*): Daily rate based on 3 % conversion of ambient DON pool.
Samples NH+4 photoproduction Reference rates (nmol L−1h−1)
freshwater and estuarine fil-tered, isolated humics
50–370 Bushaw et al. (1996)
freshwater 90 Gao and Zepp (1998) freshwater 0 Jørgensen et al. (1998) freshwater 0 Bertilsson et al. (1999) freshwater filtered and
ultrafil-tered
110–4700 Wang et al. (2000)
freshwater forest & agricul-tural runoff
0 Wiegner and Seitzinger (2001)
freshwater lake 763* V ¨ah ¨atalo et al. (2003) coastal lake, salinity<4.4 −70–220 Gardner et al. (1998) estuarine isolated humics,
salinity<25
7–60 Bushaw-Newton and Moran (1999)
estuarine filtered, coastal river plume
12–115 Morel and Corredor (2001)
freshwater, groundwater and estuarine, sal.<25
−294–34.8 Koopmand and Bronk (2002)
marine, coastal lagoon 1–46 Buffam and McGlathery (2003) Eastern Tropical North Pacific 0.4–2.5 Bronk (2002)
BGD
3, 449–474, 2006Ammonium photoproduction
V. Kitidis et al.
Title Page
Abstract Introduction
Conclusions References
Tables Figures
◭ ◮
◭ ◮
Back Close
Full Screen / Esc
Printer-friendly Version
Interactive Discussion
EGU 35
40
15 20 25 30
Longitude (ºE)
L
a
ti
tu
d
e
(º
N
)
Eastern Mediterranean
Study Area
BGD
3, 449–474, 2006Ammonium photoproduction
V. Kitidis et al.
Title Page
Abstract Introduction
Conclusions References
Tables Figures
◭ ◮
◭ ◮
Back Close
Full Screen / Esc
Printer-friendly Version
Interactive Discussion
EGU
Fig. 2.Ammonium concentration in irradiated samples (empty circles) and dark controls (filled
BGD
3, 449–474, 2006Ammonium photoproduction
V. Kitidis et al.
Title Page
Abstract Introduction
Conclusions References
Tables Figures
◭ ◮
◭ ◮
Back Close
Full Screen / Esc
Printer-friendly Version
Interactive Discussion
EGU
0.003
0.004
0.005
0.0
0.5
1.0
1.5
2.0
2.5
3.0
3.5
4.0
4.5
CDOM/DOC
NH4
+
CDOM / DOC (m
-1µmol
-1L)
Photoammonification
rate
(pmol
L
-1
h
-1
/ (W m
-2
))
Fig. 3.Irradiance normalised photoammonification rates against DOC normalised CDOM.