Asymmetrical Damage Partitioning in
Bacteria: A Model for the Evolution of
Stochasticity, Determinism, and Genetic
Assimilation
Lin Chao1*, Camilla Ulla Rang1, Audrey Menegaz Proenca1,2, Jasper Ubirajara Chao1
1Section of Ecology, Behavior and Evolution, Division of Biological Sciences, University of California, San Diego, La Jolla, California, United States of America,2CAPES Foundation, Ministry of Education of Brazil, Brasilia, Brazil
Abstract
Non-genetic phenotypic variation is common in biological organisms. The variation is poten-tially beneficial if the environment is changing. If the benefit is large, selection can favor the evolution of genetic assimilation, the process by which the expression of a trait is transferred from environmental to genetic control. Genetic assimilation is an important evolutionary transition, but it is poorly understood because the fitness costs and benefits of variation are often unknown. Here we show that the partitioning of damage by a mother bacterium to its two daughters can evolve through genetic assimilation. Bacterial phenotypes are also highly variable. Because gene-regulating elements can have low copy numbers, the varia-tion is attributed to stochastic sampling. ExtantEscherichia colipartition asymmetrically and deterministically more damage to the old daughter, the one receiving the mother’s old pole. By modelingin silicodamage partitioning in a population, we show that deterministic asym-metry is advantageous because it increases fitness variance and hence the efficiency of natural selection. However, we find that symmetrical but stochastic partitioning can be simi-larly beneficial. To examine why bacteria evolved deterministic asymmetry, we modeled the effect of damage anchored to the mother’s old pole. While anchored damage strengthens selection for asymmetry by creating additional fitness variance, it has the opposite effect on symmetry. The difference results because anchored damage reinforces the polarization of partitioning in asymmetric bacteria. In symmetric bacteria, it dilutes the polarization. Thus, stochasticity alone may have protected early bacteria from damage, but deterministic asym-metry has evolved to be equally important in extant bacteria. We estimate that 47% of dam-age partitioning is deterministic inE.coli. We suggest that the evolution of deterministic
asymmetry from stochasticity offers an example of Waddington’s genetic assimilation. Our model is able to quantify the evolution of the assimilation because it characterizes the fit-ness consequences of variation.
OPEN ACCESS
Citation:Chao L, Rang CU, Proenca AM, Chao JU (2016) Asymmetrical Damage Partitioning in Bacteria: A Model for the Evolution of Stochasticity,
Determinism, and Genetic Assimilation. PLoS Comput Biol 12(1): e1004700. doi:10.1371/journal. pcbi.1004700
Editor:Mark M. Tanaka, University of New South Wales, AUSTRALIA
Received:September 29, 2015
Accepted:December 10, 2015
Published:January 13, 2016
Copyright:© 2016 Chao et al. This is an open access article distributed under the terms of the
Creative Commons Attribution License, which permits unrestricted use, distribution, and reproduction in any medium, provided the original author and source are credited.
Data Availability Statement:All relevant data are within the paper.
Funding:This work was supported by National Science Foundation(http://www.nsf.gov/) research grant award DEB-1354253 to LC; and CAPES (http:// www.capes.gov.br/) fellowship award to AMP. The funders had no role in study design, data collection and analysis, decision to publish, or preparation of the manuscript.
Author Summary
The benefit of non-genetic variation in phenotypic traits is debated. We show that the par-titioning of damage by a mother bacterium to its two daughters is a variable trait that pro-vides an advantage by generating fitness variation. Present day bacteria partition
asymmetrically more damage to the old daughter, the one receiving the mother’s old pole. By modeling damage partitioning in a population, we find that the asymmetry is advanta-geous because it increases fitness variation and hence the efficiency of natural selection. However, our model also shows that symmetrical but randomly variable partitioning can be similarly beneficial. To examine why bacteria evolved asymmetry, we modeled the effect of damage anchored to the mother’s old pole. While anchored damage strengthens selec-tion for asymmetry by creating addiselec-tional fitness variaselec-tion, it has the opposite effect on symmetry. Thus, symmetrical but randomly variable partitioning may have been sufficient to protect early bacteria from damage. However, natural selection then supplanted it with a genetically controlled mechanism in the form of asymmetrical partitioning. The change from random to genetic control is an important evolutionary transition that is poorly characterized. We are able to quantify this transition because our model estimates the costs and benefits of fitness variation.
Introduction
The costs and benefits of non-genetic phenotypic variation are a long-standing topic of interest in evolutionary biology [1–3]. While the variation introduces a cost by generating suboptimal phenotypes that fail in a set of environments, it also provides a benefit by generating plastic phenotypes that may better match changing or new conditions. The variation is non-genetic because it results from stochasticity or noise in the expression of genes or developmental path-ways controlling the phenotype. The chance matching to change corresponds to a bet-hedging strategy. However, if the new conditions become long term, natural selection shifts to favor genetic modifications in which the initial trait evolves from being stochastically determined to become genetically controlled.
The transition from stochasticity to genetic determinism was independently suggested by Waddington and Schmalhausen [4–6], who also introduced the terms genetic assimilation to denote the process, and canalization to represent the trait’s increasing robustness, or ability to resist environmental perturbations, during assimilation. Working withDrosophila melanoga-ster, Waddington was motivated by his observations on the evolution of the crossveinless (CVL) phenotype, which appeared as a gap in the venation of the fly wing. The phenotype was initially determined by environmental factors because wild type flies, which were not CVL under normal conditions, expressed the gap after their pupae were exposed to a brief heat shock. Waddington then selected for the CVL phenotype after heat shock by using flies expressing the gap as the parents for the next generation. After several generations, not only did the frequency of CVL flies increase in the population, but the flies also had evolved to express the gap without a heat shock. Thus, the CVL phenotype had become genetically assimilated.
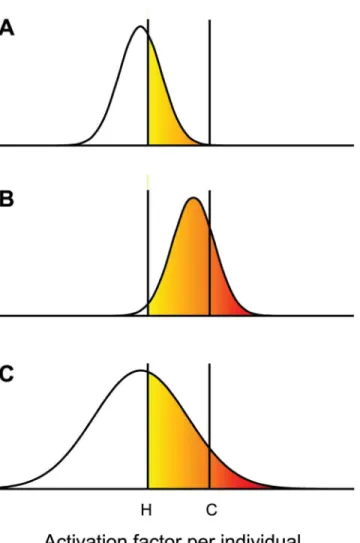
flies can now express CVL. Waddington’s selection evolved flies that expressed CVL at a higher frequency after heat shock. If the higher frequency was achieved by evolving a new distribution that was shifted upwards, some of the selected flies would now exceed the threshold even in the absence of heat shock. An alternative mechanism that increases the variance instead of the mean of the distribution could also explain the expression of CVL in the selected flies (Fig 1C). In the latter case, genetic assimilation would have required the evolution of a deterministic pro-cess to increase the variance above the original stochastic level.
To date, most studies examining the evolution of canalization and genetic assimilation have focused on metazoan examples [7]. This pattern is not surprising given that estimates of Fig 1. Evolution of genetic assimilation.An activation factor is assumed to be needed to express a phenotype such as crossveinless (CVL). The factor is produced stochastically and its concentration varies between individuals within a population. For CVL to be expressed the concentration needs to exceed a threshold. (A) Under Control conditions the threshold has a value C, and CVL is not expressed because no fly in a pre-selection wild type population exceeds the threshold. The effect of subjecting a pre-selection fly pupa to a heat shock is to lower the threshold to a value H, in which case some flies become CVL (yellow fraction). (B) After selection for CVL following heat shock, the selected flies evolved to produce the activation factor with a distribution that has a higher mean. Under Control conditions, more selected flies are CVL after heat shock (yellow and red fraction), but some flies are able to express CVL even under Control conditions (red fraction). (C) Alternatively, selected flies may have evolved an activation factor with a distribution that has a larger variance but the same mean as before selection. CVL is expressed under both Control conditions (red) and after heat shock (yellow and red).
phenotypic variation require measurements of individuals within a population. Because of their small size, microbes, bacteria, fungi, and other single-celled organisms, have traditionally been studied mainly through the mean properties of their populations. However, with the recent advances in the resolution of optical microscopy and, most importantly, computer assis-ted automaassis-ted time-lapse photo-microscopy, quantifying the phenotype of individual cells has become much easier. Elongation, division and growth rates can be obtained from time-lapse images [8–12], while gene expression within single-cells can be quantified by the use of fluores-cence protein reporters [13–16]. The studies generally report a high level of non-genetic phe-notypic variation between individuals within a population of genetically identical cells. By fitting a binomial distribution to the difference between the gene expression levels of two daughter cells descending from the same mother bacterium, the copy number of gene-regulat-ing elements, e.g. a repressor protein, has been estimated to be small [13]. Thus, much of the variation in gene expression may be explained by stochastic or random sampling of the regula-tory elements. Ensuing discussions raised again the need to assess the evolutionary conse-quences of phenotypic stochasticity, but now at the level of single cells [2,17–19]. Issues similar to those discussed by Waddington and Schmalhausen were noted. In particular, what were the benefits and costs of non-genetic phenotypic variation at the fitness level?
The possibility of using microbes to model and test the evolution of canalization and genetic assimilation is appealing. Their ease of culture, short generation times, and amenability to genetic manipulation would allow for using experimental evolution to study the process in real time by natural selection. Although Waddington observed evolutionary changes, he used artifi-cial selection and the fitness benefit of crossveined is unknown. Additionally, because many mathematical and computational models have been developed to describe specifically the gen-eration of phenotypic variation in bacteria [20–24], the experiments can be designed and ana-lyzed in coordination with theory.
Here we present a computational study aimed at identifying the potential costs and benefits of non-genetic stochastic variation in the growth rate phenotype of bacterial cells. We employ a model that we first developed to describe the process by which a mother bacterium determin-istically partitions in an asymmetric manner her load of non-genetic damage, for example oxi-dized macromolecules, to her two daughters [20]. We chose this model because it was designed to complement bacterial data. All of its parameters and several of its key predictions have been estimated or tested with experimental studies [25,26]. The model has revealed that asymmetri-cal partitioning is advantageous because it increases the fitness of a lineage by generating phe-notypic variation and improving the efficiency of natural selection [20]. A more intuitive explanation is provided by the analogy of two compounded interest accounts, one starting with $100 at 8% yr-1and a second split account that starts with $50 at 6% and $50 at 10%. Over time, the split accounts will accrue more money. Asymmetrical partitioning splits the lineages, the lineages with less damage correspond to the 10% account, and exponential growth by binary fission provides the compounded interest. The relationship between fitness variation and the efficiency of natural selection was first recognized by Fisher, who named it the Funda-mental Theorem of Natural Selection [27]. However, although our model has helped our understanding of the evolutionary advantage of asymmetrical partitioning as a deterministic process, the effect of stochastic variation on damage partitioning in the model has previously not been investigated.
damage. Asymmetrical partitioning matches that polarity better because it directs deterministi-cally non-anchored damage to the older pole. By matching polarity, deterministic asymmetry increases even further the variance of damage partitioning. We suggest that the evolution of deterministic asymmetry over stochastic partitioning is an example of genetic assimilation. The only difference between Waddington’s results and ours is that the variation of the trait, rather than the trait itself, is assimilated. We hope that future experiments, both with microbes and metazoans, are motivated by these results.
Results
Basic model of damage partitioning in bacteria
We present first our basic model of damage partitioning, which will be later modified to incor-porate stochastic partitioning. We provide here only an abbreviated summary, which should be sufficient for understanding the application of the model. A more detailed derivation and anal-ysis is provided inMethodsand the original publication [20]. We note that the equations pre-sented here will not be numbered sequentially because some steps prepre-sented inMethodsare omitted. The equations retain the numbering as inMethodsfor consistency.
The basic model is built on the result thatE.colicell division is deterministically asymmetric because a mother cell allocates more non-genetic damage to her old daughter [9,12]. The old and new daughter notation results from the division of rod-shaped bacteria such asE.coli
when the septum cleaves the long axis of the cell (Fig 2). Because two new poles are formed at the septum, poles distal to the septum are the old poles. All bacteria, including mother and daughter bacteria, have a new and an old pole. Whenever a mother bacterium divides, one daughter receives the maternal old pole and the other receives the maternal new pole. The for-mer is denoted the old daughter and the latter the new daughter.
Fig 2. Cell polarity inE.colicells.The cell polarity can be determined by tracking a lineage. Because division cleaves the short axis (-—-) of the cell, poles formed at the cleavage are new (N) and distal poles are old (O). After the next division, the daughter receiving the mother’s new pole is the new daughter and the other is the old daughter.
The model has three parameters,a,λ, andP, which are the asymmetry coefficient, the dam-age rate constant, and the doubling time of the fittest cell with no damdam-age. The coefficienta
measures the amount of damage a mother partitions to the new daughter and it has a value range of 0a½. A value ofa= ½ denotes symmetrical partitioning. The doubling time is the number of minutes required for a bacterial cell to elongate and divide into two daughters. Prepresents therefore the shortest doubling time possible for the bacteria.
A bacterium with damage has a doubling timeTthat is greater thanP. Our basic model derives its doubling time to be
Ti ¼ fð1 kiÞ
p
ðð1 kiÞ
2
2PlÞg=l ð7Þ
whereihas a value of either 1 or 2 to denote the doubling time of either a new or old daughter, respectively,kiis the amount of damage a mother cell partitions to the daughters when it divides, and
k1¼ ðk0þ lT0Þa ð4Þ
k2¼ ðk0þ lT0Þð1 aÞ ð5Þ
With asymmetrical partitioning,k1<k2becausea<½.T0is the doubling time of the mother andk0, the amount of damage it got from its mother, is given as
k0¼ 1 ðl=2ÞT0 P=T0 ð8Þ
Thus, the amount of damage a mother partitions to her daughters isk0plus the amount of new damage it accumulates over its lifetime, which equalsλT0.
The power of the model is that if the doubling timeT0of the mother is known, the doubling timesT1andT2can be predicted.
Model for stochastic partitioning
To examine the effect of stochastic partitioning, we first modified our basic model by allowing the values ofato vary randomly. While everything else was left unchanged, each time that a cell reproduced in the population, its daughters were generated by Eqs4and5with a single value that was sampled from a Gaussian distribution with a meanaand a varianceσ
S2.
To obtain values ofaandσS2, we reevaluated the data of Stewart et al. [9], which we had pre-viously used to estimate the parametersa,λ, andP[20]. The data consisted of 128 trios of observed values ofT0,T1andT2. For each trio, theT1andT2corresponded to the actual daugh-ters produced by theT0mother. Our estimates were obtained by taking the observed values of
T0, using our basic model to obtain predicted values ofT1andT2, and then finding parameter values that minimized the difference (squared deviation) between the predicted and observed
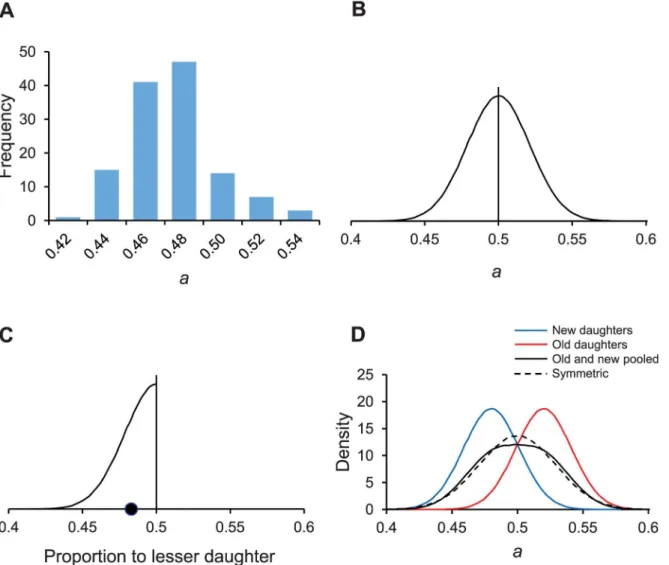
T1andT2. Those estimates were only for parameter means, which werea= .4843,λ= 0.0077 min-1, andP= 18.95 min, because the 128 differences were pooled and minimized as one number. To estimateσS2, we reanalyzed the data set by fitting our model to each individual trio, minimizing the difference, and obtaining 128 separate estimates ofa,λ, andP. From the mean and variances of the 128 estimates (Fig 3A),a= .4845 andσS2= .000456. Mean values for the other two parameters wereλ= 0.0079 min-1andP= 18.30 min. All three means were close to our previous estimates based on pooled data. The rounded values ofa= .48 andσS2= .00046 are used hereafter.
.48 and(1–a)= .52 reflect the deterministic process, andσS2= .00046 represents the magnitude
of the stochastic component.
Fitness advantage of stochastic and asymmetrical partitioning
Natural selection for stochastic and asymmetrical partitioning was modeled by creating a computational model for a population of bacteria. Following descriptions presented in Meth-ods, the population was propagated forward in time with Eqs4,5,7and8, subjected to natural selection for shorter doubling times, and monitored the resulting relative fitness. We first Fig 3. Distributions of the asymmetry coefficienta.The value ofarepresents the proportion of damage partitioned by a mother bacterium to its newdaughter. Asymmetry requires thata< ½. Ifa=½, the partitioning is symmetrical. Distributions are illustrative representations except for (A), which was derived from the experiments of Stewart et al. [9]. (A) Stochastic variation for observed values ofaestimated from experimentalE.colidata. Distribution mean = .4845, varianceσS2= .0004557, and sample size n = 128. (B) Distribution ofawhen the partitioning of damage is stochastic but symmetrical with a mean of½. A Gaussian distribution with a variance ofσS2= .0004557 is assumed for illustration. (C) Distribution of the proportion of damage allocated to the
daughter that gets less damage when partitioning is stochastic but symmetrical. Because symmetrical partitioning is random with respect to whether a daughter is old or new, polarity can be ignored and all the daughters can be re-categorized into ones that get less and ones that get more damage. If only the lesser daughters are considered, the resulting distribution is the half- or folded normal of the Fig 3B distribution. The mean of the half-normal is½—p(σS2•2 / 3.141593. . .), which equals .483 (●). (D) Gaussian distributions representing four populations:aof new daughters (mean = .48; var =σS2= .00046;aof old
daughters (mean = 1–.48 = .52; var =σS2= .00046); a population made by pooling the new and old daughters; and daughters produced by a stochastic but symmetric mother where the variance is increased toσS2+D2/4 = .00046 + .00042/4 = .00086 and mean =½.
compared a simulation of three populations: a symmetrical population (a= ½ andσS2= 0), a stochastic population (a= ½ andσ
S2= .00046), and an asymmetrical population (a= .48 and
σS2= .00046). The values ofP= 18.30 min andλ= 0.0095 min-1were used for the analysis. The value ofλwas set higher because previous analyses have shown that the fitness advantage of asymmetrical partitioning is negligible whenλis small [20]. Elevatingλfavors asymmetrical partitioning because a bacteria that partitions symmetrically cannot survive ifλ>1/6P[20]. Thus, ifP= 18.30,λ= 0.0095 min-1>1/6P.
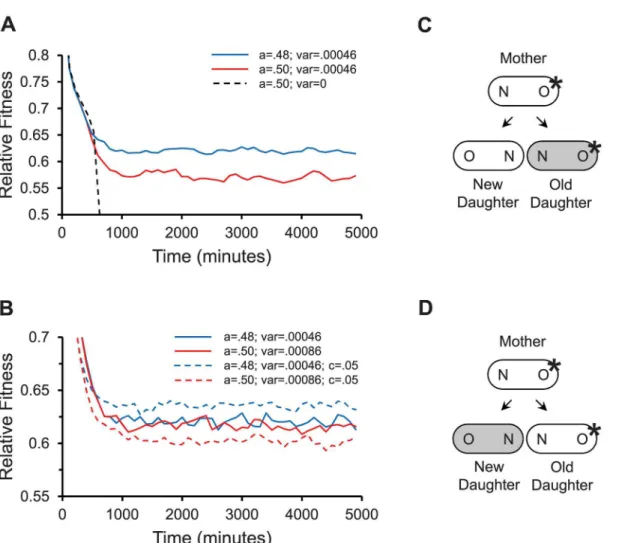
Simulations of the propagation of the three populations showed distinctly different out-comes (Fig 4A). As predicted, the symmetrical population was unable to persist with such a
Fig 4. Modeling fitness for damage partitioning in bacteria.Results report relative fitness over time for populations propagated in a computer model as described (Methods). Parameter values ofλ= .0095 min-1andΠ= 18.30 min were used for all simulations. A relative fitness of .5 corresponds to a severely
damaged and effectively dead cell that no longer can divide. Because fitness stabilizes after about 1500 min with these parameter values, fitness values between 1500 to 5000 min were used to calculate mean fitness. (A) Relative fitness over time for asymmetrical partitioning with stochasticity (a= .48; var =
σS2= .00046); symmetrical partitioning with stochasticity (a=½; var =σS2= .00046); and symmetrical partitioning with no stochasticity (a= .5; var = 0). (B)
Relative fitness over time for asymmetrical partitioning with stochasticity (a= .48; var =σS2= .00046; no anchored damage); symmetrical partitioning with elevated stochasticity (a=½; var =σS2+D2/4 = .00046 + .00042/4 = .00086; no anchored damage); asymmetrical partitioning with stochasticity (a= .48; var
=σS2= .00046; with anchored damageC= .05); symmetrical partitioning with elevated stochasticity (a=½; var =σS2+D2/4 = .00046 + .00042/4 = .00086;
with anchored damageC= .05). (C) Anchored damage in asymmetrically produced daughters. Because asymmetrical partitioning (gray shading) allocates
movable damage to the old daughter and anchored damage (*) is more likely to appear first in the mother’s older pole, the difference between old and new daughters is magnified. The magnification increases the variance of damage partitioning. (D) Anchored damage in symmetrically produced daughters. If partitioning is symmetric but stochastic, 50% of the time movable damage is allocated to the old daughter as in Fig 4C. However the other 50% of the time it is as depicted here, where movable damage (gray shading) is allocated to the new daughter and anchored damage (*) is in the old daughter. The old and new daughters are rendered more similar and the variance of damage partitioning is reduced.
highλ; it went extinct. The stochastic population achieved an intermediate mean fitness that equilibrated around 0.571, while the asymmetrical population fared even better and had a mean fitness of 0.620. However, it is remarkable that the stochastic population was able to sur-vive the damage, when the symmetrical population was not. Its ability to handle damage results from the fact that stochastic partitioning also introduces asymmetry. If a stochastic population partitions damage between old and new daughters witha= ½ andσ
S2= .00046, the distribution
of damage is randomly distributed in regards to the polarity of daughters. A new daughter is just as likely to get more damage as an old daughter (Fig 3B). As a result, it makes no functional difference, from the perspective of damage partitioning, to categorize the two daughters descending from the same mother as old and new. However, it is functionally relevant to cate-gorize them as to the one receiving either more or less damage. The distribution of the ones receiving less becomes then a folded or half-normal distribution. Because a half-normal distri-bution has a mean of ½—p(σS22 / 3.141593. . .) = .483, half of the daughters in a stochastic population are receiving on the average a small percentage of the damage from the mother (Fig 3C). Thus, stochastic partitioning is effectively asymmetric.
Matching fitness of stochastic and asymmetrical partitioning
By being effectively asymmetric, stochastic partitioning, in the same manner as asymmetrical partitioning, provides a fitness advantage by increasing the variance of the amount of damage the daughter bacteria receive. The fitness advantage provided by the two mechanisms should match when the resulting variances are equal. This point of equality can be estimated.
LetVS,VNew, andVOldrepresent the variances of the population of daughters produced by stochastic partitioning and the populations of new and old daughters created by asymmetrical partitioning. Because the amount of damage in the new and old daughters is generated by the same process in the same mother,VNew=VOldand the two variances are estimated by our value ofσ
S2= .000456. Although we assumed earlier thatVS=VNew=VOld, we will now allow
VSto increase to determine when equality ensues. Although the variances of the three popula-tions can be the same, their means are not. While the mean of the stochastic population is½, they are(½–D/2)and(½ + D/2)in the new and old daughter populations, whereDis the dif-ference in the mean proportion of damage asymmetrical partitioning allocates to the old and new daughters. As we estimated the mean proportion to the new daughter to be .48 (see above),D = (1–.48)–.48 = 0.04.
Thus,
VS¼
X
fðiÞ ½aðiÞ 1= 2
2
VNew¼
X
gðiÞ ½xðiÞ ð1=
2 D=2Þ
2
VOld¼
X
gðiÞ ½yðiÞ ð1=
2þD=2Þ
2
wherea(i),x(i), andy(i)are theithamount of damage received by individuals in the stochastic, new, and old populations, andg(i)andf(i)are their frequencies. Ifg(i) = f(i), the partitioning of damage is subject to the same level of stochasticity or noise within the three population.
and thus its total variance is
VTotal¼ f
X
gðiÞ ½xðiÞ 1= 2
2
þXgðiÞ ½yðiÞ 1= 2
2 g=2
The division by 2 is needed because there are two summations. By substituting and rearrang-ing, and noting thatVNew=VOld, the result simplifies to (seeMethodsfor complete derivation)
VTotal¼VNewþD2=4
By using our previous estimates ofVNew=σS2= .00046 andD= .04,VTotal= .00086. Thus, we predict that if the variance generated by stochastic partitioning equalsVTotal= .00086, a stochastic population should have the same relative fitness as an asymmetric popula-tion (Fig 3D). We tested our prediction by comparing the fitness of a stochastic population witha= .5 andσ
S2= .00086 and an asymmetrical population witha= .48 andσS2= .00046,
while holdingPandλat their previous values. Following our described protocols, we simu-lated the populations by propagating them with natural selection (Fig 4B). Supporting our esti-mate that the fitness of two populations should be equal when their variances differ byD2/4, the fitness of the stochastic and asymmetric populations fluctuated around a mean of 0.617 and 0.620, respectively.
The close match between the two populations raises the question of why bacteria evolved to partition damage asymmetrically between their old and new daughters. Given that the parti-tioning of damage is inherently stochastic or noisy in bacteria, as evidenced by our estimate of σS2= .00046 for the fraction of damage allocated to only the new daughter, it follows that bacte-ria could have achieved equivalent fitness gains by simply evolving a higher level of stochasti-city. Evolving asymmetrical partitioning may have been less costly than evolving higher stochasticity, but that raises the second question as to why asymmetrical partitioning biased the allocation of damage to the old daughter, which is the one harboring the older pole of the mother (Fig 2). An answer to both questions may be that the older pole of the mother, by virtue of its higher age, has more damage in anchored and slow-turnover macromolecules, e.g. polar mureins and flagellar motor rings [28,29]. Mureins that form the peptidoglycan structures of cell wall inE.coliare deposited at new poles of daughter cells only at the time they are formed when the mother cell divides (Fig 2). While new mureins are constantly added to the side walls during growth of the daughter cells, the polar mureins remain inert. The presence of such anchored damage polarizes the evolution because variance is increased when non-anchored damage is partitioned to the old daughter (Fig 4C and 4D).
Modeling effects of anchored damage
To test our prediction that some anchored damage may have triggered the evolution of asym-metrical partitioning, we modified our basic model to allow for the buildup of anchored dam-age in the old pole of the mother. A new parameterCwas introduced to represent the fraction of anchored damage. Thus, a fraction(1-C)of non-anchored damage is still asymmetrically partitioned as before, and anchored damage accumulates at a rateCλand non-anchored dam-age at a rate(1–C)λ. The amount of anchored and non-anchored damage in a mother cell at timetisv(t)andw(t)respectively, and
vðtÞ ¼ v0þ Clt
wðtÞ ¼ w0þ ð1 CÞlt
wherev0andw0are the amounts of anchored and non-anchored damage the cell receives at birth from her own mother andk0is redefined to represent the total amount of damage. Because
kðtÞ ¼ vðtÞ þ wðtÞ
¼ k0þ lt
Eqs1,2,3and8in the basic model (seeMethods) are still valid with anchored damage. However Eqs4and5needed to be modified. Because asymmetric partitioning gives the new daughter a fractionaof the non-anchored damage and none of the anchored damage
k1 ¼ wðT0Þa
k2 ¼ wðT0Þð1 aÞ þ vðT0Þ
With these and no additional modifications, Eqs6and7and the basic model could be used to describe the effect of anchored damage on evolution by natural selection in a bacterial popula-tion. Stochasticity was added as before by samplingafrom a Gaussian distribution.
The effect of anchored damage was first investigated by comparing the fitness of stochastic (a= .5 andσS2= .00086) and asymmetric (a= .48 andσS2= .00046) bacterial populations with
C= .05. While mean fitness varied previously around similar values of .617 and .620 in the con-trol stochastic and asymmetric populations (Fig 4B; no anchor), it decreased to .602 in the sto-chastic population and increased to .636 in the asymmetric population in the presence of anchored damage (Fig 4B;C= .05). Thus, anchored damage has a strong effect on polarizing evolution to favor the asymmetrical partitioning of damage to the old daughter.
To examine more broadly the effects ofCandσS2on evolution, we explored how the fitness values of asymmetric and stochastic populations responded to changes in the two parameters (Fig 5). As we had found before, when there was no anchored damage (C= 0) the fitness ratio of the two populations was 1.0 when the variance (σ
S2) ratio equaled .00046 / .00086 = .53, all
ratios reported as asymmetric over stochastic. However, asCwas initially increased from zero, the variance ratio needed to be decreased for the fitness ratio to remain equal to 1.0. In other words, increasingCharmed the stochastic population, which then needed to increase its vari-ance to compensate. Anchored damage is harmful because it reduces varivari-ance in the stochastic population by opposing the effects of stochastic partitioning (seeFig 4D). The fitness advantage provided by anchored damage to the asymmetric population did diminish asCwas increased further, as demonstrated by the leveling of the fitness isoclines. The reason is because asC
increases, the fraction of anchored damage becomes sufficiently large to override the effects of asymmetrical partitioning. In other words, the variance in both asymmetric and stochastic populations becomes largely created by anchored damage, which is always polarized. Nonethe-less, the effect of small values ofCshows clearly that small amounts of anchored damage are needed to promote the evolution of asymmetrical partitioning.
Discussion
equivalent to a maternal effect that results from the provisioning of yolk, other gene products, mRNA’s, or nutrition by a mother to her offspring [1]. The only difference is that the asymmetry increases the variance within the progeny of daughters. The allocation of more damage to the older daughter has been used as model for the evolution of aging [8,9]. Over time a lineage of old daughters can acquire a larger load of damage and experience functional deterioration. Thus, aging is one of the evolutionary costs that cells pay for phenotypic variation.
Although our results demonstrate how asymmetric partitioning is evolutionarily advanta-geous, they also show how stochastic variance created by random noise can be similarly beneficial. Because a population that is stochastic and symmetrical is effectively asymmetric, it also creates daughters that have different levels of damage (Figs3,4and5). Had asymmetric partitioning not evolved, stochastic partitioning could have been one of the most compelling examples of benefi-cial stochasticity. Demonstrating the advantage of stochasticity is difficult because models invok-ing stochasticity generally assume a bet-hedginvok-ing strategy in a changinvok-ing environment. For many biological processes, the probability and magnitude of the fitness payoffs in the new environment are not readily determined. For stochastic partitioning, the effect of random variation on the dou-bling time of old and new daughters is easily translated into fitness and natural selection.
Fig 5. Fitness landscape for damage partitioning with anchored damage.Landscape compares asymmetric and stochastic bacteria (a= .48; var =
.00046) with symmetric and stochastic bacteria (a=½; variance explored over a range of .0046 to .00046). The partitioning variance of asymmetric bacteria
was held constant because this value was the estimate obtained from experimental data inE.coli. All reported ratios are for values of asymmetric bacteria divided by values of symmetric bacteria. Contour lines represent the fitness ratio of mean relative fitness determined from simulated populations after values stabilized (seeFig 4). Parameter values ofλ= .0095 min-1andΠ= 18.30 min were used for all simulations. The x-axis represents values of the fractionCof
anchored damage. The y-axis represents the ratio of the partitioning variance. Region above contour line 1.0 representCand variance ratio values for which
asymmetric bacteria have higher fitness. The points (&,●, and▲) on the surface denote fitness ratios of populations previously presented, respectively, in Fig 3A(variance of symmetric bacteria = .00046; no anchor),Fig 3B(variance of symmetric bacteria = .00086; no anchor), andFig 3B(variance of symmetric bacteria = .00086;C= .05).
Our results can be used to estimate the stochastic and deterministic contributions to the var-iance of damage partitioning. Ifσ
S2= .00046 is the stochastic variance of damage partitioning
in separate populations of new and old daughters, then the total variance in the entire popula-tion isσ
S2+D2/4 = .00046 + .0004 = .00086. Because the differenceDbetween the means of the
new and old daughter populations is deterministically caused by the biology and genetics ofE.
coli,D2/4 = .0004 is deterministic variance. Thus, nearly ½ of the total variance of damage par-titioning is deterministic, or (D2/4) / (σS2+D2/4) = 47%. The remainingσS2/ (σS2+D2/4) = 53% is due to stochasticity.
Because asymmetrical partitioning is the extant phenotype ofE.coli, one could postulate that the ancestral state was 100% stochastic. Stochasticity may have been critically needed to elevate fitness early in evolution, perhaps when the first proto-cells began to evolve. The irony is that the greater the advantage of stochasticity, the stronger natural selection would have favored supplanting it with a deterministic adaptation such as asymmetric partitioning. Repairing damage is another solution [21,30,31], and we expect that to occur and dampen the selection. However, given that asymmetric partitioning is apparent over a generation [9,
12,20,25,26], a significant fraction of damage must be either non-repairable or not easily repaired over that time scale. Because asymmetrical partitioning evolved to allocate more damage to the older daughter, we postulated that the bias could have been triggered by the presence of immovable damage that was anchored to the older pole of the mother cell. Our computational model showed that the conditions for its evolution were favorable and required a small proportion of anchored damage. We postulate that anchored damage constitutes only a small proportion because if it could grow to be 100% of a cell’s damage, an old daughter age should eventually die from the buildup. The empirical observation is instead that the line-age does not die and damline-age levels converge to equilibrium levels [20,25]. Thus, a significant proportion of damage in the old daughter cannot be anchored and it is redistributed, albeit asymmetrically, between the old and new daughters.
If our reconstruction of the evolution of asymmetric partitioning is correct, the supplanting of stochastic process by a deterministic one could constitute a microbial example of Wadding-ton’s genetic assimilation. The main difference is that it was a phenotypic trait, and not its vari-ance, that was assimilated in Waddington’s crossveinless example. However, variance is as good of a trait as any other quantifiable phenotype, and variance was under selection in our model. Moreover, if an increase in the variance of the activation factor, as we proposed inFig 1C, accounts for the assimilation of crossveinless, the evolution of asymmetric partitioning and crossveinless becomes much more comparable. In both cases, the evolution requires the emer-gence of a deterministic mechanism to generate variation.
Methods
The basic model
The model assumes that the amount of damage in a mother cell at any timetis
kðtÞ ¼ k0þ lt ð1Þ
wherek0is the amount of damage the cell receives at birth from her own mother andλis the rate at which new damage accumulates. The mother cell divides when it has built up an intra-cellular productPto a threshold quantityP. Assuming that damage hinders function linearly,
Paccumulates at a rate
dP=dt ¼ 1 kðtÞ
PðtÞ ¼ ð1 k0Þt ðl=2Þt
2
by integration. WhenP(t) =P, the mother cell divides. Denoting that time pointt=T0as her doubling time,P(T0) =Pand
P ¼ ð1 k0ÞT0 ðl=2ÞT0
2 ð2Þ
The integration constantP(0)is set to zero because a new pool of the productPis assumed to be builtde novofor every cell division. At the time of division, the mother cell partitions her damagek(T0) to her two daughters and
kðT0Þ ¼ k0þ lT0 ð3Þ
k(T0) is partitioned asymmetrically to the cell’s daughters in the proportionsaand(1–a). Thus, the daughters receive
k1¼ ðk0þ lT0Þa ð4Þ
k2¼ ðk0þ lT0Þð1 aÞ ð5Þ
where 0a½ and the subscripts 1 and 2 denote the new and old daughters. When each daughter in turn becomes a mother,Eq 2can be resubscripted to annotate the daughters or
P ¼ ð1 kiÞTi ðl=2ÞTi2 ð6Þ
Ti¼ fð1 kiÞ
p
ð ð1 kiÞ
2
2PlÞg=l ð7Þ
by the quadratic formula andi = 1or2.
Thus, givenT0for a mother cell,Tiof her two daughters can be determined.k0inEq 3is obtained by rearrangingEq 2as
k0¼ 1 ðl=2ÞT0 P=T0 ð8Þ
Propagating populations with selection in the computational model
After values of the parametersa,σS2,λ, andPwere chosen to represent stochastic and asym-metrical partitioning, the starting bacterial population of 1000 individuals was established with no initial damage (k0= 0). WithEq 8,T0was determined and used in conjunction with Eqs4,5 and7to predict theT1andT2values for the population of cells the next generation. After reproduction the population was randomly culled to reduce it to 1000 individuals. The process was then iterated forward in time by letting the surviving cells reproduce, which was accom-plished by letting theirk1,T1,k2andT2values serve ask0andT0for the next iteration, and so forth until the mean doubling time of the population remained stable for a sufficiently long time (about 5000 minutes; e.g.Fig 4A and 4B).Natural selection and evolution were imposed spontaneously in the model by scaling time to minutes instead of generations and allowing cells to reproduce only after an increment equal to their doubling time had passed. Cells with shorter doubling times divided more often, and hence were more fit and favored by natural selection.
Calculating relative fitness
which is the doubling time of the most fit and damage free cell (see above). The number of damage free cells increases by a factor of 2 in a time intervalP. A cell with a doubling time of
Tiincreases by a factor of 2P/Tiover the same interval. Thus,
W ¼ 2P=Ti=2
¼ 2ðP=TiÞ 1
Afitness of 1 indicates that a cell has the shortest possible doubling time of thefittest cell. A cell so overloaded with damage that it cannot divide has an infinitely long doubling time, in which case its relativefitness has the lowest possiblefitness value of 0.5. The latter results because the cell persists in the population, but its presence as one cell accounts for only 0.5 of the two daughters made by thefittest cell. Most cells have doubling times andfitness values that fall between these extremes. A population with a meanfitness value of 0.5 goes extinct because it is unable to reproduce.
Mean fitness for populations were determined after doubling times were observed to reach a stable range of values. Noting that all our populations stabilized after about 1500 minutes, mean fitness was determined within the window of 1500 to 5000 min (Fig 4A and 4B).
Solving forVTotal¼VNewþD2
=4
Equation and notation as described in text.
VTotal¼ f
X
gðiÞ ½xðiÞ 1= 2
2
þXgðiÞ ½yðiÞ 1= 2
2 g=2
Adding(D/2–D/2)to the inside of the summations, rearranging, and combining similar terms
2VTotal ¼
P
gðiÞ½xðiÞ 1=
2 þ ðD=2 D=2Þ
2
þP gðiÞ½yðiÞ 1=
2 þ ðD=2 D=2Þ
2
¼ P gðiÞ½xðiÞ ð1=
2 D=2Þ D=2
2
þP gðiÞ½yðiÞ ð1=
2þD=2Þ þ D=2
2
¼ P gðiÞ½xðiÞ2 2xðiÞð1=
2 D=2Þ þ ð1=2 D=2Þ
2
Dð1=
2 D=2Þ þ DxðiÞ þ D2=4
þ P gðiÞ½yðiÞ2 2yðiÞð1=
2þD=2Þ þ ð1=2þD=2Þ
2
Dð1=
2 D=2Þ þ DyðiÞ þ D2=4
¼ P gðiÞ½xðiÞ2 2xðiÞð D=2Þ þ ð1=
2 D=2Þ
2
Dð1=
2 D=2Þ þ D
P
gðiÞxðiÞ þ D2=4
þ PgðiÞ½yðiÞ 2yðiÞð1=
2þD=2Þ þ ð 1
=2þD=2Þ2
Dð1=
2 D=2Þ þ D
P
gðiÞyðiÞ þ D2=4
Noting that∑g(i) x(i) = (½–D/2)and∑g(i) y(i) = (½+D/2)are the means of the new and old daughter populations,∑g(i) = 1,∑g(i)k = kifkis a constant, andVNew= VOld,
2VTotal ¼
X
gðiÞ½xðiÞ ð1=
2 D=2Þ
2
Dð1=
2 D=2Þ þ Dð1=2 D=2Þ þ D2=4
þXgðiÞ½yðiÞ ð1=
2þD=2Þ
2
Dð1=
2þD=2Þ þ Dð 1
=2þD=2Þ þ D2=4
¼ VNewþ VOldþ2D2=4
Acknowledgments
We thank S. Rifkin, W. Loomis, K. Zeger, S. Gurol, and S. Kuo for discussions, E. Lin, D. Hin, E. Hsiung, J. Jung, K. Chi, S. Schwartz, M. Metzgar C. Aguzzoli, R. Mehta, T. Wooldridge, and J. Kenchel for data assistance, and B. Charlesworth for describingFig 1A and 1B.
Author Contributions
Conceived and designed the experiments: LC CUR AMP JUC. Performed the experiments: LC. Analyzed the data: LC CUR AMP JUC. Contributed reagents/materials/analysis tools: LC. Wrote the paper: LC CUR.
References
1. Falconer DS. Introduction to Quantitative Genetics. 2nd ed. New York, N.Y.: Longman Inc.; 1981.
2. Kilfoil ML, Lasko P, Abouheif E. Stochastic variation: from single cells to superorganisms. Hfsp Journal. 2009 Dec; 3(6):379–85. doi:10.2976/1.3223356PMID:20514130
3. Pigliucci M, Murren CJ, Schlichting CD. Phenotypic plasticity and evolution by genetic assimilation. Journal of Experimental Biology. 2006 Jun 15; 209(12):2362–7.
4. Schmalhausen II. Factors of evolution: The Theory of Stabilizing Selection Originally Published: Blakis-ton Co., Philadelphia; 1949. Reprint edition: University of Chicago Press, Chicago; 1986.
5. Waddington CH. Canalization of development and the inheritance of acquired characters. Nature. 1942 Jul-Dec; 150:563–5.
6. Waddington CH. Genetic Assimilation of an Acquired Character. Evolution. 1953; 7(2):118–26.
7. Pigliucci M, Murren CJ. Perspective: Genetic assimilation and a possible evolutionary paradox: Can macroevolution sometimes be so fast as to pass us by? Evolution. 2003 Jul; 57(7):1455–64. PMID: 12940351
8. Ackermann M, Stearns SC, Jenal U. Senescence in a bacterium with asymmetric division. Science. 2003 Jun 20; 300(5627):1920-. PMID:12817142
9. Stewart EJ, Madden R, Paul G, Taddei F. Aging and death in an organism that reproduces by morpho-logically symmetric division. Plos Biology. 2005 Feb; 3(2):295–300.
10. Veening JW, Stewart EJ, Berngruber TW, Taddei F, Kuipers OP, Hamoen LW. Bet-hedging and epige-netic inheritance in bacterial cell development. Proc Natl Acad Sci U S A. 2008 Mar 18; 105(11):4393–
8. doi:10.1073/pnas.0700463105PMID:18326026
11. Wang P, Robert L, Pelletier J, Dang WL, Taddei F, Wright A, et al. Robust Growth of Escherichia coil. Current Biology. 2010 Jun 22; 20(12):1099–103. doi:10.1016/j.cub.2010.04.045PMID:20537537
12. Lindner AB, Madden R, Demarez A, Stewart EJ, Taddei F. Asymmetric segregation of protein aggre-gates is associated with cellular aging and rejuvenation. Proc Natl Acad Sci U S A. 2008 Feb 26; 105 (8):3076–81. doi:10.1073/pnas.0708931105PMID:18287048
13. Elowitz MB, Levine AJ, Siggia ED, Swain PS. Stochastic gene expression in a single cell. Science. 2002 Aug 16; 297(5584):1183–6. PMID:12183631
14. Rosenfeld N, Young JW, Alon U, Swain PS, Elowitz MB. Gene regulation at the single-cell level. Sci-ence. 2005 Mar 25; 307(5717):1962–5. PMID:15790856
15. Kiviet DJ, Nghe P, Walker N, Boulineau S, Sunderlikova V, Tans SJ. Stochasticity of metabolism and growth at the single-cell level. Nature. 2014 Oct 16; 514(7522):376–9. doi:10.1038/nature13582 PMID:25186725
16. Raser JM, O'Shea EK. Noise in Gene Expression: Origins, Consequences, and Control. Science (New York, NY). 2005; 309(5743):2010–3.
17. Wang Z, Zhang JZ. Impact of gene expression noise on organismal fitness and the efficacy of natural selection. Proceedings of the National Academy of Sciences of the United States of America. 2011 Apr 19; 108(16):E67–E76. doi:10.1073/pnas.1100059108PMID:21464323
18. Kaern M, Elston TC, Blake WJ, Collins JJ. Stochasticity in gene expression: from theories to pheno-types. Nat Rev Genet. 2005; 6(6):451–64. PMID:15883588
19. Fedoroff N, Fontana W. Genetic networks: Small numbers of big molecules. Science. 2002 Aug 16; 297(5584):1129–31. PMID:12183614
21. Ackermann M, Chao L, Bergstrom CT, Doebeli M. On the evolutionary origin of aging. Aging Cell. 2007 Apr; 6(2):235–44. PMID:17376147
22. Erjavec N, Cvijovic M, Klipp E, Nystrom T. Selective benefits of damage partitioning in unicellular sys-tems and its effects on aging. Proc Natl Acad Sci U S A. 2008 Dec 2; 105(48):18764–9. doi:10.1073/ pnas.0804550105PMID:19020097
23. Evans SN, Steinsaltz D. Damage segregation at fissioning may increase growth rates: A superprocess model. Theoretical Population Biology. 2007 Jun; 71(4):473–90. PMID:17442356
24. Watve M, Parab S, Jogdand P, Keni S. Aging may be a conditional strategic choice and not an inevita-ble outcome for bacteria. Proceedings of the National Academy of Sciences. 2006 October 3, 2006; 103(40):14831–5.
25. Rang CU, Peng AY, Chao L. Temporal Dynamics of Bacterial Aging and Rejuvenation. Current biology 2011; 21(21):1813–6. doi:10.1016/j.cub.2011.09.018PMID:22036179
26. Rang CU, Peng AY, Poon AF, Chao L. Ageing in Escherichia coli requires damage by an extrinsic agent. Microbiology. 2012 Jun; 158:1553–9. doi:10.1099/mic.0.057240-0PMID:22422756
27. Fisher RA. The Genetical Theory of Natural Selection. 2nd Revised Edition ed. New York: Dover Pub-ilcations, Inc.; 1958.
28. Fukuoka H, Inoue Y, Terasawa S, Takahashi H, Ishijima A. Exchange of rotor components in function-ing bacterial flagellar motor. Biochemical and Biophysical Research Communications. 2010 Mar 26; 394(1):130–5. doi:10.1016/j.bbrc.2010.02.129PMID:20184859
29. Janakiraman A, Goldberg MB. Recent advances on the development of bacterial poles. Trends in Microbiology. 2004 Nov; 12(11):518–25. PMID:15488393
30. Clegg RJ, Dyson RJ, Kreft JU. Repair rather than segregation of damage is the optimal unicellular aging strategy. Bmc Biology. 2014 Aug 16; 12.